

The DOI matches its Crossref record; 53 of the 53 references it cites were found in a registry or an index.
The Microbiota of Breast Tissue and Its Association with Breast Cancer
Open accessAbstract
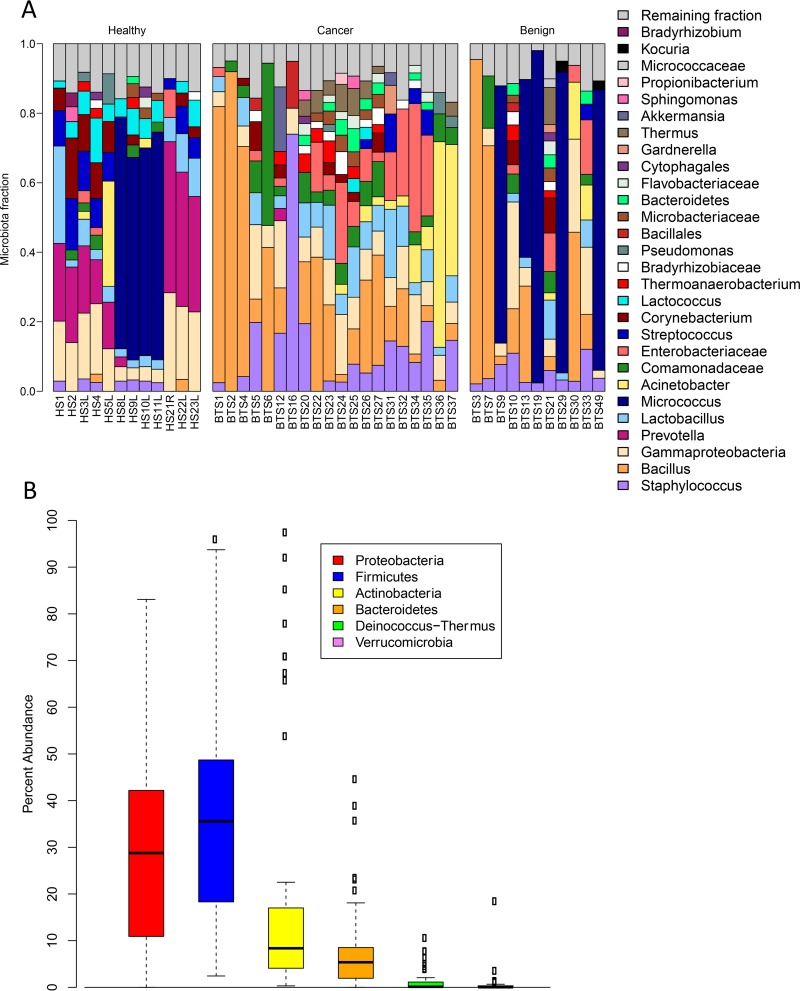
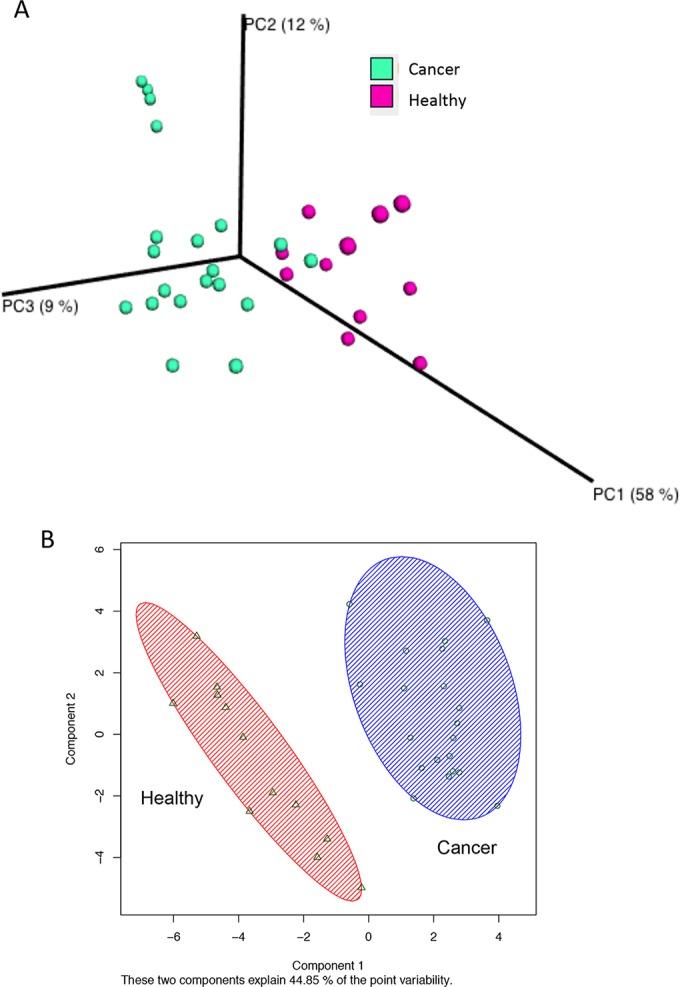
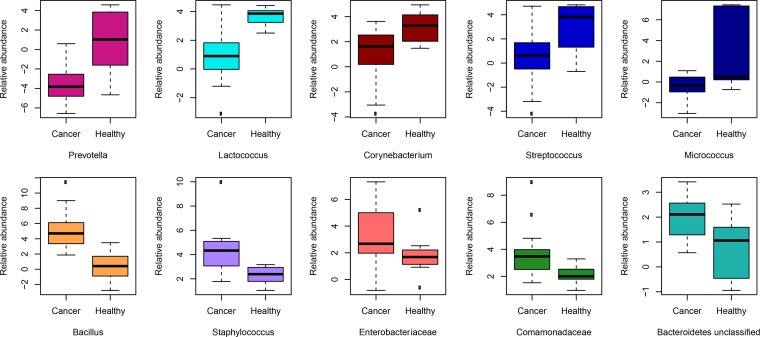
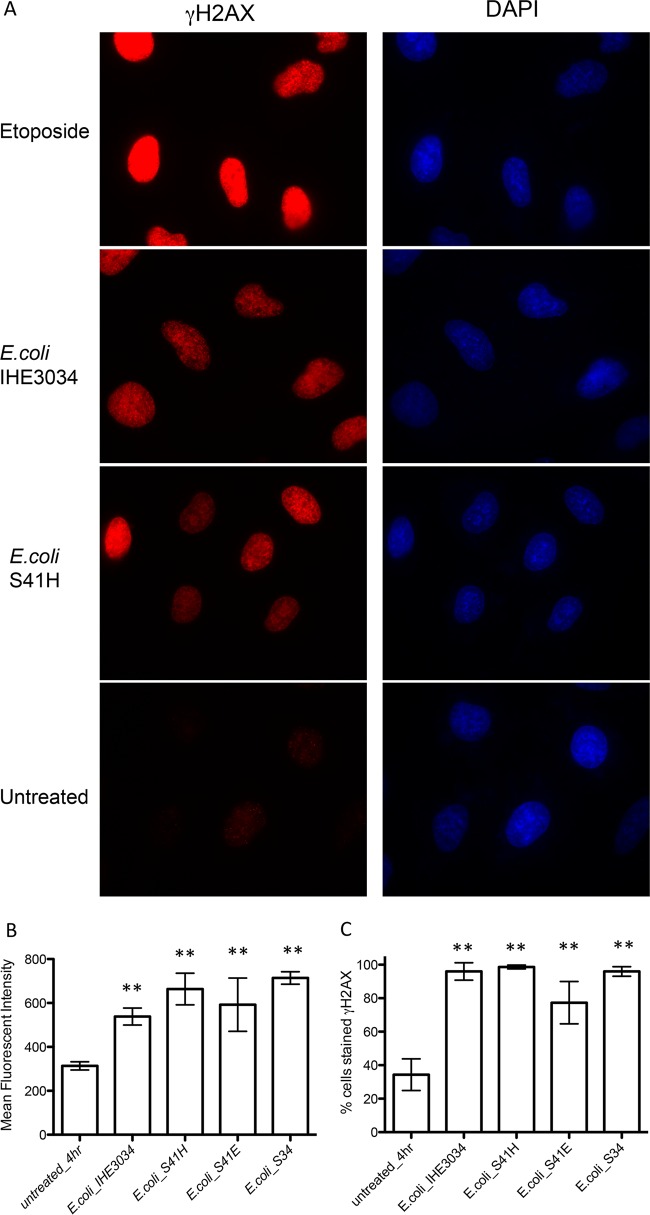
UNLABELLED: In the United States, 1 in 8 women will be diagnosed with breast cancer in her lifetime. Along with genetics, the environment contributes to disease development, but what these exact environmental factors are remains unknown. We have previously shown that breast tissue is not sterile but contains a diverse population of bacteria. We thus believe that the host's local microbiome could be modulating the risk of breast cancer development. Using 16S rRNA amplicon sequencing, we show that bacterial profiles differ between normal adjacent tissue from women with breast cancer and tissue from healthy controls. Women with breast cancer had higher relative abundances of Bacillus, Enterobacteriaceae and Staphylococcus Escherichia coli (a member of the Enterobacteriaceae family) and Staphylococcus epidermidis, isolated from breast cancer patients, were shown to induce DNA double-stranded breaks in HeLa cells using the histone-2AX (H2AX) phosphorylation (γ-H2AX) assay. We also found that microbial profiles are similar between normal adjacent tissue and tissue sampled directly from the tumor. This study raises important questions as to what role the breast microbiome plays in disease development or progression and how we can manipulate this for possible therapeutics or prevention. IMPORTANCE: This study shows that different bacterial profiles in breast tissue exist between healthy women and those with breast cancer. Higher relative abundances of bacteria that had the ability to cause DNA damage in vitro were detected in breast cancer patients, as was a decrease in some lactic acid bacteria, known for their beneficial health effects, including anticarcinogenic properties. This study raises important questions as to the role of the mammary microbiome in modulating the risk of breast cancer development.
Overview
The claims and statistics of this paper haven’t been checked yet.
Run the check — free, no account needed. It reads the open-access text and checks the sources it cites.
Integrity signals
Registry
Cites
Statistics
Figures
Verification
Claims the paper makes
The claims and statistics of this paper haven’t been checked yet.
Run the check — free, no account needed. It reads the open-access text and checks the sources it cites.
Claims other papers make about this one
Each is checked against this paper’s own text: does it say what the citing paper says it does?
In the citing paper
“However, other studies have indeed shown cultivable bacteria in breast (127–129), lung (18), prostate (130, 131), pancreas (14, 15), and colon cancers (19, 132)”
From The microbiome and human cancer (2021) · cites this paper as [128]
Self-check
Percentages, sums and reported differences re-computed from the paper’s own numbers.
The self-check needs the paper’s full text.
Citations
Cites
QIIME allows analysis of high-throughput community sequencing data
Caporaso, J. G., Kuczynski, J., Stombaugh, J., Bittinger, K., Bushman, F. D., Costello, E. K., Fierer, N., Peña, A. G., Goodrich, J. K., Gordon, J. I., et al. (2010) · Nature Methods · doi:10.1038/nmeth.f.303 · Cited by 34,887
Search and clustering orders of magnitude faster than BLAST
Edgar, R. C. (2010) · Bioinformatics · doi:10.1093/bioinformatics/btq461 · Cited by 21,098
MUSCLE: a multiple sequence alignment method with reduced time and space complexity
Edgar, R. C. (2004) · BMC Bioinformatics · doi:10.1186/1471-2105-5-113 · Cited by 9,119
UniFrac: a New Phylogenetic Method for Comparing Microbial Communities
Lozupone, C., & Knight, R. (2005) · Applied and Environmental Microbiology · doi:10.1128/aem.71.12.8228-8235.2005 · Cited by 8,227
A core gut microbiome in obese and lean twins
Turnbaugh, P. J., Hamady, M., Yatsunenko, T., Cantarel, B. L., Duncan, A., Ley, R. E., Sogin, M. L., Jones, W. J., Roe, B. A., Affourtit, J. P., et al. (2009) · Nature · doi:10.1038/nature07540 · Cited by 7,823
Pruesse, E., Quast, C., Knittel, K., Fuchs, B. M., Ludwig, W., Peplies, J., & Glöckner, F. O. (2007) · Nucleic Acids Research · doi:10.1093/nar/gkm864 · Cited by 6,682
FastTree: Computing Large Minimum Evolution Trees with Profiles instead of a Distance Matrix
Price, M. N., Dehal, P. S., & Arkin, A. P. (2009) · Molecular Biology and Evolution · doi:10.1093/molbev/msp077 · Cited by 5,602
Frank, D. N., St. Amand, A. L., Feldman, R. A., Boedeker, E. C., Harpaz, N., & Pace, N. R. (2007) · Proceedings of the National Academy of Sciences · doi:10.1073/pnas.0706625104 · Cited by 4,611
The Statistical Analysis of Compositional Data
Aitchison, J. (1986) · doi:10.1007/978-94-009-4109-0 · Cited by 4,383
The Statistical Analysis of Compositional Data
Piepel, G. F., & Aitchison, J. (1988) · Technometrics · doi:10.2307/1270335 · Cited by 3,451
Cited by
Sorted by citations
The human tumor microbiome is composed of tumor type–specific intracellular bacteria
Nejman, D., Livyatan, I., Fuks, G., Gavert, N., Zwang, Y., Geller, L. T., Rotter-Maskowitz, A., Weiser, R., Mallel, G., Gigi, E., et al. (2020) · Science · doi:10.1126/science.aay9189 · Cited by 2,464
The microbiome and human cancer
Sepich-Poore, G. D., Zitvogel, L., Straussman, R., Hasty, J., Wargo, J. A., & Knight, R. (2021) · Science · doi:10.1126/science.abc4552 · Cited by 1,332
The microbiome, cancer, and cancer therapy
Helmink, B. A., Khan, M. A. W., Hermann, A., Gopalakrishnan, V., & Wargo, J. A. (2019) · Nature Medicine · doi:10.1038/s41591-019-0377-7 · Cited by 1,200
Tumor-resident intracellular microbiota promotes metastatic colonization in breast cancer
Fu, A., Yao, B., Dong, T., Chen, Y., Yao, J., Liu, Y., Li, H., Bai, H., Liu, X., Zhang, Y., et al. (2022) · Cell · doi:10.1016/j.cell.2022.02.027 · Cited by 981
Tumor biomarkers for diagnosis, prognosis and targeted therapy
Zhou, Y., Tao, L., Qiu, J., Xu, J., Yang, X., Zhang, Y., Tian, X., Guan, X., Cen, X., & Zhao, Y. (2024) · Signal Transduction and Targeted Therapy · doi:10.1038/s41392-024-01823-2 · Cited by 836
Metadata
- Authors
- Urbaniak, C., Gloor, G. B., Brackstone, M., Scott, L., Tangney, M., & Reid, G.
- Affiliations
- Western University (CA)
- London Regional Cancer Program, London, Ontario, Canada
- University College Cork (IE)
- Corresponding author
- Reid, Gregor
- Venue
- Applied and Environmental Microbiology
- Publisher
- American Society for Microbiology
- Published
- 2016-08-15
- Volume
- 82
- Issue
- 16
- Pages
- 5039-5048
- ISSN
- 0099-2240 (ISSN-L)
- 1098-5336
- PMC
- PMC4968547
- OpenAlex
- W2493607481
- Cited by
- 625
- References
- 53
- Citations by year
- 2026: 51 · 2025: 102 · 2024: 75 · 2023: 82 · 2022: 68 · 2021: 88 · 2020: 63 · 2019: 41 · 2018: 29 · 2017: 19 · 2016: 5
- FWCI
- 16.29
- Type
- journal article
- Language
- en
- Open access
- hybrid
- doi.org
- Licence
- Locations
- Applied and Environmental Microbiology (publishedVersion, cc-by)
- Europe PMC (PubMed Central) (publishedVersion, cc-by)
- PubMed Central (publishedVersion, cc-by)
- PubMed (publishedVersion)
- Arrow@dit (Dublin Institute of Technology) (submittedVersion, cc-by)
- Cork Open Research Archive (University College Cork, Ireland) (submittedVersion, cc-by)
- Scholarship@Western (Western University) (submittedVersion)
- Funders
- Canadian Institutes of Health Research
- Topics
- Life Sciences › Biochemistry, Genetics and Molecular Biology › Molecular Biology › Gut microbiota and health
- Health Sciences › Dentistry › Periodontics › Oral microbiology and periodontitis research
- Life Sciences › Immunology and Microbiology › Microbiology › Reproductive tract infections research
- Keywords
- breast microbiome, breast cancer, bacterial diversity, adjacent normal tissue, tumor tissue, Bacillus, Enterobacteriaceae, Staphylococcus epidermidis, Escherichia coli, DNA double-strand breaks, H2AX phosphorylation, lactic acid bacteria, cancer risk, environmental factors
- MeSH terms
- Adult, Aged, Aged, 80 and over, Bacteria, Breast, Breast Neoplasms, Female, Humans, Middle Aged, Ontario, RNA, Ribosomal, 16S, Sequence Analysis, DNA, Young Adult, Microbiota
About these checks
Registry, retraction, Cites and statistics results are computed, not judged, with one exception: a printed reference that no index lists is read once by a model before it counts as a citation error. Claims are extracted by a model and kept only when their quote appears verbatim in the text; each cited source is then checked, with a model’s help, for whether it says what the claim relies on. Those verdicts can be wrong — read the claim’s quote and the cited source before relying on one.
Statistics and arithmetic are recomputed, not judged.
Confidence bands are shown only for fields calibrated on our annotated test set. None is calibrated yet, so no band is shown.
What counts as a claim ›How we measure confidence ›How we check this ›
Are you an author, or do you see a problem with this page? Request a review
