

Longitudinal Transcriptome Analysis Reveals a Sustained Differential Gene Expression Signature in Patients Treated for Acute Lyme Disease
Open accessThe DOI matches its Crossref record; 56 of the 56 references it cites were found in a registry or an index.
Abstract
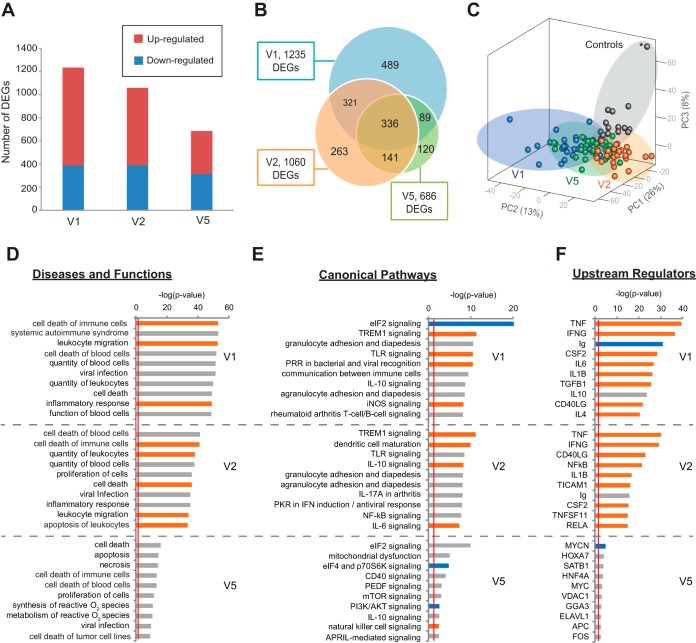
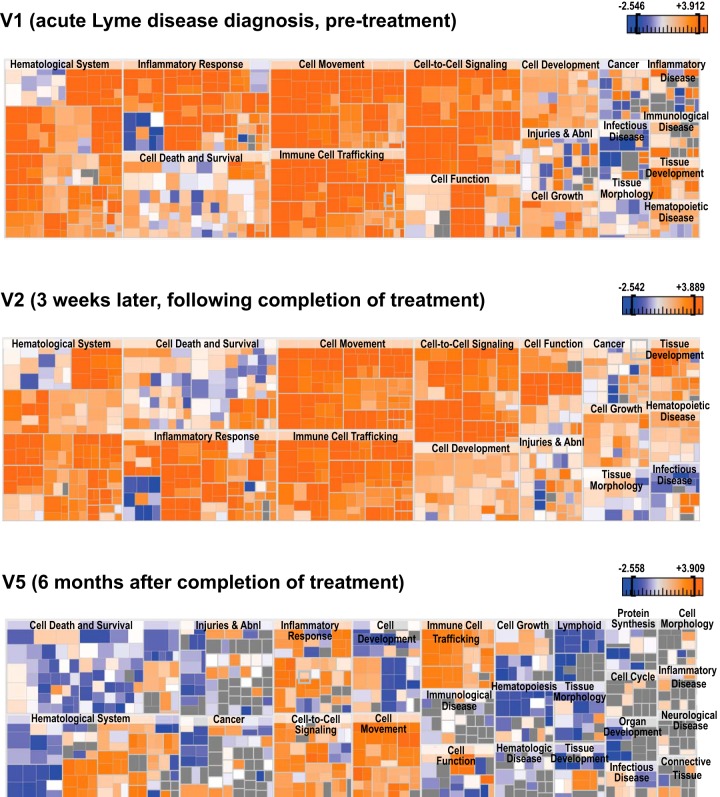
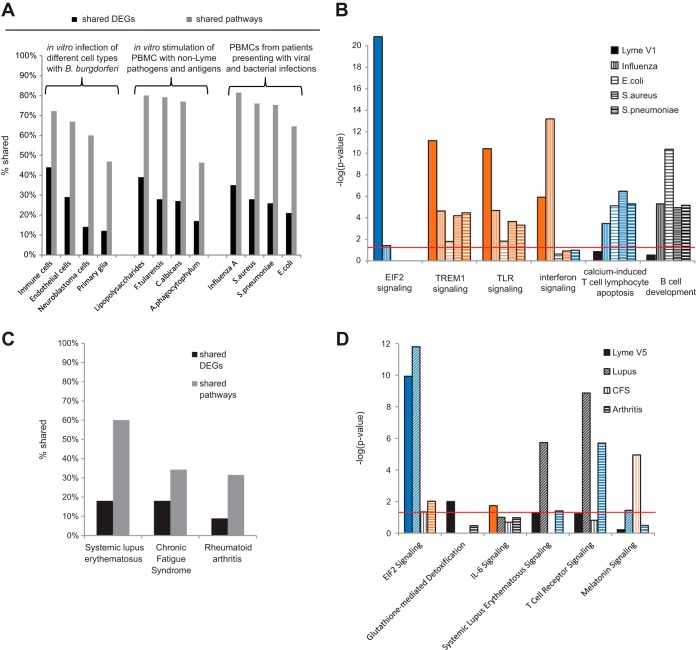
Lyme disease is a tick-borne illness caused by the bacterium Borrelia burgdorferi , and approximately 10 to 20% of patients report persistent symptoms lasting months to years despite appropriate treatment with antibiotics. To gain insights into the molecular basis of acute Lyme disease and the ensuing development of post-treatment symptoms, we conducted a longitudinal transcriptome study of 29 Lyme disease patients (and 13 matched controls) enrolled at the time of diagnosis and followed for up to 6 months. The differential gene expression signature of Lyme disease following the acute phase of infection persisted for at least 3 weeks and had fewer than 44% differentially expressed genes (DEGs) in common with other infectious or noninfectious syndromes. Early Lyme disease prior to antibiotic therapy was characterized by marked upregulation of Toll-like receptor signaling but lack of activation of the inflammatory T-cell apoptotic and B-cell developmental pathways seen in other acute infectious syndromes. Six months after completion of therapy, Lyme disease patients were found to have 31 to 60% of their pathways in common with three different immune-mediated chronic diseases. No differential gene expression signature was observed between Lyme disease patients with resolved illness to those with persistent symptoms at 6 months post-treatment. The identification of a sustained differential gene expression signature in Lyme disease suggests that a panel of selected human host-based biomarkers may address the need for sensitive clinical diagnostics during the “window period” of infection prior to the appearance of a detectable antibody response and may also inform the development of new therapeutic targets. IMPORTANCE Lyme disease is the most common tick-borne infection in the United States, and some patients report lingering symptoms lasting months to years despite antibiotic treatment. To better understand the role of the human host response in acute Lyme disease and the development of post-treatment symptoms, we conducted the first longitudinal gene expression (transcriptome) study of patients enrolled at the time of diagnosis and followed up for up to 6 months after treatment. Importantly, we found that the gene expression signature of early Lyme disease is distinct from that of other acute infectious diseases and persists for at least 3 weeks following infection. This study also uncovered multiple previously undescribed pathways and genes that may be useful in the future as human host biomarkers for diagnosis and that constitute potential targets for the development of new therapies.
Overview
The claims and statistics of this paper haven’t been checked yet.
Free: it reads the open-access text and checks the first 5 claims that cite a source we can check. Create a free account to check every claim.
Integrity signals
Registry
Cites
Statistics
Figures

Verification
Claims the paper makes
The claims and statistics of this paper haven’t been checked yet.
Free: it reads the open-access text and checks the first 5 claims that cite a source we can check. Create a free account to check every claim.
Claims other papers make about this one
Each is checked against this paper’s own text: does it say what the citing paper says it does?
The cited source says what the claim attributes to it.
In the citing paper
“Moreover, RNA-seq analyses of the human host can be used to identify novel or underappreciated host–microbial interactions directly from clinical samples, as previously shown for patients with Lyme disease68, dengue80 or malaria81.”
From Clinical metagenomics (2019) · cites this paper as [68]
In the citing paper
“Classification of genes by expression profiling using RNA-seq has been used to characterize several infections, including staphylococcal bacteraemia67, Lyme disease68, candidiasis69, tuberculosis (discriminating between latent and active disease risk)70–72 and influenza73–75.”
From Clinical metagenomics (2019) · cites this paper as [68]
Self-check
Percentages, sums and reported differences re-computed from the paper’s own numbers.
The self-check needs the paper’s full text.
Citations
Cites
limma powers differential expression analyses for RNA-sequencing and microarray studies
Ritchie, M. E., Phipson, B., Wu, D., Hu, Y., Law, C. W., Shi, W., & Smyth, G. K. (2015) · Nucleic Acids Research · doi:10.1093/nar/gkv007 · Cited by 40,458
Trapnell, C., Roberts, A., Goff, L., Pertea, G., Kim, D., Kelley, D. R., Pimentel, H., Salzberg, S. L., Rinn, J. L., & Pachter, L. (2012) · Nature Protocols · doi:10.1038/nprot.2012.016 · Cited by 12,116
Bolstad, B. M., Irizarry, R. A., Åstrand, M., & Speed, T. P. (2003) · Bioinformatics · doi:10.1093/bioinformatics/19.2.185 · Cited by 8,266
voom: precision weights unlock linear model analysis tools for RNA-seq read counts
Law, C. W., Chen, Y., Shi, W., & Smyth, G. K. (2014) · Genome Biology · doi:10.1186/gb-2014-15-2-r29 · Cited by 6,155
Causal analysis approaches in Ingenuity Pathway Analysis
Krämer, A., Green, J., Pollard, J., & Tugendreich, S. (2014) · Bioinformatics · doi:10.1093/bioinformatics/btt703 · Cited by 5,724 · cited 1×
“Avg age (yr) 52 (36–61) [20–71] 50 (42–61) [22–70] 0.”
Wormser, G. P., Dattwyler, R. J., Shapiro, E. D., Halperin, J. J., Steere, A. C., Klempner, M. S., Krause, P. J., Bakken, J. S., Strle, F., Stanek, G., et al. (2006) · Clinical Infectious Diseases · doi:10.1086/508667 · Cited by 2,087
Stanek, G., Wormser, G. P., Gray, J., & Strle, F. (2012) · The Lancet · doi:10.1016/s0140-6736(11)60103-7 · Cited by 1,237
Steere, A. C., Coburn, J., & Glickstein, L. (2004) · Journal of Clinical Investigation · doi:10.1172/jci200421681 · Cited by 788
(1995) · JAMA: The Journal of the American Medical Association · doi:10.1001/jama.1995.03530120023018 · Cited by 590
Gene expression patterns in blood leukocytes discriminate patients with acute infections
Ramilo, O., Allman, W., Chung, W., Mejias, A., Ardura, M., Glaser, C., Wittkowski, K. M., Piqueras, B., Banchereau, J., Palucka, A. K., et al. (2007) · Blood · doi:10.1182/blood-2006-02-002477 · Cited by 482
Cited by
Chiu, C. Y., & Miller, S. A. (2019) · Nature Reviews Genetics · doi:10.1038/s41576-019-0113-7 · Cited by 1,620
Self-citationAlevin efficiently estimates accurate gene abundances from dscRNA-seq data
Srivastava, A., Malik, L., Smith, T., Sudbery, I., & Patro, R. (2019) · Genome Biology · doi:10.1186/s13059-019-1670-y · Cited by 273
Radolf, J. D., Strle, K., Lemieux, J. E., & Strle, F. (2020) · Current Issues in Molecular Biology · doi:10.21775/cimb.042.333 · Cited by 222
Recent Progress in Lyme Disease and Remaining Challenges
Bobe, J. R., Jutras, B. L., Horn, E. J., Embers, M. E., Bailey, A., Moritz, R. L., Zhang, Y., Soloski, M. J., Ostfeld, R. S., Marconi, R. T., et al. (2021) · Frontiers in Medicine · doi:10.3389/fmed.2021.666554 · Cited by 199
Self-citationNetwork Medicine in the Age of Biomedical Big Data
Sonawane, A. R., Weiss, S. T., Glass, K., & Sharma, A. (2019) · Frontiers in Genetics · doi:10.3389/fgene.2019.00294 · Cited by 186
Laboratory Diagnosis of Lyme Borreliosis
Branda, J. A., & Steere, A. C. (2021) · Clinical Microbiology Reviews · doi:10.1128/cmr.00018-19 · Cited by 170
dtangle: accurate and robust cell type deconvolution
Hunt, G. J., Freytag, S., Bahlo, M., & Gagnon-Bartsch, J. A. (2019) · Bioinformatics · doi:10.1093/bioinformatics/bty926 · Cited by 154
A diagnostic host response biosignature for COVID-19 from RNA profiling of nasal swabs and blood
Ng, D., Granados, A. C., Santos, Y. A., Servellita, V., Goldgof, G. M., Meydan, C., Sotomayor-González, A., Levine, A. G., Balcerek, J., Han, L. M., et al. (2021) · Science Advances · doi:10.1126/sciadv.abe5984 · Cited by 112
Self-citationImmune Response to Borrelia : Lessons from Lyme Disease Spirochetes
Bockenstedt, L. K., Wooten, R. M., & Baumgarth, N. (2020) · Current Issues in Molecular Biology · doi:10.21775/cimb.042.145 · Cited by 81
Estimation of cumulative number of post-treatment Lyme disease cases in the US, 2016 and 2020
DeLong, A. K., Hsu, M., & Kotsoris, H. O. (2019) · BMC Public Health · doi:10.1186/s12889-019-6681-9 · Cited by 66
Functional and Genomic Architecture of Borrelia burgdorferi -Induced Cytokine Responses in Humans
Oosting, M., Kerstholt, M., ter Horst, R., Li, Y., Deelen, P., Smeekens, S. P., Jaeger, M., Lachmandas, E., Vrijmoeth, H. D., Lupșe, M. S., et al. (2016) · Cell Host & Microbe · doi:10.1016/j.chom.2016.10.006 · Cited by 65
Validation of a host response test to distinguish bacterial and viral respiratory infection
Lydon, E., Henao, R., Burke, T. W., Aydın, M., Nicholson, B. P., Glickman, S. W., Fowler, V. G., Quackenbush, E., Cairns, C. B., Kingsmore, S. F., et al. (2019) · EBioMedicine · doi:10.1016/j.ebiom.2019.09.040 · Cited by 65
Deshpande, G., Beetch, J. E., Heller, J. G., Naqvi, O. H., & Kuhn, K. G. (2023) · Microorganisms · doi:10.3390/microorganisms12010050 · Cited by 64
The Potential Role of Clinical Metagenomics in Infectious Diseases: Therapeutic Perspectives
d’Humières, C., Salmona, M., Dellière, S., Léo, S., Rodriguez, C., Angebault, C., Alanio, A., Fourati, S., Lazarević, V., Woerther, P., et al. (2021) · Drugs · doi:10.1007/s40265-021-01572-4 · Cited by 57
Ohrtman, E. A., Shapiro, G. D., Simko, L. C., Dore, E. C., Slavin, M. D., Saret, C. J., Amaya, F., Lomelín‐Gascón, J., Ni, P., Acton, A., et al. (2018) · Journal of Burn Care & Research · doi:10.1093/jbcr/iry038 · Cited by 55
Taguchi, K., Chen, L., Usawachintachit, M., Hamamoto, S., Kang, M., Sugino, T., Unno, R., Tzou, D. T., Sherer, B. A., Okada, A., et al. (2020) · Kidney International · doi:10.1016/j.kint.2020.01.042 · Cited by 54
Persistent Symptoms After Treatment of Lyme Disease
Marques, A. R. (2022) · Infectious Disease Clinics of North America · doi:10.1016/j.idc.2022.04.004 · Cited by 52
Role of glutathione metabolism in host defense against Borrelia burgdorferi infection
Kerstholt, M., Vrijmoeth, H. D., Lachmandas, E., Oosting, M., Lupșe, M. S., Flonta, M., Dinarello, C. A., Netea, M. G., & Joosten, L. A. B. (2018) · Proceedings of the National Academy of Sciences · doi:10.1073/pnas.1720833115 · Cited by 45
Tick-Pathogen Ensembles: Do Molecular Interactions Lead Ecological Innovation?
Cabezas‐Cruz, A., Estrada‐Peña, A., Rego, R. O. M., & de la Fuente, J. (2017) · Frontiers in Cellular and Infection Microbiology · doi:10.3389/fcimb.2017.00074 · Cited by 40
Lyme Neuroborreliosis: Mechanisms of B. burgdorferi Infection of the Nervous System
Ford, L. K., & Tufts, D. M. (2021) · Brain Sciences · doi:10.3390/brainsci11060789 · Cited by 40
Petzke, M. M., Volyanskyy, K. Y., Mao, Y., Arevalo, B., Zohn, R., Quituisaca, J., Wormser, G. P., Dimitrova, N., & Schwartz, I. S. (2020) · mBio · doi:10.1128/mbio.00047-20 · Cited by 39
Lyme disease and the pursuit of a clinical cure
Adkison, H., & Embers, M. E. (2023) · Frontiers in Medicine · doi:10.3389/fmed.2023.1183344 · Cited by 38
Borrelia burgdorferi hijacks cellular metabolism of immune cells: Consequences for host defense
Kerstholt, M., Netea, M. G., & Joosten, L. A. B. (2020) · Ticks and Tick-borne Diseases · doi:10.1016/j.ttbdis.2020.101386 · Cited by 37
Cabello, F. C., Embers, M. E., Newman, S. A., & Godfrey, H. P. (2022) · mBio · doi:10.1128/mbio.03440-21 · Cited by 36
Host Metabolic Response in Early Lyme Disease
Fitzgerald, B. L., Molins, C. R., Islam, M. N., Graham, B., Hove, P. R., Wormser, G. P., Hu, L. T., Ashton, L. V., & Belisle, J. T. (2019) · Journal of Proteome Research · doi:10.1021/acs.jproteome.9b00470 · Cited by 34
Temporal Dynamic Methods for Bulk RNA-Seq Time Series Data
Oh, S., & Li, R. W. (2021) · Genes · doi:10.3390/genes12030352 · Cited by 31
Fatigue Following Burn Injury: A Burn Model System National Database Study
Simko, L. C., Espinoza, L. F., McMullen, K. A., Herndon, D. N., Suman-Vejas, O. E., Fauerbach, J. A., Kowalske, K. J., WIECHMAN, S. A., Kazis, L. E., Ryan, C. M., et al. (2017) · Journal of Burn Care & Research · doi:10.1097/bcr.0000000000000625 · Cited by 31
The host response as a tool for infectious disease diagnosis and management
Lydon, E., Ko, E. R., & Tsalik, E. L. (2018) · Expert Review of Molecular Diagnostics · doi:10.1080/14737159.2018.1493378 · Cited by 29
Time for a Different Approach to Lyme Disease and Long-Term Symptoms
Melia, M. T., & Auwaerter, P. G. (2016) · New England Journal of Medicine · doi:10.1056/nejme1502350 · Cited by 29
Accuracy of Clinician Suspicion of Lyme Disease in the Emergency Department
Nigrovic, L. E., Bennett, J. E., Balamuth, F., Levas, M. N., Chenard, R. L., Maulden, A. B., Garro, A. C., & Net, F. P. L. (2017) · PEDIATRICS · doi:10.1542/peds.2017-1975 · Cited by 28
Metabolic Response in Patients With Post-treatment Lyme Disease Symptoms/Syndrome
Fitzgerald, B. L., Graham, B., Delorey, M. J., Pegalajar‐Jurado, A., Islam, M. N., Wormser, G. P., Aucott, J. N., Rebman, A. W., Soloski, M. J., Belisle, J. T., et al. (2020) · Clinical Infectious Diseases · doi:10.1093/cid/ciaa1455 · Cited by 28
Self-citationJain, K., Tagliafierro, T., Marques, A. R., Sánchez-Vicente, S., Gokden, A., Fallon, B. A., Mishra, N., Briese, T., Kapoor, V., Sameroff, S. C., et al. (2021) · Scientific Reports · doi:10.1038/s41598-021-91956-z · Cited by 27
Bouquet, J., Gardy, J. L., Brown, S., Pfeil, J., Miller, R. R., Morshed, M., Avina-Zubieta, A., Shojania, K., McCabe, M., Parker, S., et al. (2017) · Clinical Infectious Diseases · doi:10.1093/cid/ciw767 · Cited by 25
Self-citationMcClune, M. E., Ebohon, O., Dressler, J. M., Davis, M. M., Tupik, J. D., Lochhead, R. B., Booth, C. J., Steere, A. C., & Jutras, B. L. (2025) · Science Translational Medicine · doi:10.1126/scitranslmed.adr2955 · Cited by 25
A diagnostic classifier for gene expression-based identification of early Lyme disease
Servellita, V., Bouquet, J., Rebman, A. W., Yang, T., Samayoa, E., Miller, S. A., Stone, M., Lanteri, M. C., Busch, M. P., Tang, P., et al. (2022) · Communications Medicine · doi:10.1038/s43856-022-00127-2 · Cited by 25
Self-citationThe Potential of Omics Technologies in Lyme Disease Biomarker Discovery and Early Detection
Badawi, A. F. (2016) · Infectious Diseases and Therapy · doi:10.1007/s40121-016-0138-6 · Cited by 23
Tao, W., Radstake, T. R. D. J., & Pandit, A. (2022) · Communications Biology · doi:10.1038/s42003-021-02991-5 · Cited by 23
Radolf, J. D., Strle, K., Lemieux, J. E., & Strle, F. (2020) · Caister Academic Press eBooks · doi:10.21775/9781913652616.24 · Cited by 22
Host transcriptome response to Borrelia burgdorferi sensu lato
Thompson, D., Watt, J. A., & Brissette, C. A. (2020) · Ticks and Tick-borne Diseases · doi:10.1016/j.ttbdis.2020.101638 · Cited by 22
Clarke, D. J. B., Rebman, A. W., Bailey, A., Wojciechowicz, M. L., Jenkins, S. L., Evangelista, J. E., Danieletto, M., Fan, J., Eshoo, M. W., Mosel, M. R., et al. (2021) · Frontiers in Immunology · doi:10.3389/fimmu.2021.636289 · Cited by 19
Self-citationDiagnostic Performance of C6 Enzyme Immunoassay for Lyme Arthritis
Nigrovic, L. E., Bennett, J. E., Balamuth, F., Levas, M. N., Neville, D. N., Lyons, T. W., Branda, J. A., Maulden, A. B., Lewander, D. P., Garro, A. C., et al. (2019) · PEDIATRICS · doi:10.1542/peds.2019-0593 · Cited by 18
A systems biology approach to better understand human tick-borne diseases
Lee, W., Barbosa, A., Irwin, P., Currie, A. J., Kollmann, T. R., Beaman, M. H., Lee, A. H., & Oskam, C. L. (2022) · Trends in Parasitology · doi:10.1016/j.pt.2022.10.006 · Cited by 15
Gene set predictor for post-treatment Lyme disease
Clarke, D. J. B., Rebman, A. W., Fan, J., Soloski, M. J., Aucott, J. N., & Ma’ayan, A. (2022) · Cell Reports Medicine · doi:10.1016/j.xcrm.2022.100816 · Cited by 15
Self-citationBiswas, V. K., Sen, K., Ahad, A., Ghosh, A., Verma, S., Pati, R., Prusty, S., Nayak, S. P., Podder, S., Kumar, D., et al. (2023) · PLoS Biology · doi:10.1371/journal.pbio.3002231 · Cited by 15
Two-Tier Lyme Disease Serology Test Results Can Vary According to the Specific First-Tier Test Used
Maulden, A. B., Garro, A. C., Balamuth, F., Levas, M. N., Bennett, J. E., Neville, D. N., Branda, J. A., & Nigrovic, L. E. (2018) · Journal of the Pediatric Infectious Diseases Society · doi:10.1093/jpids/piy133 · Cited by 15
Insights From Omics in Lyme Disease
Bockenstedt, L. K., & Belperron, A. A. (2024) · The Journal of Infectious Diseases · doi:10.1093/infdis/jiae250 · Cited by 14
Bridging the gap: Insights in the immunopathology of Lyme borreliosis
Snik, M. E., Stouthamer, N. E. I. M., Hovius, J. W., & van Gool, M. M. J. (2024) · European Journal of Immunology · doi:10.1002/eji.202451063 · Cited by 14
Vrijmoeth, H. D., Ursinus, J., Botey-Bataller, J., Kuijpers, Y., Chu, X., van de Schoor, F. R., Scicluna, B. P., Xu, C., Netea, M. G., Kullberg, B. J., et al. (2024) · BMC Infectious Diseases · doi:10.1186/s12879-024-09217-z · Cited by 13
Munshi‐South, J., & Richardson, J. (2016) · Seminars in Cell and Developmental Biology · doi:10.1016/j.semcdb.2016.08.011 · Cited by 13
The role of scale in the estimation of cell-type proportions
Hunt, G. J., & Gagnon-Bartsch, J. A. (2021) · The Annals of Applied Statistics · doi:10.1214/20-aoas1395 · Cited by 13
Gupton, M., & Burns, J. D. (2023) · EFORT Open Reviews · doi:10.1530/eor-22-0136 · Cited by 12
Carreras‐González, A., Navasa, N., Martín‐Ruiz, I., Lavín, J. L., Azkargorta, M., Atondo, E., Barriales, D., Cámara, N. M., Pascual‐Itoiz, M. Á., Sampedro, L., et al. (2018) · Emerging Microbes & Infections · doi:10.1038/s41426-017-0018-5 · Cited by 12
Kirpach, J., Colone, A., Bürckert, J.-P., Faison, W. J., Dubois, A., Sinner, R., Reye, A., & Muller, C. P. (2019) · Frontiers in Immunology · doi:10.3389/fimmu.2019.01105 · Cited by 11
Zhong, X., Lundberg, M., & Råberg, L. (2020) · Ecology and Evolution · doi:10.1002/ece3.6377 · Cited by 11
Borrelia burgdorferi Is a Poor Inducer of Gamma Interferon: Amplification Induced by Interleukin-12
van de Schoor, F. R., Vrijmoeth, H. D., Brouwer, M. A. E., ter Hofstede, H. J. M., Lemmers, H., Dijkstra, H., Boahen, C. K., Oosting, M., Kullberg, B. J., Hovius, J. W., et al. (2022) · Infection and Immunity · doi:10.1128/iai.00558-21 · Cited by 11
Ding, Z., Ma, M., Tao, L., Peng, Y., Han, Y., Sun, L., Dai, X., Ji, Z., Bai, R., Jian, M., et al. (2019) · Frontiers in Neuroscience · doi:10.3389/fnins.2019.00651 · Cited by 10
RainDrop: Rapid activation matrix computation for droplet-based single-cell RNA-seq reads
Niebler, S., Müller, A., Hankeln, T., & Schmidt, B. (2020) · BMC Bioinformatics · doi:10.1186/s12859-020-03593-4 · Cited by 10
Raijmakers, R. P. H., Berven, L. L., Keijmel, S. P., Rodrigo, C., Wyller, V. B., Katz, B. Z., Buchwald, D., Evans, R. A., Gérardin, P., Knoop, H., et al. (2025) · EBioMedicine · doi:10.1016/j.ebiom.2025.105970 · Cited by 9
Okada, T., McIlfatrick, S., & John, J. C. S. (2023) · International Journal of Molecular Sciences · doi:10.3390/ijms24043783 · Cited by 9
Metagenomic Next-Generation Sequencing for Pathogen Detection and Identification
Miller, S. A., & Chiu, C. Y. (2018) · Springer eBooks · doi:10.1007/978-3-319-95111-9_25 · Cited by 8
Self-citationLi, J., Ma, Y., Paquette, J. K., Richards, A. C., Mulvey, M. A., Zachary, J. F., Teuscher, C., & Weis, J. J. (2022) · PLoS Pathogens · doi:10.1371/journal.ppat.1010365 · Cited by 8
Boada, P., Fatou, B., Belperron, A. A., Sigdel, T. K., Smolen, K. K., Wurie, Z., Levy, O., Ronca, S. E., Murray, K. O., Liberto, J. M., et al. (2022) · Frontiers in Immunology · doi:10.3389/fimmu.2022.1012824 · Cited by 8
Comella, P., Gonzalez‐Kozlova, E., Kosoy, R., Charney, A. W., Peradejordi, I. F., Chandrasekar, S., Tyler, S. R., Wang, W., Losic, B., Zhu, J., et al. (2021) · medRxiv · doi:10.1101/2021.01.29.21250755 · Cited by 8
Early Disseminated Lyme Disease with Carditis Complicated by Posttreatment Lyme Disease Syndrome
Novak, C. B., Harrison, A. G., & Aucott, J. N. (2017) · Case Reports in Infectious Diseases · doi:10.1155/2017/5847156 · Cited by 7
Self-citationSymptoms after Lyme disease: What’s past is prologue
Marques, A. R. (2024) · Science Translational Medicine · doi:10.1126/scitranslmed.ado2103 · Cited by 6
Innate and Th1/Th17 adaptive immunity in acute and convalescent Brazilian borreliosis disease
Bonoldi, V. L. N., Yoshinari, N. H., Abreu, P. A. E., & Pereira, R. M. R. (2021) · The Brazilian Journal of Infectious Diseases · doi:10.1016/j.bjid.2021.101575 · Cited by 6
Identifying platelet-derived factors as amplifiers ofB. burgdorferi-induced cytokine production
Kerstholt, M., van de Schoor, F. R., Oosting, M., Moorlag, S. J. C. F. M., Li, Y., Jaeger, M., van der Heijden, W. A., Tunjungputri, R. N., dos Santos, J. C., Kischkel, B., et al. (2022) · Clinical & Experimental Immunology · doi:10.1093/cei/uxac073 · Cited by 5
Chronic Fatigue Syndrome (CFS) or “Systemic Immune Disorder” (SID)?
Comhaire, F. H., & Devriendt, G. (2016) · Internal Medicine Open Access · doi:10.4172/2165-8048.1000225 · Cited by 5
Huang, W., Yin, C., Lento, P. A., Adem, P. V., Dimitrova, N., & Fallon, J. T. (2024) · Circulation Genomic and Precision Medicine · doi:10.1161/circgen.123.004487 · Cited by 4
Borrelia burgdorferi and other Borrelia species
Wang, G. (2024) · Elsevier eBooks · doi:10.1016/b978-0-12-818619-0.00072-1 · Cited by 4
Omic approaches to infectious disease testing
Mahle, R. E., & Tsalik, E. L. (2024) · Elsevier eBooks · doi:10.1016/b978-0-12-818619-0.00042-3 · Cited by 4
Preprocessing of Public RNA-Sequencing Datasets to Facilitate Downstream Analyses of Human Diseases
Rapier-Sharman, N., Krapohl, J., Beausoleil, E., Gifford, K., Hinatsu, B., Hoffmann, C. S., Komer, M., Scott, T. M., & Pickett, B. E. (2021) · Data · doi:10.3390/data6070075 · Cited by 4
Vigeland, M. D., Flåm, S. T., Vigeland, M. D., Espeland, A., Zucknick, M., Wigemyr, M., Bråten, L. C. H., Gjefsen, E., Zwart, J., Storheim, K., et al. (2023) · Antibiotics · doi:10.3390/antibiotics12071217 · Cited by 4
Brouwer, M. A. E., Karami, Z., Keating, S. T., Vrijmoeth, H. D., Lemmers, H., Dijkstra, H., van de Veerdonk, F. L., Lupșe, M. S., ter Hofstede, H. J. M., Netea, M. G., et al. (2025) · Ticks and Tick-borne Diseases · doi:10.1016/j.ttbdis.2025.102442 · Cited by 3
Kikuchi, K. (2016) · Journal of Bacteriology & Mycology Open Access · doi:10.15406/jbmoa.2016.03.00071 · Cited by 3
Challenges and new methods in the diagnosis of Lyme disease in children
Wozinska-Klepadlo, M., Toczyłowski, K., & Sulik, A. (2021) · Przeglad Epidemiologiczny · doi:10.32394/pe.74.56 · Cited by 3
Chronic Fatiguing Illnesses: Entering the era of new biomarkers and therapies
Shoemaker, R. C., Heyman, A., Mancia, A., & Ryan, J. (2017) · Internal Medicine Review · doi:10.18103/imr.v3i10.585 · Cited by 3
Kazakiewicz, D., Claesen, J., Górczak, K., Plewczyński, D., & Burzykowski, T. (2019) · Journal of Computational Biology · doi:10.1089/cmb.2019.0168 · Cited by 3
Epidémiologie vectorielle de la borréliose de Lyme en France
Goldstein, V. (2017) · theses.fr (ABES) · doi:10.70675/847ab435za0b2z4e68zbcaazdf3f17a11899 · Cited by 3
Cerar, T., Blagus, R., Ružić‐Sabljić, E., Collinet‐Adler, S., Bajrović, F. F., & Stupica, D. (2020) · Immunity Inflammation and Disease · doi:10.1002/iid3.398 · Cited by 2
Dooley, M. (2025) · International Journal of Molecular Sciences · doi:10.3390/ijms26157284 · Cited by 2
Pine, K., Pine, V., Negruţ, N., Ferician, A. C., & Marian, P. (2026) · Journal of Clinical Medicine · doi:10.3390/jcm15082922 · Cited by 2
Comprehensive analyses of transcriptomes induced by Lyme spirochete infection to CNS model system
Wen, S., Xu, X., Kong, J., Luo, L., Yue, P., Cao, W., Zhang, Y., Liu, M., Fan, Y., Chen, J., et al. (2022) · Infection Genetics and Evolution · doi:10.1016/j.meegid.2022.105349 · Cited by 2
The Practice of the Microbe Hunter
Maresso, A. W. (2019) · Springer eBooks · doi:10.1007/978-3-030-20464-8_3 · Cited by 2
Molecular Epidemiology of Rickettsial Diseases
Eremeeva, M. E. (2016) · Springer eBooks · doi:10.1007/978-3-319-46859-4_2 · Cited by 2
Górczak, K., Burzykowski, T., & Claesen, J. (2024) · Bioinformatics Advances · doi:10.1093/bioadv/vbaf126 · Cited by 1
Current practices in the diagnosis of Lyme disease
Walsh, M. E., & Brunelle, L. A. (2026) · Critical Reviews in Clinical Laboratory Sciences · doi:10.1080/10408363.2026.2663780 · Cited by 1
Loeb, M. B., Brison, R. J., Bramson, J. L., Hatchette, T. F., Sander, B., & Stringer, E. (2023) · BMJ Open · doi:10.1136/bmjopen-2023-076833 · Cited by 1
Meersschaert, C. (2016) · ORBi (University of Liège) · Cited by 1
Ritz, M., Brück, T., & München, T. U. (2023) · Cited by 1
The role of autophagy in host defence against Borrelia burgdorferi
Buffen, K. (2016) · Radboud Repository (Radboud University)
Bondarenko, A. L., & Sapozhnikova, V. V. (2017) · Journal Infectology · doi:10.22625/2072-6732-2017-9-3-14-24
Ilyinskikh, N. N., Ilyinskikh, E. N., & Ударцев, Е. Ю. (2018) · Advances in Gerontology · doi:10.1134/s2079057018030074
Studies on the pathogenesis and laboratory diagnosis of Lyme borreliosis
Pietikäinen, A. (2019) · UTUPub (University of Turku)
Proteomics on longitudinal serum samples differentiates localized and disseminated Lyme diseasePreprint
Fatou, B., Smolen, K. K., Belperron, A. A., Wurie, Z., Kleinstein, S. H., Montgomery, R. R., Levy, O., Bockenstedt, L. K., & Steen, H. (2020) · bioRxiv (Cold Spring Harbor Laboratory) · doi:10.1101/2020.11.18.387993
Petruk, A. M., Kamyshna, I. I., Шкільна, М. І., & Kamyshnyi, O. (2022) · Fìzìologìčnij žurnal · doi:10.15407/fz68.02.058
Momčilović, S., & Jovanović, A. (2022) · Trends in Cardiovascular Medicine · doi:10.1016/j.tcm.2022.06.007
Differential Analysis Reveals Isoform Switching Following Pneumococcal VaccinationPreprint
Kil, Y., & Pachter, L. S. (2025) · bioRxiv (Cold Spring Harbor Laboratory) · doi:10.1101/2025.03.09.642237
Marques, A. R. (2025) · CABI eBooks · doi:10.1079/9781800626225.0016
Diagnostic Testing for Lyme Disease
Judson, S. D. (2025) · CABI eBooks · doi:10.1079/9781800626225.0005
Metadata
- Authors
- Bouquet, J., Soloski, M. J., Swei, A., Cheadle, C., Federman, S., Billaud, J.-N., Rebman, A. W., Kabre, B., Halpert, R., Boorgula, M., Aucott, J. N., & Chiu, C. Y.
- Affiliations
- Department of Laboratory Medicine, University of California, San Francisco, San Francisco, California, USA
- Johns Hopkins University (US)
- San Francisco State University (US)
- University of California, San Francisco (US)
- Qiagen Bioinformatics, Redwood City, California, USA
- Qiagen (United States) (US)
- Corresponding author
- Aucott, John N.
- Chiu, Charles Y.
- Venue
- mBio
- Publisher
- American Society for Microbiology
- Published
- 2016-03-02
- Volume
- 7
- Issue
- 1
- Pages
- e00100-16
- ISSN
- 2150-7511 (ISSN-L)
- 2161-2129
- PMC
- PMC4791844
- OpenAlex
- W2265193578
- Cited by
- 101
- References
- 56
- Citations by year
- 2026: 5 · 2025: 9 · 2024: 9 · 2023: 7 · 2022: 13 · 2021: 14 · 2020: 12 · 2019: 12 · 2018: 7 · 2017: 6 · 2016: 7
- FWCI
- 10.98
- Type
- journal article
- Language
- en
- Open access
- gold
- doi.org
- Licence
- cc-by
- creativecommons.org/licenses/by/4.0/ (vor)
- journals.asm.org/non-commercial-tdm-license (tdm)
- Locations
- mBio (publishedVersion, cc-by)
- Europe PMC (PubMed Central) (publishedVersion, cc-by)
- PubMed Central (publishedVersion, cc-by)
- PubMed (publishedVersion)
- DOAJ (DOAJ: Directory of Open Access Journals) (submittedVersion)
- DOAJ (DOAJ: Directory of Open Access Journals) (submittedVersion, cc-by-sa)
- eScholarship (California Digital Library) (submittedVersion)
- Funders
- Swartz Foundation
- Bay Area Lyme Foundation
- Stabler Foundation
- Lyme Research Alliance
- Lyme Disease Research Foundation, Inc.
- Office of Extramural Research, National Institutes of Health (HL105704, P30-AR05350)
- Abbott Laboratories
- Topics
- Life Sciences › Immunology and Microbiology › Parasitology › Vector-borne infectious diseases
- Health Sciences › Medicine › Infectious Diseases › Brucella: diagnosis, epidemiology, treatment
- Health Sciences › Medicine › Clinical Neurology › Long-Term Effects of COVID-19
- Keywords
- Lyme disease, Borrelia burgdorferi, post-treatment Lyme disease syndrome, differential gene expression, host immune response, Toll-like receptor signaling, persistent symptoms, host biomarkers, T cell apoptosis, B cell development, tick-borne diseases
- MeSH terms
- Adult, Animals, Female, Humans, Lyme Disease, Male, Middle Aged, United States, Biomarkers, Gene Expression Profiling, Borrelia burgdorferi, Metabolic Networks and Pathways, High-Throughput Nucleotide Sequencing, Transcriptome
About these checks
Registry, retraction, Cites and statistics results are computed, not judged, with one exception: a printed reference that no index lists is read once by a model before it counts as a citation error. Claims are extracted by a model and kept only when their quote appears verbatim in the text; each cited source is then checked, with a model’s help, for whether it says what the claim relies on. Those verdicts can be wrong — read the claim’s quote and the cited source before relying on one.
Statistics and arithmetic are recomputed, not judged.
Confidence bands are shown only for fields calibrated on our annotated test set. None is calibrated yet, so no band is shown.
What counts as a claim ›How we measure confidence ›How we check this ›
Are you an author, or do you see a problem with this page? Request a review
Data sources
Bibliographic data: Semantic Scholar, OpenAlex, Crossref.
Contains information from the Semantic Scholar Academic Graph Datasets, made available under the ODC Attribution License (ODC-BY 1.0).
Semantic Scholar’s data is described in: Kinney, R., et al. (2023). The Semantic Scholar Open Data Platform. arXiv:2301.10140.
