Cited by 17Bacterial Genetics and BiotechnologyPhotosynthetic Processes and MechanismsAquatic Ecosystems and Phytoplankton Dynamics

The DOI matches its Crossref record; 38 of the 38 references it cites were found in a registry or an index.

Single-Cell Measurements of Fixation and Intercellular Exchange of C and N in the Filaments of the Heterocyst-Forming Cyanobacterium Anabaena sp. Strain PCC 7120

Open access

Abstract

sp. strain PCC 7120. Our results show a close relationship between C and N fixation and distribution in the filaments and indicate that wild-type filaments in a culture can exhibit a substantial variability of metabolic states. This illustrates how some novel properties can be appreciated by studying microbial cultures at the single-cell level.

Overview

The claims and statistics of this paper haven’t been checked yet.

Run the check — free, no account needed. It reads the open-access text and checks the sources it cites.

A few free checks a day · papers already verified open instantly · results are public

Integrity signals

Registry

Crossref · 10.1128/mbio.01314-21

Cites

38 of 38 references verified0 citation errors · 0 not checkable

Statistics

Figures

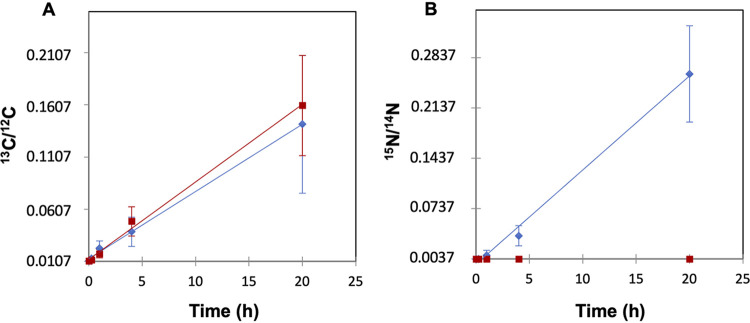
FIG 1 13C/12C ratios (A) and 15N/14N ratios (B) of cultures of Anabaena sp. strain PCC 7120 (WT) (blue diamonds) and strain CSVT22 (ΔfraC ΔfraD) (red squares). Samples were collected after 0, 15 min, 1 h, 4 h, and 20 h of incubation with 13C-labeled bicarbonate and 15N2. Previously, the cells had been induced for 48 h in the absence of combined N. The minimum values in the y axes correspond to the 13C/12C and 15N/14N ratio natural abundances, 0.0107 and 0.0037, respectively. The depicted data are the means ± standard deviations (SD) (error bars) of the LG-SIMS data collected from all cells analyzed for the different time points (WT, n = 259 to 427; CSVT22, n = 60 to 405) adjusted by linear regression.
FIG 1 13C/12C ratios (A) and 15N/14N ratios (B) of cultures of Anabaena sp. strain PCC 7120 (WT) (blue diamonds) and strain CSVT22 (ΔfraC ΔfraD) (red squares). Samples were collected after 0, 15 min, 1 h, 4 h, and 20 h of incubation with 13C-labeled bicarbonate and 15N2. Previously, the cells had been induced for 48 h in the absence of combined N. The minimum values in the y axes correspond to the 13C/12C and 15N/14N ratio natural abundances, 0.0107 and 0.0037, respectively. The depicted data are the means ± standard deviations (SD) (error bars) of the LG-SIMS data collected from all cells analyzed for the different time points (WT, n = 259 to 427; CSVT22, n = 60 to 405) adjusted by linear regression.CC BY · PubMed Central
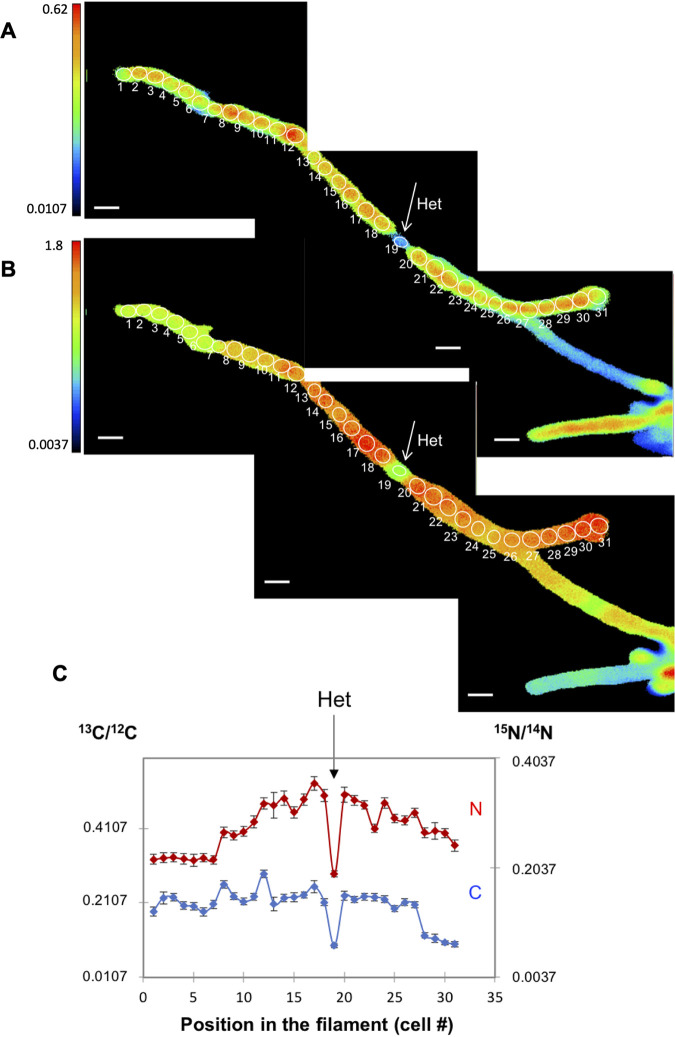
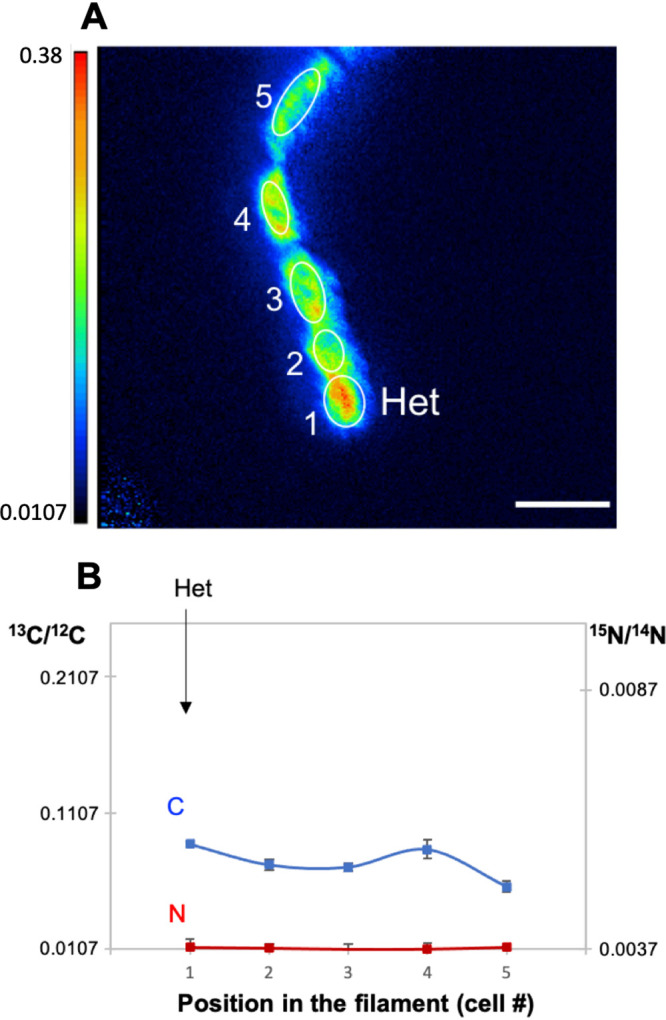
FIG 2 13C/12C and 15N/14N ratios in the cells along an individual filament of Anabaena WT after 20 h of incubation with the isotopically labeled substrates. The filament had been induced under combined N deprivation for 48 h before the addition of the isotopes. (A and B) The 13C/12C (A) and 15N/14N (B) ratio images collected from LG-SIMS imaging are shown. Color codes indicate 13C/12C (A) and 15N/14N (B) ratios, and the threshold is 13C or 15N natural abundance as indicated on the y axes. The numbers and white outlines denote the regions of interest (ROIs) used to calculate 13C/12C and 15N/14N ratios, which are shown in panel C. In all LG-SIMS analysis, data are presented as mean ± SD of 60 planes for each ROI. The location of one heterocyst (Het) is indicated. Bars, 5 μm.
FIG 2 13C/12C and 15N/14N ratios in the cells along an individual filament of Anabaena WT after 20 h of incubation with the isotopically labeled substrates. The filament had been induced under combined N deprivation for 48 h before the addition of the isotopes. (A and B) The 13C/12C (A) and 15N/14N (B) ratio images collected from LG-SIMS imaging are shown. Color codes indicate 13C/12C (A) and 15N/14N (B) ratios, and the threshold is 13C or 15N natural abundance as indicated on the y axes. The numbers and white outlines denote the regions of interest (ROIs) used to calculate 13C/12C and 15N/14N ratios, which are shown in panel C. In all LG-SIMS analysis, data are presented as mean ± SD of 60 planes for each ROI. The location of one heterocyst (Het) is indicated. Bars, 5 μm.CC BY · PubMed Central
FIG 3 13C/12C and 15N/14N ratios in the cells along an individual filament of strain CSVT22 (ΔfraC ΔfraD) after 20 h of incubation with the isotopically labeled substrates. The filament had been induced under combined N deprivation for 48 h before the addition of the isotopes. (A and B) The 13C/12C (A) and 15N/14N (B) ratio images collected from LG-SIMS imaging are shown. Color codes indicate 13C/12C (A) or 15N/14N (B) ratios. The numbers and white outlines denote the regions of interest (ROIs) used to calculate 13C/12C and 15N/14N ratios (mean ± SD of 60 planes), which are shown in panel C. Note that the 15N/14N ratios correspond to the natural abundances of the isotopes. The location of one heterocyst (Het) is indicated. Bars, 5 μm.
FIG 3 13C/12C and 15N/14N ratios in the cells along an individual filament of strain CSVT22 (ΔfraC ΔfraD) after 20 h of incubation with the isotopically labeled substrates. The filament had been induced under combined N deprivation for 48 h before the addition of the isotopes. (A and B) The 13C/12C (A) and 15N/14N (B) ratio images collected from LG-SIMS imaging are shown. Color codes indicate 13C/12C (A) or 15N/14N (B) ratios. The numbers and white outlines denote the regions of interest (ROIs) used to calculate 13C/12C and 15N/14N ratios (mean ± SD of 60 planes), which are shown in panel C. Note that the 15N/14N ratios correspond to the natural abundances of the isotopes. The location of one heterocyst (Het) is indicated. Bars, 5 μm.CC BY · PubMed Central
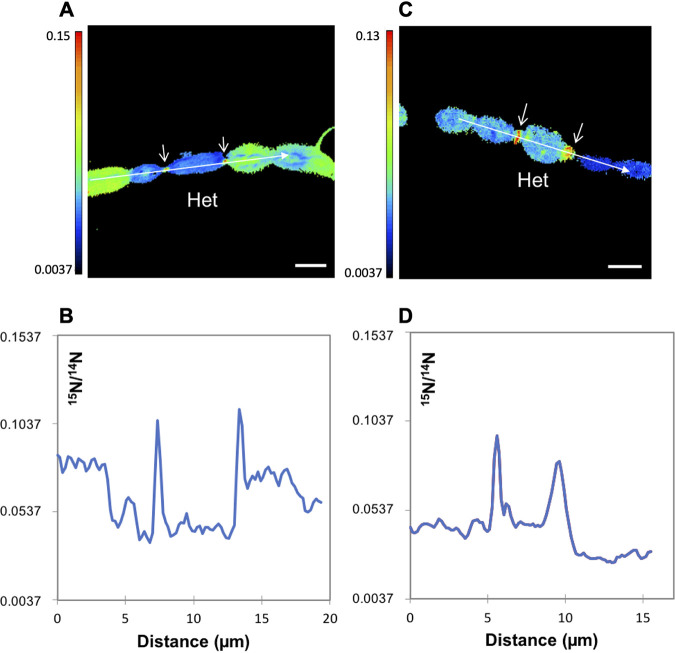
FIG 4 Two examples of 15N/14N ratio in Anabaena WT filaments collected by NanoSIMS imaging after 4 h of incubation with the isotopically labeled substrates. (A and C) 15N/14N ratio images from Anabaena filaments showing high 15N enrichment at the heterocyst necks (arrows). Color codes indicate 15N/14N ratios. (B and D) 15N/14N ratio along the lines indicated as longitudinal arrows in the images in panels A and C, respectively (data are the means from 33 and 3 planes, respectively). Het, heterocyst. Bars, 3 μm. 13C/12C ratios were in the range shown in Fig. 6C (4 h).
FIG 4 Two examples of 15N/14N ratio in Anabaena WT filaments collected by NanoSIMS imaging after 4 h of incubation with the isotopically labeled substrates. (A and C) 15N/14N ratio images from Anabaena filaments showing high 15N enrichment at the heterocyst necks (arrows). Color codes indicate 15N/14N ratios. (B and D) 15N/14N ratio along the lines indicated as longitudinal arrows in the images in panels A and C, respectively (data are the means from 33 and 3 planes, respectively). Het, heterocyst. Bars, 3 μm. 13C/12C ratios were in the range shown in Fig. 6C (4 h).CC BY · PubMed Central
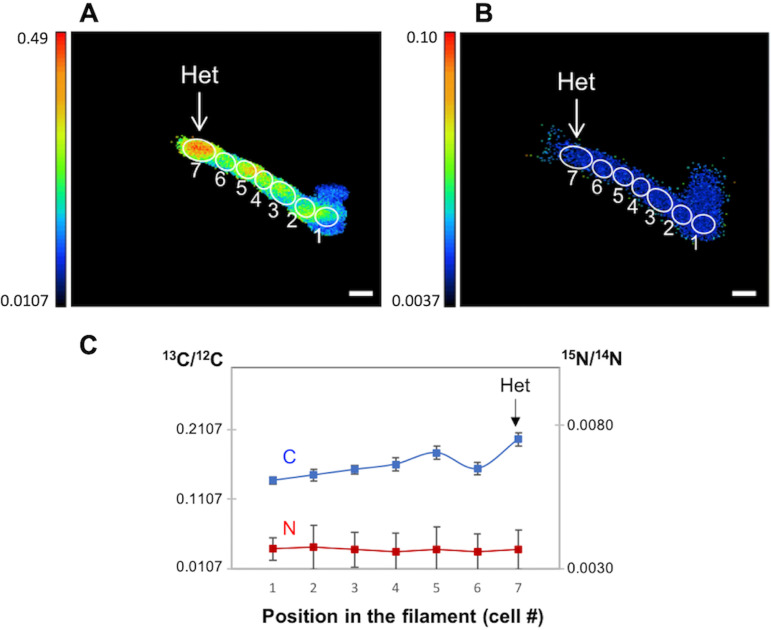
FIG 5 13C/12C and 15N/14N ratios in the cells along a filament of Anabaena mutant CSVT22 (ΔfraC ΔfraD) after 4 h of incubation with the isotopically labeled substrates. The 13C/12C ratio image collected from NanoSIMS imaging is shown in panel A. Color code indicates 13C/12C ratio. The numbers in the image denote regions of interest (ROIs) used to calculate 13C/12C and 15N/14N ratios (mean ± SD of four planes), which are shown in panel B. Het, heterocyst. Bar, 3 μm.
FIG 5 13C/12C and 15N/14N ratios in the cells along a filament of Anabaena mutant CSVT22 (ΔfraC ΔfraD) after 4 h of incubation with the isotopically labeled substrates. The 13C/12C ratio image collected from NanoSIMS imaging is shown in panel A. Color code indicates 13C/12C ratio. The numbers in the image denote regions of interest (ROIs) used to calculate 13C/12C and 15N/14N ratios (mean ± SD of four planes), which are shown in panel B. Het, heterocyst. Bar, 3 μm.CC BY · PubMed Central
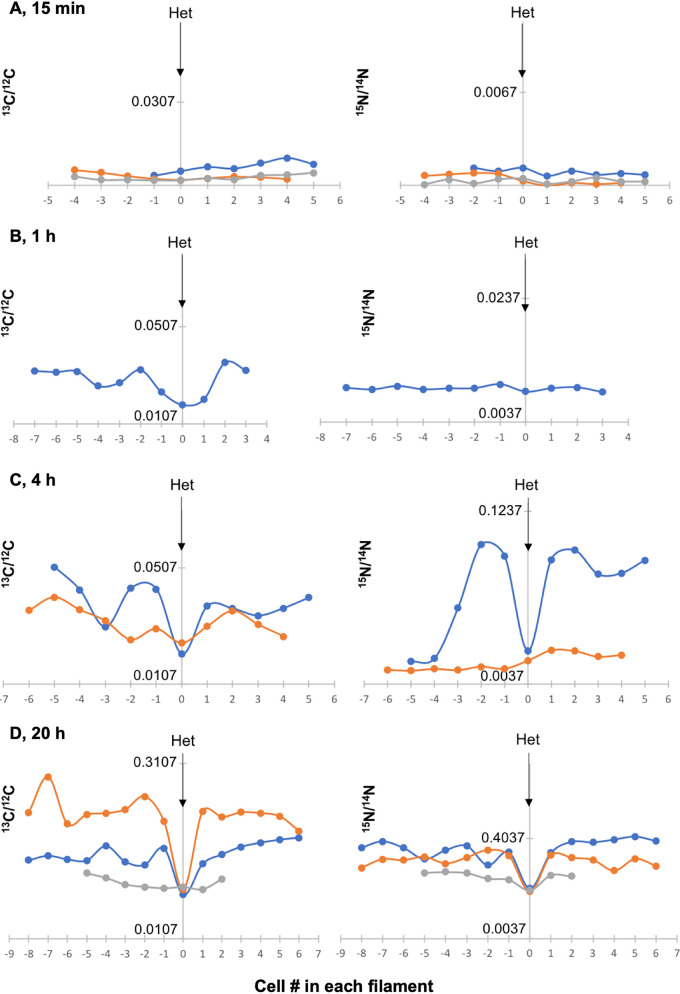
FIG 6 13C/12C and 15N/14N ratios in filaments of Anabaena WT collected by LG-SIMS after 15 min, 1 h, 4 h, and 20 h of incubation with the isotopes (one to three filaments for each time point). Heterocysts (Het) are indicated by arrows. Panel D includes in orange color the filament shown in Fig. 2. The x axis shows the numbering of the cells in the filaments taking the heterocyst as reference. The y axis shows the 13C/12C or 15N/14N ratio (note the different scales at the different time points).
FIG 6 13C/12C and 15N/14N ratios in filaments of Anabaena WT collected by LG-SIMS after 15 min, 1 h, 4 h, and 20 h of incubation with the isotopes (one to three filaments for each time point). Heterocysts (Het) are indicated by arrows. Panel D includes in orange color the filament shown in Fig. 2. The x axis shows the numbering of the cells in the filaments taking the heterocyst as reference. The y axis shows the 13C/12C or 15N/14N ratio (note the different scales at the different time points).CC BY · PubMed Central
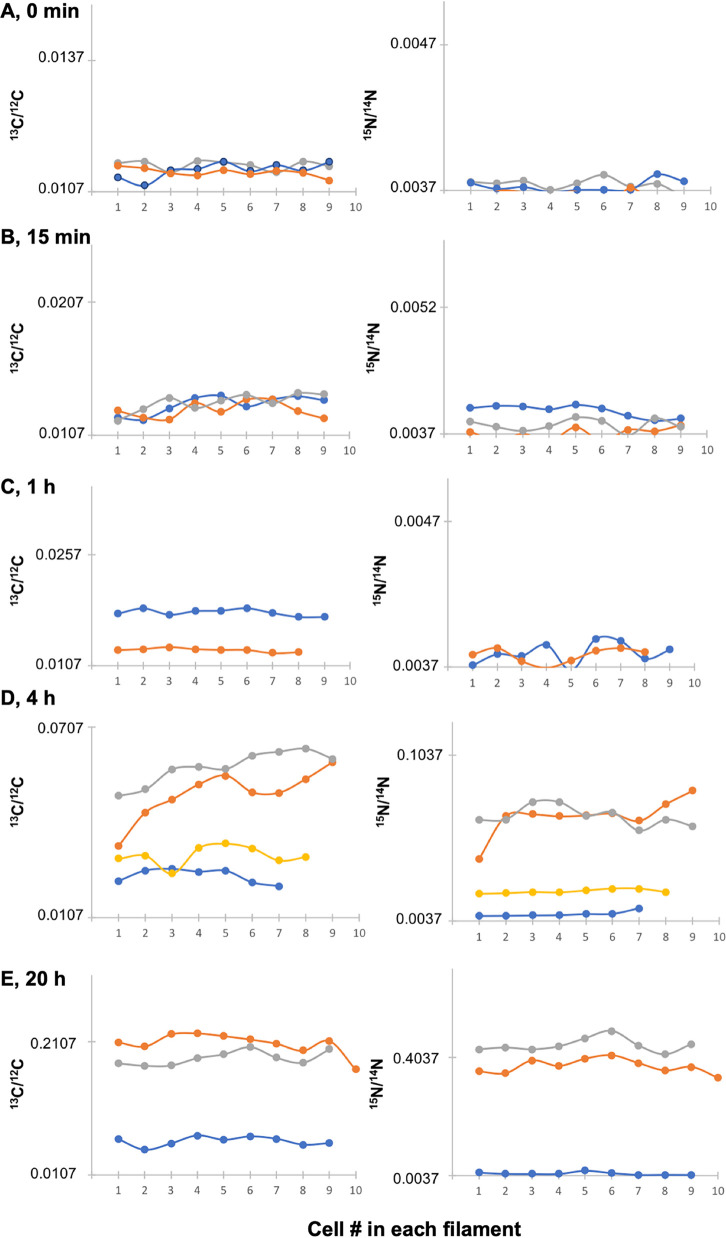
FIG 7 13C/12C and 15N/14N ratios in terminal stretches of filaments containing only vegetative cells of Anabaena WT collected by LG-SIMS at time zero and after 15 min, 1 h, 4 h, and 20 h of incubation with the isotopes (two to four filaments for each time point). Note the different scales for isotope ratios at the different time points. 13C/12C and 15N/14N ratios at 15 min were significantly different than at time zero (Student’s t test P < 0.001 for both isotopes).
FIG 7 13C/12C and 15N/14N ratios in terminal stretches of filaments containing only vegetative cells of Anabaena WT collected by LG-SIMS at time zero and after 15 min, 1 h, 4 h, and 20 h of incubation with the isotopes (two to four filaments for each time point). Note the different scales for isotope ratios at the different time points. 13C/12C and 15N/14N ratios at 15 min were significantly different than at time zero (Student’s t test P < 0.001 for both isotopes).CC BY · PubMed Central
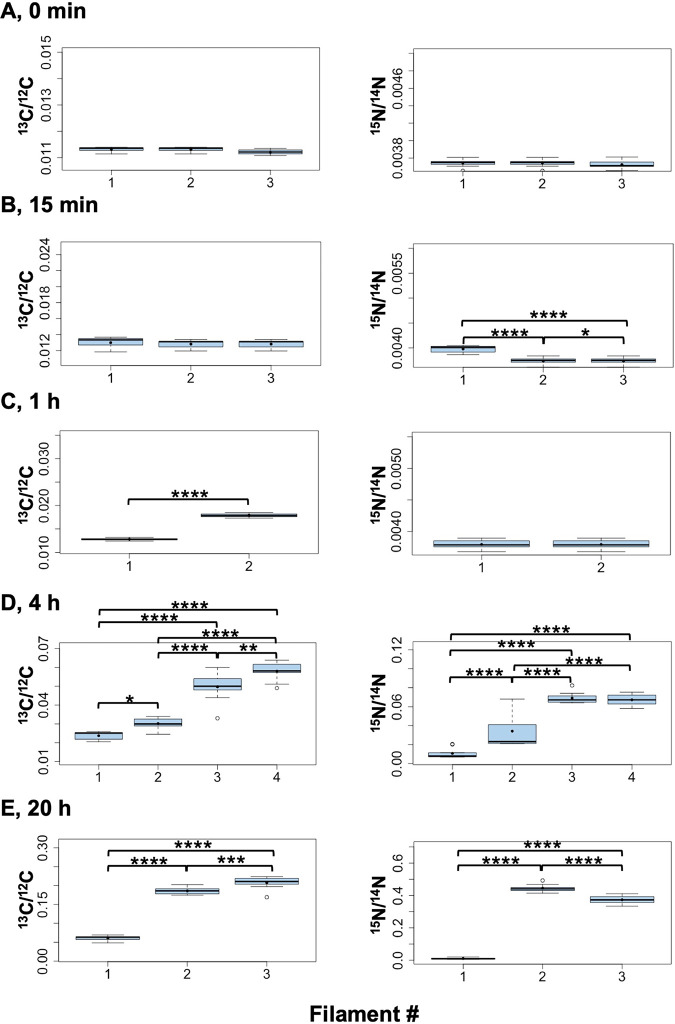
FIG 8 Box plot representation of the LG-SIMS data from Fig. 7. For each filament, data from all the cells were combined and presented in a box plot. Mean values are represented by black dots. On the y axes, the minimum values were the 13C and 15N natural abundances, 0.0107 and 0.0037, respectively. To assess the differences between filaments at each incubation time, the data were compared using the ANOVA test with Bonferroni correction (Bonferroni post hoc test). Statistical significance is indicated by asterisks as follows: *, 0.05 > P > 0.01; **, 0.01 > P > 0.001; ***, 0.001 > P > 0.0001; ****, P < 0.0001.
FIG 8 Box plot representation of the LG-SIMS data from Fig. 7. For each filament, data from all the cells were combined and presented in a box plot. Mean values are represented by black dots. On the y axes, the minimum values were the 13C and 15N natural abundances, 0.0107 and 0.0037, respectively. To assess the differences between filaments at each incubation time, the data were compared using the ANOVA test with Bonferroni correction (Bonferroni post hoc test). Statistical significance is indicated by asterisks as follows: *, 0.05 > P > 0.01; **, 0.01 > P > 0.001; ***, 0.001 > P > 0.0001; ****, P < 0.0001.CC BY · PubMed Central
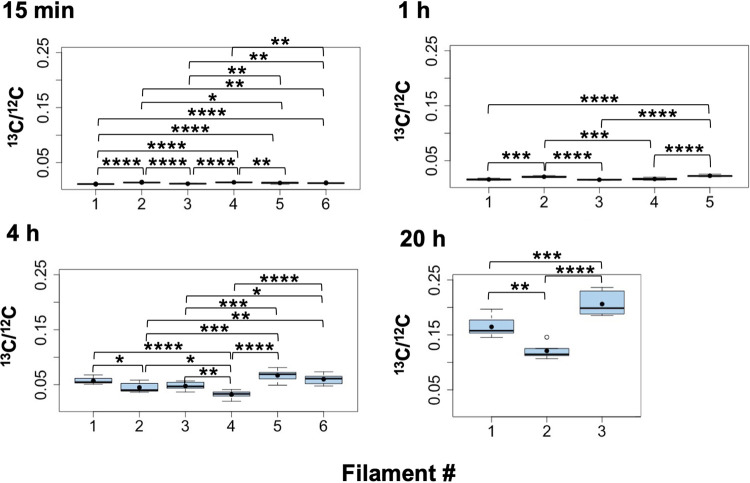
FIG 9 13C/12C ratios along individual filaments of Anabaena strain CSVT22 (ΔfraC ΔfraD) after 15 min, 1 h, 4 h, and 20 h of incubation with the isotopes. The filaments had been induced under combined N deprivation for 48 h. LG-SIMS data (13C/12C ratios, mean of 60 planes) collected from four to seven consecutive vegetative cells and one terminal heterocyst in each filament are depicted as box plots. The numbers of filaments analyzed were 6 at 15 min and 4 h, 5 at 1 h, and 3 at 20 h. The graph for the 20-h time point includes the filament shown in Fig. 3. On the y axes, the minimum values were the 13C natural abundance, 0.0107. Mean values are represented by black dots. To assess the differences between filaments at each incubation time, the data were compared using the ANOVA test with Bonferroni correction (Bonferroni post hoc test). Statistical significance: *, 0.05 > P > 0.01; **, 0.01 > P > 0.001; ***, 0.001 > P > 0.0001; ****, P < 0.0001.
FIG 9 13C/12C ratios along individual filaments of Anabaena strain CSVT22 (ΔfraC ΔfraD) after 15 min, 1 h, 4 h, and 20 h of incubation with the isotopes. The filaments had been induced under combined N deprivation for 48 h. LG-SIMS data (13C/12C ratios, mean of 60 planes) collected from four to seven consecutive vegetative cells and one terminal heterocyst in each filament are depicted as box plots. The numbers of filaments analyzed were 6 at 15 min and 4 h, 5 at 1 h, and 3 at 20 h. The graph for the 20-h time point includes the filament shown in Fig. 3. On the y axes, the minimum values were the 13C natural abundance, 0.0107. Mean values are represented by black dots. To assess the differences between filaments at each incubation time, the data were compared using the ANOVA test with Bonferroni correction (Bonferroni post hoc test). Statistical significance: *, 0.05 > P > 0.01; **, 0.01 > P > 0.001; ***, 0.001 > P > 0.0001; ****, P < 0.0001.CC BY · PubMed Central
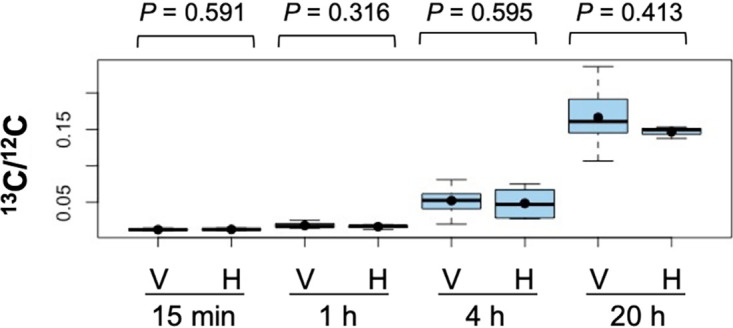
FIG 10 13C/12C ratios in vegetative cells and heterocysts of filaments of Anabaena strain CSVT22 (ΔfraC ΔfraD) after 15 min, 1 h, 4 h, and 20 h of incubation. LG-SIMS data (13C/12C ratios, mean of 60 planes) collected from 17 to 35 vegetative cells (V) and 3 to 6 heterocysts (H) for each time point are depicted as box plots. On the y axis, the minimum value was the 13C natural abundance, 0.0107. Student’s t test was performed to indicate the P values. Mean values are represented by black dots.
FIG 10 13C/12C ratios in vegetative cells and heterocysts of filaments of Anabaena strain CSVT22 (ΔfraC ΔfraD) after 15 min, 1 h, 4 h, and 20 h of incubation. LG-SIMS data (13C/12C ratios, mean of 60 planes) collected from 17 to 35 vegetative cells (V) and 3 to 6 heterocysts (H) for each time point are depicted as box plots. On the y axis, the minimum value was the 13C natural abundance, 0.0107. Student’s t test was performed to indicate the P values. Mean values are represented by black dots.CC BY · PubMed Central
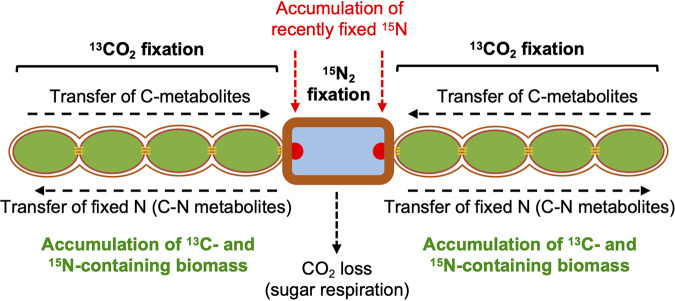
FIG 11 Scheme of carbon and nitrogen fixation and distribution in the diazotrophic filament of wild-type Anabaena (a filament consisting of a central heterocyst [note the thick envelope] and four vegetative cells at each side is depicted). As shown by incorporation of 13C and 15N from [13C]bicarbonate and 15N2, respectively, 13C- and 15N-labeled biomass accumulates mainly in the vegetative cells (see Fig. 2), although recently fixed N also accumulates at the cyanophycin granules (indicated as red semicircles) in the heterocyst poles (see Fig. 4). However, in the Anabaena ΔfraC ΔfraD mutant, which does not fix N2, 13C-labeled biomass also accumulates in the heterocysts (see Fig. 5). Therefore, in the wild type, 13C-labeled metabolites received from the vegetative cells that do not accumulate in the heterocysts are instead used (i) in respiration (releasing CO2) to fuel N2 fixation and (ii) for the incorporation of fixed N and transferred back to the vegetative cells as amino acids. The filament structure shown highlights the presence of septal junctions (thin horizontal orange lines) and of a continuous periplasmic space.
FIG 11 Scheme of carbon and nitrogen fixation and distribution in the diazotrophic filament of wild-type Anabaena (a filament consisting of a central heterocyst [note the thick envelope] and four vegetative cells at each side is depicted). As shown by incorporation of 13C and 15N from [13C]bicarbonate and 15N2, respectively, 13C- and 15N-labeled biomass accumulates mainly in the vegetative cells (see Fig. 2), although recently fixed N also accumulates at the cyanophycin granules (indicated as red semicircles) in the heterocyst poles (see Fig. 4). However, in the Anabaena ΔfraC ΔfraD mutant, which does not fix N2, 13C-labeled biomass also accumulates in the heterocysts (see Fig. 5). Therefore, in the wild type, 13C-labeled metabolites received from the vegetative cells that do not accumulate in the heterocysts are instead used (i) in respiration (releasing CO2) to fuel N2 fixation and (ii) for the incorporation of fixed N and transferred back to the vegetative cells as amino acids. The filament structure shown highlights the presence of septal junctions (thin horizontal orange lines) and of a continuous periplasmic space.CC BY · PubMed Central

Verification

Claims the paper makes

The claims and statistics of this paper haven’t been checked yet.

Run the check — free, no account needed. It reads the open-access text and checks the sources it cites.

A few free checks a day · papers already verified open instantly · results are public

Claims other papers make about this one

Each is checked against this paper’s own text: does it say what the citing paper says it does?

Self-check

Percentages, sums and reported differences re-computed from the paper’s own numbers.

The self-check needs the paper’s full text.

Citations

Cites

Show all 38 references

Cited by

Sorted by citations

See all 17

Metadata

Authors
Nieves-Morión, M., Flores, E., Whitehouse, M. J., Thomen, A., & Foster, R. A.
Affiliations
  • Department of Ecology, Environment and Plant Sciences, Stockholm University, Stockholm, Sweden
  • Consejo Superior de Investigaciones Científicas (ES)
  • Swedish Museum of Natural History (SE)
  • University of Gothenburg (SE)
  • Stockholm University (SE)
Corresponding author
Flores, Enrique
Venue
mBio
Published
2021-08-31
Volume
12
Issue
4
Pages
e0131421-e0131421
ISSN
2150-7511 (ISSN-L)
OpenAlex
W3194806013
Cited by
17
References
38
Citations by year
2026: 7 · 2025: 4 · 2024: 2 · 2023: 2 · 2022: 2
FWCI
0.85
Type
journal article
Language
en
Open access
Locations
  • mBio (publishedVersion, cc-by)
  • PubMed Central (publishedVersion, cc-by)
  • PubMed (publishedVersion)
  • DIGITAL.CSIC (Spanish National Research Council (CSIC)) (submittedVersion, cc-by)
  • DOAJ (DOAJ: Directory of Open Access Journals) (submittedVersion, cc-by-sa)
Funders
  • Knut och Alice Wallenbergs Stiftelse
  • Plan Estatal de Investigación Científica y Técnica y de Innovación (BFU2017-88202-P)
  • EC | European Regional Development Fund (BFU2017-88202-P)
  • The Swedish Research Council Infrastructure grant (2017-00671)
  • The Swedish Research Council (2018-04161)
Topics
  • Life Sciences › Biochemistry, Genetics and Molecular Biology › Genetics › Bacterial Genetics and Biotechnology
  • Life Sciences › Biochemistry, Genetics and Molecular Biology › Molecular Biology › Photosynthetic Processes and Mechanisms
  • Physical Sciences › Environmental Science › Environmental Chemistry › Aquatic Ecosystems and Phytoplankton Dynamics
Keywords
Anabaena sp. PCC 7120, heterocysts, cyanobacteria, CO2 fixation, nitrogen fixation, single-cell measurement
MeSH terms
Carbon, Diffusion, Nitrogen, Nitrogen Fixation, Gene Expression Regulation, Bacterial, Anabaena, Single-Cell Analysis

About these checks

Registry, retraction, Cites and statistics results are computed, not judged, with one exception: a printed reference that no index lists is read once by a model before it counts as a citation error. Claims are extracted by a model and kept only when their quote appears verbatim in the text; each cited source is then checked, with a model’s help, for whether it says what the claim relies on. Those verdicts can be wrong — read the claim’s quote and the cited source before relying on one.

Statistics and arithmetic are recomputed, not judged.

Confidence bands are shown only for fields calibrated on our annotated test set. None is calibrated yet, so no band is shown.

What counts as a claim ›How we measure confidence ›How we check this ›

Are you an author, or do you see a problem with this page? Request a review