

The DOI matches its Crossref record; 53 of the 53 references it cites were found in a registry or an index.
Diagnostic Potential and Interactive Dynamics of the Colorectal Cancer Virome
Open accessPublished version of a preprint
Abstract
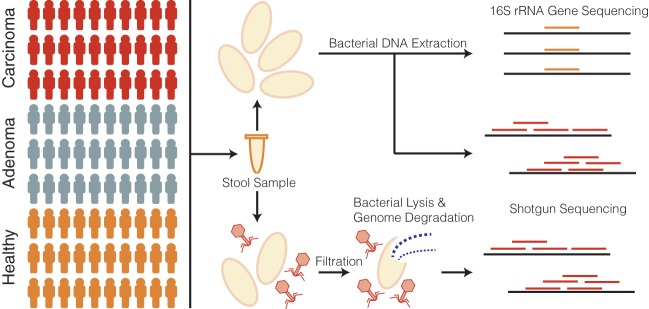
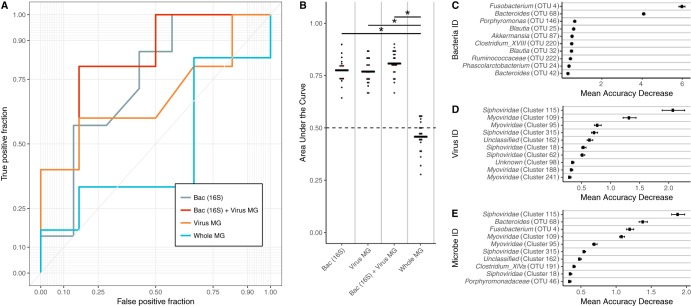
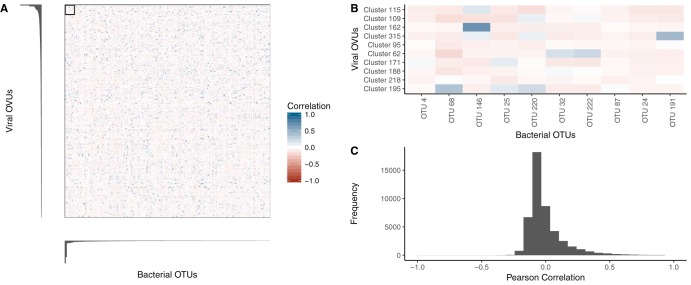
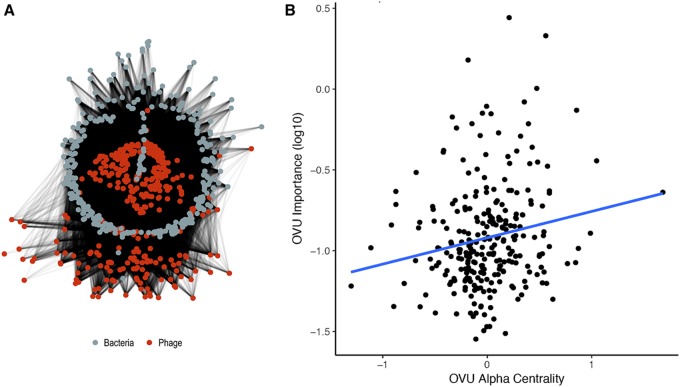
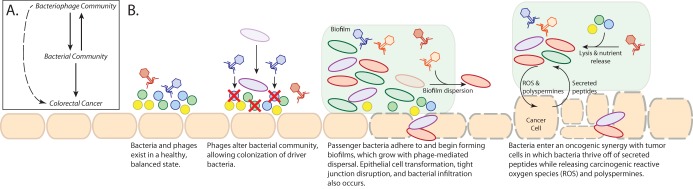
Colorectal cancer is a leading cause of cancer-related death in the United States and worldwide. Its risk and severity have been linked to colonic bacterial community composition. Although human-specific viruses have been linked to other cancers and diseases, little is known about colorectal cancer virus communities. We addressed this knowledge gap by identifying differences in colonic virus communities in the stool of colorectal cancer patients and how they compared to bacterial community differences. The results suggested an indirect role for the virome in impacting colorectal cancer by modulating the associated bacterial community. These findings both support the idea of a biological role for viruses in colorectal cancer and provide a new understanding of basic colorectal cancer etiology.
Overview
The claims and statistics of this paper haven’t been checked yet.
Run the check — free, no account needed. It reads the open-access text and checks the sources it cites.
Integrity signals
Registry
Cites
Statistics
Figures
Verification
Claims the paper makes
The claims and statistics of this paper haven’t been checked yet.
Run the check — free, no account needed. It reads the open-access text and checks the sources it cites.
Claims other papers make about this one
Each is checked against this paper’s own text: does it say what the citing paper says it does?
The source backs part of the claim, not all of it — or backs it for a different population, condition or comparison.
In the citing paper
“The enteric virome and mycobiome (fungal microbiome) have also been linked with CRC.72–74”
From Influence of the Gut Microbiome, Diet, and Environment on Risk of Colorectal Cancer (2020) · cites this paper as [74]
Experimental — accuracy not yet measuredIn the citing paper
“These findings indicate an interaction between the virome and bacteriome in risk of CRC.72, 74”
From Influence of the Gut Microbiome, Diet, and Environment on Risk of Colorectal Cancer (2020) · cites this paper as [74]
Self-check
Percentages, sums and reported differences re-computed from the paper’s own numbers.
The self-check needs the paper’s full text.
Citations
Cites
Fast gapped-read alignment with Bowtie 2
Langmead, B., & Salzberg, S. L. (2012) · Nature Methods · doi:10.1038/nmeth.1923 · Cited by 56,400
Cutadapt removes adapter sequences from high-throughput sequencing reads
Martin, M. (2011) · EMBnet.journal · doi:10.14806/ej.17.1.200 · Cited by 33,889
vegan: Community Ecology Package
Oksanen, J., Simpson, G. L., Blanchet, F. G., Kindt, R., Legendre, P., Minchin, P. R., O’Hara, R. B., Sólymos, P., Stevens, M. H. H., Szöcs, E., et al. (2001) · doi:10.32614/cran.package.vegan · Cited by 27,099
BLAST+: architecture and applications
Camacho, C., Coulouris, G., Avagyan, V., Ma, N., Papadopoulos, J., Bealer, K., & Madden, T. L. (2009) · BMC Bioinformatics · doi:10.1186/1471-2105-10-421 · Cited by 22,074
Schloss, P. D., Westcott, S. L., Ryabin, T., Hall, J. R., Hartmann, M., Hollister, E. B., Lesniewski, R. A., Oakley, B. B., Parks, D. H., Robinson, C. J., et al. (2009) · Applied and Environmental Microbiology · doi:10.1128/aem.01541-09 · Cited by 19,549
UCHIME improves sensitivity and speed of chimera detection
Edgar, R. C., Haas, B. J., Clemente, J. C., Quince, C., & Knight, R. (2011) · Bioinformatics · doi:10.1093/bioinformatics/btr381 · Cited by 15,114
Kozich, J. J., Westcott, S. L., Baxter, N. T., Highlander, S. K., & Schloss, P. D. (2013) · Applied and Environmental Microbiology · doi:10.1128/aem.01043-13 · Cited by 7,246
Pruesse, E., Quast, C., Knittel, K., Fuchs, B. M., Ludwig, W., Peplies, J., & Glöckner, F. O. (2007) · Nucleic Acids Research · doi:10.1093/nar/gkm864 · Cited by 6,682
Identification of Herpesvirus-Like DNA Sequences in AIDS-Sssociated Kaposi's Sarcoma
Chang, Y., Cesarman, E., Pessin, M. S., Lee, F., Culpepper, J., Knowles, D. M., & Moore, P. S. (1994) · Science · doi:10.1126/science.7997879 · Cited by 5,608
Clonal Integration of a Polyomavirus in Human Merkel Cell Carcinoma
Feng, H., Shuda, M., Chang, Y., & Moore, P. S. (2008) · Science · doi:10.1126/science.1152586 · Cited by 3,208
Cited by
Sorted by citations
Wirbel, J., Pyl, P. T., Kartal, E., Zych, K., Kashani, A., Milanese, A., Fleck, J. S., Voigt, A. Y., Palleja, A., Ponnudurai, R., et al. (2019) · Nature Medicine · doi:10.1038/s41591-019-0406-6 · Cited by 1,373
Gut microbiota in colorectal cancer: mechanisms of action and clinical applications
Wong, S. H., & Yu, J. (2019) · Nature Reviews Gastroenterology & Hepatology · doi:10.1038/s41575-019-0209-8 · Cited by 1,392
Thomas, A. M., Manghi, P., Asnicar, F., Pasolli, E., Armanini, F., Zolfo, M., Beghini, F., Manara, S., Karcher, N., Pozzi, C., et al. (2019) · Nature Medicine · doi:10.1038/s41591-019-0405-7 · Cited by 1,030
Influence of the Gut Microbiome, Diet, and Environment on Risk of Colorectal Cancer
Song, M., Chan, A. T., & Sun, J. (2020) · Gastroenterology · doi:10.1053/j.gastro.2019.06.048 · Cited by 752
Gut microbiota in colorectal cancer development and therapy
Wong, C. C., & Yu, J. (2023) · Nature Reviews Clinical Oncology · doi:10.1038/s41571-023-00766-x · Cited by 779
Metadata
- Authors
- Hannigan, G. D., Duhaime, M. B., Ruffin, M. T., Koumpouras, C. C., & Schloss, P. D.
- Affiliations
- University of Michigan (US)
- Pennsylvania State University (US)
- Corresponding author
- Schloss, Patrick D.
- Venue
- mBio
- Publisher
- American Society for Microbiology
- Published
- 2018-12-21
- Volume
- 9
- Issue
- 6
- ISSN
- 2150-7511 (ISSN-L)
- 2161-2129
- PMC
- PMC6247079
- OpenAlex
- W2950868848
- Cited by
- 298
- References
- 53
- Citations by year
- 2026: 32 · 2025: 40 · 2024: 34 · 2023: 45 · 2022: 48 · 2021: 52 · 2020: 18 · 2019: 25 · 2018: 1
- FWCI
- 18.05
- Type
- journal article
- Language
- en
- Open access
- gold
- doi.org
- Licence
- Locations
- mBio (publishedVersion, cc-by)
- Europe PMC (PubMed Central) (publishedVersion, cc-by)
- PubMed Central (publishedVersion, cc-by)
- PubMed (publishedVersion)
- DOAJ (DOAJ: Directory of Open Access Journals) (submittedVersion, cc-by-sa)
- DOAJ (DOAJ: Directory of Open Access Journals) (submittedVersion)
- Funders
- HHS | National Institutes of Health (P30DK034933, T32AI007528, 5U01CA86400)
- Topics
- Life Sciences › Immunology and Microbiology › Virology › Bacteriophages and microbial interactions
- Life Sciences › Biochemistry, Genetics and Molecular Biology › Molecular Biology › Gut microbiota and health
- Health Sciences › Medicine › Oncology › Viral-associated cancers and disorders
- Keywords
- colorectal cancer, virome, human viruses, colonic microbiota, gut bacterial community, cancer etiology, viral-bacterial interactions, cancer diagnosis
- MeSH terms
- Bacteria, Bacteriophages, Feces, Humans, RNA, Ribosomal, 16S, Viruses, Colorectal Neoplasms, Cohort Studies, Metagenomics, Microbiota
About these checks
Registry, retraction, Cites and statistics results are computed, not judged, with one exception: a printed reference that no index lists is read once by a model before it counts as a citation error. Claims are extracted by a model and kept only when their quote appears verbatim in the text; each cited source is then checked, with a model’s help, for whether it says what the claim relies on. Those verdicts can be wrong — read the claim’s quote and the cited source before relying on one.
Statistics and arithmetic are recomputed, not judged.
Confidence bands are shown only for fields calibrated on our annotated test set. None is calibrated yet, so no band is shown.
What counts as a claim ›How we measure confidence ›How we check this ›
Are you an author, or do you see a problem with this page? Request a review
