

The DOI matches its Crossref record; 73 of the 73 references it cites were found in a registry or an index.
Flagellar Synchronization Is a Simple Alternative to Cell Cycle Synchronization for Ciliary and Flagellar Studies
Open accessPublished version of a preprint
Abstract
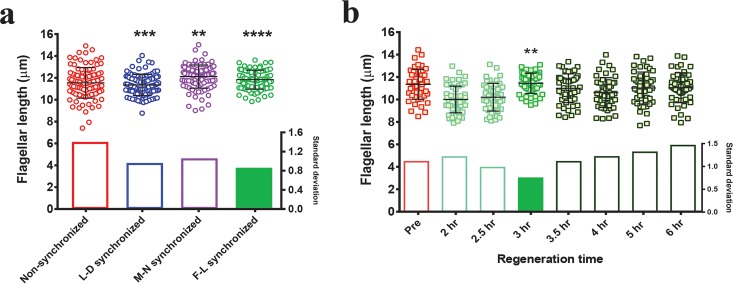
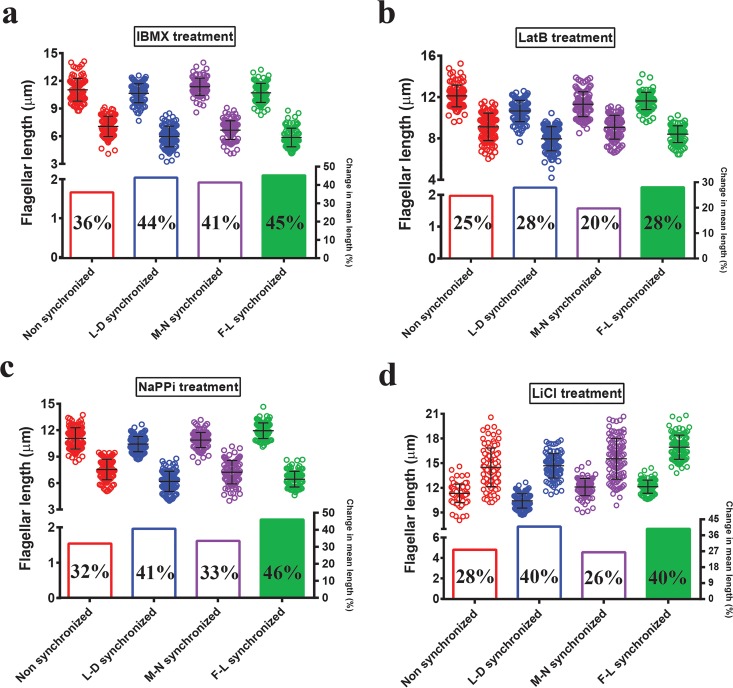
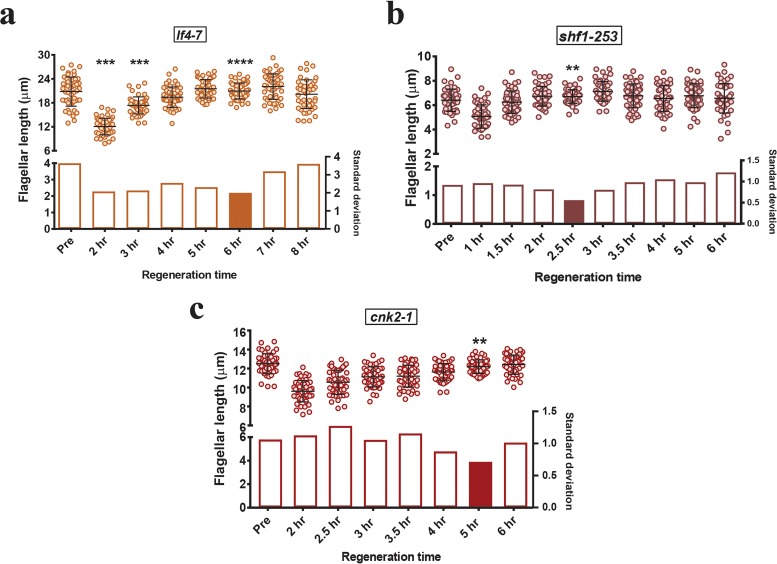
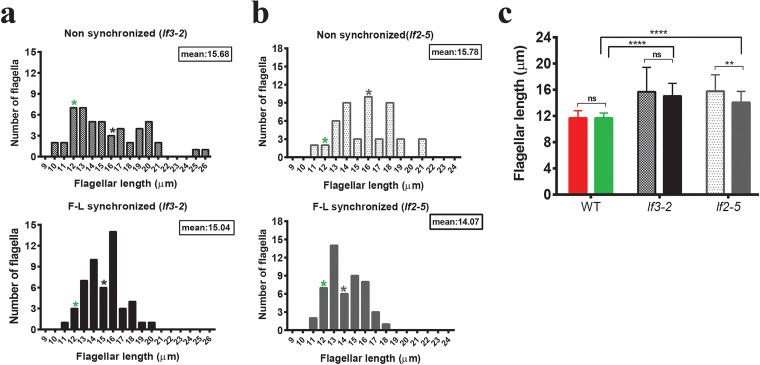
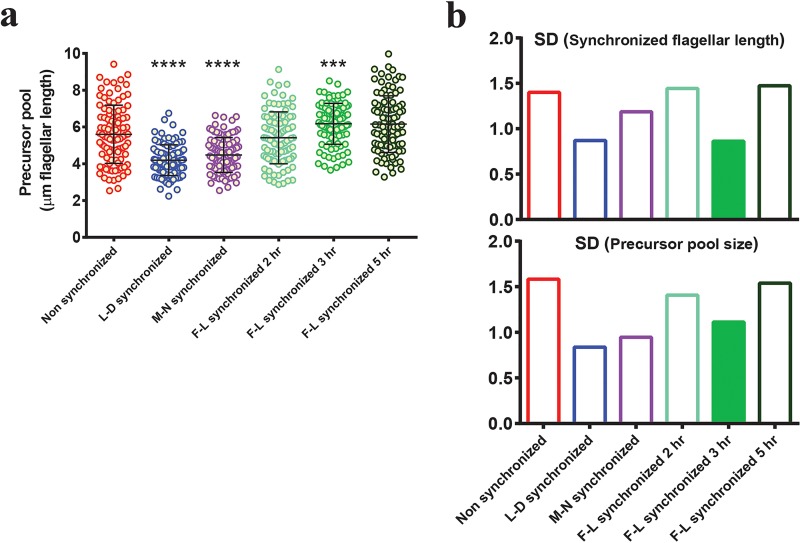
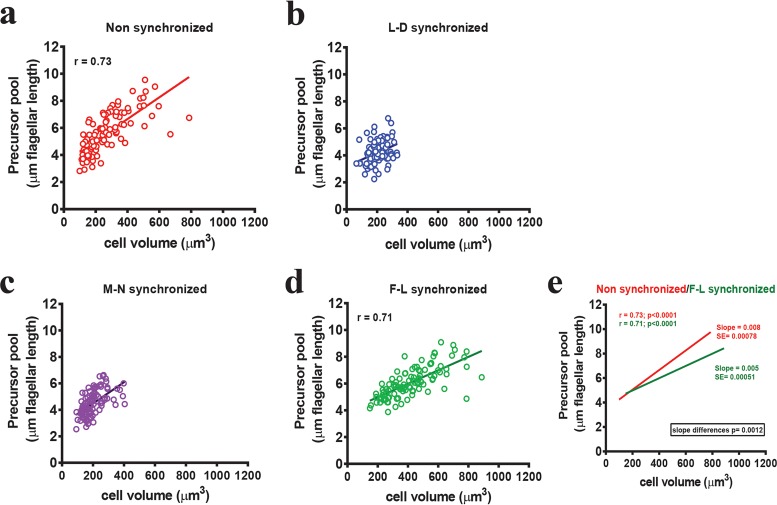
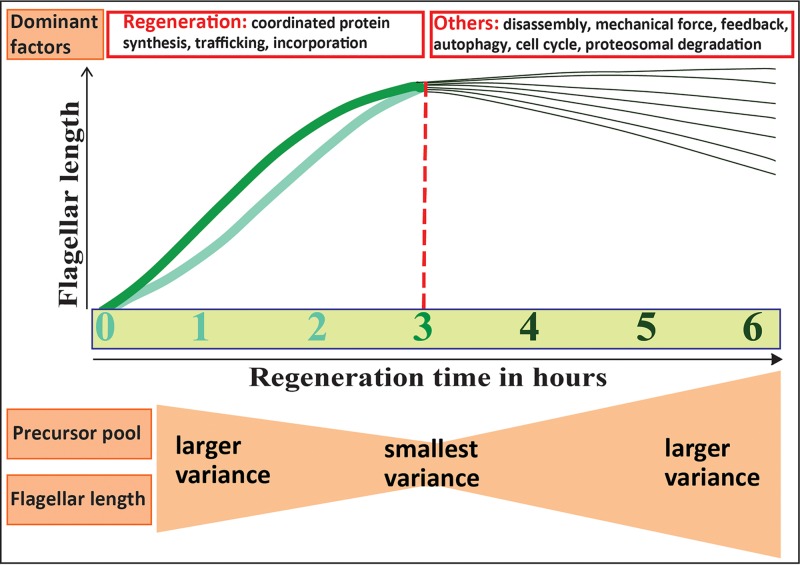
Cilia and flagella are highly conserved antenna-like organelles that found in nearly all mammalian cell types. They perform sensory and motile functions contributing to numerous physiological and developmental processes. Defects in their assembly and function are implicated in a wide range of human diseases ranging from retinal degeneration to cancer. Chlamydomonas reinhardtii is an algal model system for studying mammalian cilium formation and function. Here, we report a simple synchronization method that allows detection of small changes in ciliary length by minimizing variability in the population. We find that this method alters the key relationship between cell size and the amount of protein accumulated for flagellar growth. This provides a rapid alternative to traditional methods of cell synchronization for uncovering novel regulators of cilia.
Overview
The claims and statistics of this paper haven’t been checked yet.
Run the check — free, no account needed. It reads the open-access text and checks the sources it cites.
Integrity signals
Registry
Cites
Statistics
Figures
Verification
Claims the paper makes
The claims and statistics of this paper haven’t been checked yet.
Run the check — free, no account needed. It reads the open-access text and checks the sources it cites.
Self-check
Percentages, sums and reported differences re-computed from the paper’s own numbers.
The self-check needs the paper’s full text.
Citations
Cites
Applied Multiple Regression/Correlation Analysis for the Behavioral Sciences
Cohen, P., Cohen, P., West, S. G., & Aiken, L. S. (2014) · Psychology Press eBooks · doi:10.4324/9781410606266 · Cited by 20,737
Applied Multiple Regression/Correlation Analysis for the Behavioral Sciences
Cohen (2013) · doi:10.4324/9780203774441 · Cited by 3,228
Pazour, G. J., Dickert, B. L., Vucica, Y., Seeley, E. S., Rosenbaum, J. L., Witman, G. B., & Cole, D. G. (2000) · The Journal of Cell Biology · doi:10.1083/jcb.151.3.709 · Cited by 1,147
C HLAMYDOMONAS AS A M ODEL O RGANISM
Harris, E. H. (2001) · Annual Review of Plant Physiology and Plant Molecular Biology · doi:10.1146/annurev.arplant.52.1.363 · Cited by 722
FLAGELLAR ELONGATION AND SHORTENING IN CHLAMYDOMONAS
Rosenbaum, J. L., Moulder, J. E., & Ringo, D. L. (1969) · The Journal of Cell Biology · doi:10.1083/jcb.41.2.600 · Cited by 619
Milo, R. (2013) · BioEssays · doi:10.1002/bies.201300066 · Cited by 614
Basic methods for fission yeast
Forsburg, S. L., & Rhind, N. (2006) · Yeast · doi:10.1002/yea.1347 · Cited by 526
Functional interaction between autophagy and ciliogenesis
Pampliega, O., Orhon, I., Patel, B., Sridhar, S., Díaz-Carretero, A., Beau, I., Codogno, P., Satir, B. H., Satir, P., & Cuervo, A. M. (2013) · Nature · doi:10.1038/nature12639 · Cited by 424
THE MECHANISM OF COLCHICINE INHIBITION OF MITOSIS
Taylor, E. W. (1965) · The Journal of Cell Biology · doi:10.1083/jcb.25.1.145 · Cited by 421
Cavalier-Smith, T. (1974) · Journal of Cell Science · doi:10.1242/jcs.16.3.529 · Cited by 289
Cilium assembly and disassembly
Sánchez, I., & Dynlacht, B. D. (2016) · Nature Cell Biology · doi:10.1038/ncb3370 · Cited by 287
Lefebvre, P. A., Nordstrom, S. A., Moulder, J. E., & Rosenbaum, J. L. (1978) · The Journal of cell biology · doi:10.1083/jcb.78.1.8 · Cited by 260
Assembly and Motility of Eukaryotic Cilia and Flagella. Lessons from Chlamydomonas reinhardtii
Silflow, C. D., & Lefebvre, P. A. (2001) · PLANT PHYSIOLOGY · doi:10.1104/pp.127.4.1500 · Cited by 246
Marshall, W. F., Qin, H., Rodrigo-Brenni, M. C., & Rosenbaum, J. L. (2004) · Molecular Biology of the Cell · doi:10.1091/mbc.e04-07-0586 · Cited by 237
Primary Cilia and the Cell Cycle
Plotnikova, O. V., Pugacheva, E. N., & Golemis, E. A. (2009) · Methods in Cell Biology · doi:10.1016/s0091-679x(08)94007-3 · Cited by 236
Limiting Amounts of Centrosome Material Set Centrosome Size in C. elegans Embryos
Decker, M., Jaensch, S., Pozniakovsky, A., et al. (2011) · Current Biology · doi:10.1016/j.cub.2011.06.002 · Cited by 228
Biological Methods for Cell-Cycle Synchronization of Mammalian Cells
Davis, P. K., Ho, A. L., & Dowdy, S. F. (2001) · BioTechniques · doi:10.2144/01306rv01 · Cited by 211
Control of cell division by a retinoblastoma protein homolog in ChlamydomonasPreprint
Umen, J., & Goodenough, U. W. (2001) · Genes & Development · doi:10.1101/gad.892101 · Cited by 211
Coordinating genome expression with cell size
Marguerat, S., & Bähler, J. (2012) · Trends in Genetics · doi:10.1016/j.tig.2012.07.003 · Cited by 203
Cross, F. R., & Umen, J. (2015) · The Plant Journal · doi:10.1111/tpj.12795 · Cited by 201
The control of gametic differentiation in liquid cultures of Chlamydomonas
Kates, J. R., & Jones, R. F. (1964) · Journal of Cellular and Comparative Physiology · doi:10.1002/jcp.1030630204 · Cited by 190
Lefebvre, P. A. (1980) · Cell · doi:10.1016/0092-8674(80)90633-9 · Cited by 190
Martin, N. C., & Goodenough, U. W. (1975) · The Journal of Cell Biology · doi:10.1083/jcb.67.3.587 · Cited by 187
Assembly and Motility of Eukaryotic Cilia and Flagella. Lessons fromChlamydomonas reinhardtii
Silflow, C. D., & Lefebvre, P. A. (2001) · PLANT PHYSIOLOGY · doi:10.1104/pp.010807 · Cited by 180
Regulation of the Synthesis and Assembly of Ciliary and Flagellar Proteins During Regeneration
Lefebvre, P. A., & Rosenbaum, J. L. (1986) · Annual Review of Cell Biology · doi:10.1146/annurev.cb.02.110186.002505 · Cited by 177
Mitchison, J. M. (2003) · International review of cytology · doi:10.1016/s0074-7696(03)01004-0 · Cited by 175
Cell cycle control by timer and sizer in Chlamydomonas
Donnan, L., & John, P. C. L. (1983) · Nature · doi:10.1038/304630a0 · Cited by 145
The ubiquitin conjugation system is involved in the disassembly of cilia and flagella
Huang, K., Diener, D. R., & Rosenbaum, J. L. (2009) · The Journal of Cell Biology · doi:10.1083/jcb.200903066 · Cited by 135
Rosner, M., Schipany, K., & Hengstschläger, M. (2013) · Nature Protocols · doi:10.1038/nprot.2013.011 · Cited by 129
[4] Synchronously grown cultures of Chlamydomonas reinhardi
SURZYCKI, S. J. (1971) · Methods in enzymology on CD-ROM/Methods in enzymology · doi:10.1016/s0076-6879(71)23080-9 · Cited by 129
Tamiya, H. (1966) · Annual Review of Plant Physiology · doi:10.1146/annurev.pp.17.060166.000245 · Cited by 128
Tammachote, R., Sieben, C. J., Sinders, R. M., Miller, C. A., Czarnecki, P. G., Leightner, A. C., Salisbury, J. L., Ward, C. J., Torres, V. E., Gattone, V. H., et al. (2009) · Human Molecular Genetics · doi:10.1093/hmg/ddp272 · Cited by 126
Rethinking synchronization of mammalian cells for cell cycle analysis
Cooper, S. (2003) · Cellular and Molecular Life Sciences · doi:10.1007/s00018-003-2253-2 · Cited by 125
BACTERIAL SYNCHRONIZATION BY SELECTION OF CELLS AT DIVISION
Helmstetter, C. E., & Cummings, D. J. (1963) · Proceedings of the National Academy of Sciences · doi:10.1073/pnas.50.4.767 · Cited by 114
How Cells Know the Size of Their Organelles
Chan, Y.-H. M., & Marshall, W. F. (2012) · Science · doi:10.1126/science.1223539 · Cited by 113
Renal Primary Cilia Lengthen after Acute Tubular Necrosis
Verghese, E., Ricardo, S. D., Weidenfeld, R., Zhuang, J., Hill, P. A., Langham, R. G., & Deane, J. A. (2009) · Journal of the American Society of Nephrology · doi:10.1681/asn.2008101105 · Cited by 110
Mechanism of ciliary disassembly
Liang, Y., Meng, D., Zhu, B., & Pan, J. (2016) · Cellular and Molecular Life Sciences · doi:10.1007/s00018-016-2148-7 · Cited by 105
Action Spectrum for Resetting the Circadian Phototaxis Rhythm in the CW15 Strain of Chlamydomonas
Kondo, T., Johnson, C. H., & Hastings, J. W. (1991) · PLANT PHYSIOLOGY · doi:10.1104/pp.95.1.197 · Cited by 104
Asleson, C. M., & Lefebvre, P. A. (1998) · Genetics · doi:10.1093/genetics/148.2.693 · Cited by 89
Genetic analysis of long-flagella mutants of Chlamydomonas reinhardtii.
Barsel, S.-E., Wexler, D. E., & Lefebvre, P. A. (1988) · Genetics · doi:10.1093/genetics/118.4.637 · Cited by 80
Kuchka, M. R., & Jarvik, J. W. (1982) · The Journal of Cell Biology · doi:10.1083/jcb.92.1.170 · Cited by 77
Synchronous Division in Chlamydomonas moewusii
Bernstein, E. O. (1960) · Science · doi:10.1126/science.131.3412.1528 · Cited by 67
Actin Is Required for IFT Regulation in Chlamydomonas reinhardtii
Avasthi, P. P., Onishi, M., Karpiak, J. D., Yamamoto, R., Mackinder, L. C. M., Jonikas, M. C., Sale, W. S., Shoichet, B. K., Pringle, J. R., & Marshall, W. F. (2014) · Current Biology · doi:10.1016/j.cub.2014.07.038 · Cited by 66
Self-citationHilton, L. K., Gunawardane, K., Kim, J. W., Schwarz, M. C., & Quarmby, L. M. (2013) · Current Biology · doi:10.1016/j.cub.2013.09.038 · Cited by 66
Harris, E. H. (1989) · Elsevier eBooks · doi:10.1016/b978-0-12-326880-8.50007-9 · Cited by 63
Synchronization of Mammalian Cell Cultures by Serum Deprivation
Langan, T. J., & Chou, R. C. (2011) · Methods in molecular biology · doi:10.1007/978-1-61779-182-6_5 · Cited by 62
Regulation of flagellar length in Chlamydomonas
Tuxhorn, J. A., Daise, T., & Dentler, W. L. (1998) · Cell Motility and the Cytoskeleton · doi:10.1002/(sici)1097-0169(1998)40:2<133::aid-cm3>3.0.co;2-g · Cited by 61
Dentler, W., & Adams, C. D. D. (1992) · The Journal of Cell Biology · doi:10.1083/jcb.117.6.1289 · Cited by 60
Regulation of flagellar length in Chlamydomonas
WILSON, N., Iyer, J., Buchheim, J. A., & Meek, W. D. (2008) · Seminars in Cell and Developmental Biology · doi:10.1016/j.semcdb.2008.07.005 · Cited by 55
The transcriptional program of synchronous gametogenesis in Chlamydomonas reinhardtii
Abe, J., Kubo, T., Takagi, Y., Saito, T., Miura, K., Fukuzawa, H., & Matsuda, Y. (2004) · Current Genetics · doi:10.1007/s00294-004-0526-4 · Cited by 54
Short-Flagella Mutants of Chlamydomonas reinhardtii
Kuchka, M. R., & Jarvik, J. W. (1987) · Genetics · doi:10.1093/genetics/115.4.685 · Cited by 52
Fraser, R. S. S., & Nurse, P. (1979) · Journal of Cell Science · doi:10.1242/jcs.35.1.25 · Cited by 47
Darżynkiewicz, Z., Halicka, H. D., Zhao, H. L., & Podhorecka, M. (2011) · Methods in molecular biology · doi:10.1007/978-1-61779-182-6_6 · Cited by 46
Onishi, M., Pringle, J. R., & Cross, F. R. (2015) · Genetics · doi:10.1534/genetics.115.184663 · Cited by 41
Chapter IX Methods for Studying the Microbial Division Cycle
Helmstetter, C. E. (1969) · Methods in microbiology · doi:10.1016/s0580-9517(08)70140-5 · Cited by 38
Stochastic simulation of actin dynamics reveals the role of annealing and fragmentation
Fass, J., Pak, C. W., Bamburg, J. R., & Mogilner, A. (2008) · Journal of Theoretical Biology · doi:10.1016/j.jtbi.2008.01.001 · Cited by 35
Synchronization of cell division in microorganisms by percoll gradients
Dwek, R., Kobrin, L. H., Grossman, N., & Ron, E. Z. (1980) · Journal of Bacteriology · doi:10.1128/jb.144.1.17-21.1980 · Cited by 30
Hoogenhout, H. (1963) · Phycologia · doi:10.2216/i0031-8884-2-4-135.1 · Cited by 26
Lemaire, S. D., Hours, M. C., Gérard‐Hirne, C., Trouabal, A., Roche, O., & Jacquot, J. (1999) · European Journal of Phycology · doi:10.1080/09670269910001736332 · Cited by 26
A ten-year search for synchronous cells: obstacles, solutions, and practical applications
Helmstetter, C. E. (2015) · Frontiers in Microbiology · doi:10.3389/fmicb.2015.00238 · Cited by 19
Rooney, D. W., & Eiler, J. J. (1969) · The Journal of Cell Biology · doi:10.1083/jcb.41.1.145 · Cited by 18
Farrell, K. (1976) · Journal of Cell Science · doi:10.1242/jcs.20.3.639 · Cited by 17
Fission Yeast Cell Cycle Synchronization Methods
Tormos-Pérez, M., Pérez-Hidalgo, L., & Moreno, S. (2015) · Methods in molecular biology · doi:10.1007/978-1-4939-3145-3_20 · Cited by 17
Ai, X., Liang, Q., Luo, M., Zhang, K., Pan, J., & Luo, G. (2012) · Lab on a Chip · doi:10.1039/c2lc40638a · Cited by 17
Gene Regulation: Global Transcription Rates Scale with Size
Dungrawala, H., Manukyan, A., & Schneider, B. L. (2010) · Current Biology · doi:10.1016/j.cub.2010.09.064 · Cited by 16
Abnormal length of cilia—a cause of primary ciliary dyskinesia—a case report
Niggemann, B., Müller, A., Nolte, A., Schnoy, N., & Wahn, U. (1992) · European Journal of Pediatrics · doi:10.1007/bf02073899 · Cited by 16
Regulation of the Synthesis and Assembly of Ciliary and Flagellar Proteins During Regeneration
Lefebvre, P. (1986) · Annual Review of Cell and Developmental Biology · doi:10.1146/annurev.cellbio.2.1.517 · Cited by 15
Nie, X., Hamlett, E. D., Granholm, A., Hui, E. S. K., Helpern, J. A., Jensen, J. H., Boger, H. A., Collins, H. R., & Falangola, M. F. (2014) · Magnetic Resonance Imaging · doi:10.1016/j.mri.2014.12.008 · Cited by 14
Synchronization of Chlamydomonas division with intermittent hypothermia*1
Rooney, D. W., YEN, B., & Mikita, D. J. (1971) · Experimental Cell Research · doi:10.1016/s0014-4827(71)80053-8 · Cited by 13
Selection synchrony of Chlamydomonas using the Rastgeldi Threshold Centrifuge
Knutsen, G., Lien, T., Schreiner, Ø., & Vaage, R. (1973) · Experimental Cell Research · doi:10.1016/0014-4827(73)90106-7 · Cited by 10
Synchronization of the Cell Division Cycle of Chlamydomonas eugametos
Demets, R., Tomson, A. M., Ran, E. T. H., Sigon, C. A. M., Stegwee, D., & ENDE, H. V. D. (1985) · Microbiology · doi:10.1099/00221287-131-11-2919 · Cited by 10
Deflagellation and Regeneration in Chlamydomonas
Dentler, W. L. (2014) · BIO-PROTOCOL · doi:10.21769/bioprotoc.1155 · Cited by 1
Metadata
- Authors
- Dutta, S., & Avasthi, P.
- Affiliations
- University of Kansas Medical Center (US)
- Corresponding author
- Avasthi, Prachee
- Venue
- mSphere
- Publisher
- American Society for Microbiology
- Published
- 2017-04-26
- Volume
- 2
- Issue
- 2
- ISSN
- 2379-5042 (ISSN-L)
- PMC
- PMC5343170
- OpenAlex
- W2951402366
- Cited by
- 3
- References
- 73
- Citations by year
- 2022: 1 · 2019: 1 · 2018: 1
- FWCI
- 0.36
- Type
- journal article
- Language
- en
- Open access
- gold
- doi.org
- Licence
- cc-by
- creativecommons.org/licenses/by/4.0/ (vor)
- journals.asm.org/non-commercial-tdm-license (tdm)
- Locations
- mSphere (publishedVersion, cc-by)
- bioRxiv (Cold Spring Harbor Laboratory) (acceptedVersion, cc-by-nc)
- Europe PMC (PubMed Central) (publishedVersion, cc-by)
- PubMed Central (publishedVersion, cc-by)
- PubMed (publishedVersion)
- DOAJ (DOAJ: Directory of Open Access Journals) (submittedVersion)
- DOAJ (DOAJ: Directory of Open Access Journals) (submittedVersion, cc-by-sa)
- KU ScholarWorks (University of Kansas) (submittedVersion, cc-by)
- KU ScholarWorks (The University of Kansas) (submittedVersion, cc-by)
- Funders
- HHS | NIH | National Institute of General Medical Sciences (P20 GM104936, P20 GM103418)
- Topics
- Life Sciences › Biochemistry, Genetics and Molecular Biology › Genetics › Genetic and Kidney Cyst Diseases
- Health Sciences › Medicine › Pulmonary and Respiratory Medicine › Cystic Fibrosis Research Advances
- Life Sciences › Biochemistry, Genetics and Molecular Biology › Cell Biology › Microtubule and mitosis dynamics
- Keywords
- flagellar synchronization, cell cycle synchronization, cilia, flagella, Chlamydomonas reinhardtii, ciliary length, cell size, ciliary assembly, ciliary motility
About these checks
Registry, retraction, Cites and statistics results are computed, not judged, with one exception: a printed reference that no index lists is read once by a model before it counts as a citation error. Claims are extracted by a model and kept only when their quote appears verbatim in the text; each cited source is then checked, with a model’s help, for whether it says what the claim relies on. Those verdicts can be wrong — read the claim’s quote and the cited source before relying on one.
Statistics and arithmetic are recomputed, not judged.
Confidence bands are shown only for fields calibrated on our annotated test set. None is calibrated yet, so no band is shown.
What counts as a claim ›How we measure confidence ›How we check this ›
Are you an author, or do you see a problem with this page? Request a review
Data sources
Bibliographic data: Semantic Scholar, OpenAlex, Crossref.
Contains information from the Semantic Scholar Academic Graph Datasets, made available under the ODC Attribution License (ODC-BY 1.0).
Semantic Scholar’s data is described in: Kinney, R., et al. (2023). The Semantic Scholar Open Data Platform. arXiv:2301.10140.
