Cited by 22

The DOI matches its Crossref record; 2 of the 2 references it cites were found in a registry or an index.

AhrC Negatively Regulates Streptococcus mutans Arginine Biosynthesis

Jing, Meiling, Zheng, Ting, Gong, Tao, Yan, Jiangchuan, Chen, Jiamin, Lin, Yongwang, Tang, Boyu, Ma, Qizhao, Zhou, Xuedong, Li, Yuqing·2022·Microbiology Spectrum

Abstract

Arginine metabolism is essential for bacterial growth. The regulation of intracellular arginine metabolism in Streptococcus mutans , one of the major pathogens of dental caries, is unclear.

Overview

The claims and statistics of this paper haven’t been checked yet.

Run the check — free, no account needed. It reads the open-access text and checks the sources it cites.

A few free checks a day · papers already verified open instantly · results are public

Integrity signals

Registry

Crossref · 10.1128/spectrum.00721-22

Cites

2 of 2 references verified0 citation errors · 0 not checkable

Statistics

Figures

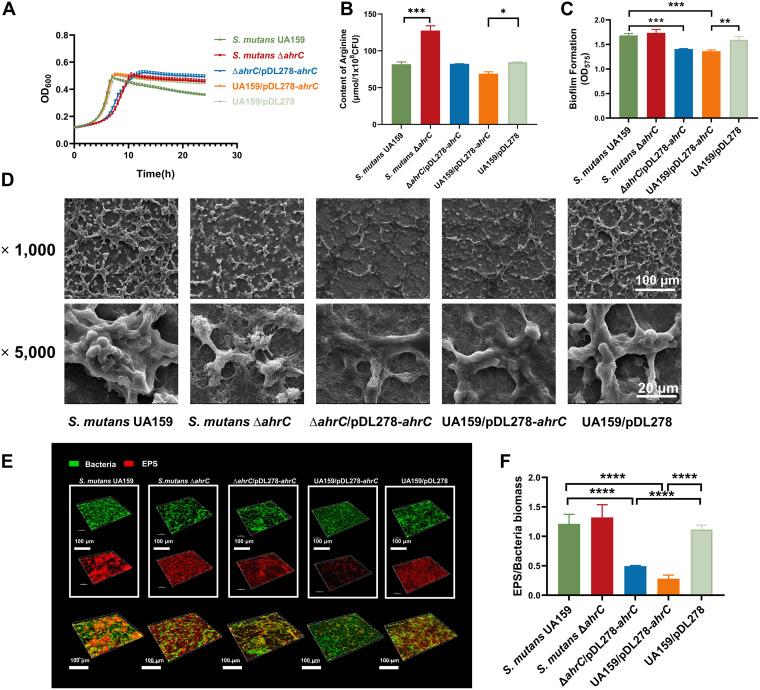
FIG 1 The growth characteristics, the content of arginine, and biofilm formation of S. mutans. (A) Growth curves of S. mutans strains grown in BHI medium for 24 h. (B) The content of arginine in S. mutans strains. (C) The biofilm biomass of S. mutans strains grown in BHIS medium for 24 h. (D) The SEM images show the 6-h biofilms of S. mutans strains. Images were taken at ×1,000 and ×5,000 magnification. (E) Double-labeled images of 6-h S. mutans strain biofilms. Red represents the EPS (Alexa Flour 647), and green represents the bacteria (SYTO 9). Images were taken at ×60 oil magnification and analyzed with IMARIS 9.0. Representative images are shown from at least five randomly selected fields of each sample. (F) The EPS/bacteria ratio of 6-h S. mutans biofilms. The data were quantified with ImageJ. The results were the mean values of five randomly selected areas in each sample, expressed as mean ± standard deviation.
FIG 1 The growth characteristics, the content of arginine, and biofilm formation of S. mutans. (A) Growth curves of S. mutans strains grown in BHI medium for 24 h. (B) The content of arginine in S. mutans strains. (C) The biofilm biomass of S. mutans strains grown in BHIS medium for 24 h. (D) The SEM images show the 6-h biofilms of S. mutans strains. Images were taken at ×1,000 and ×5,000 magnification. (E) Double-labeled images of 6-h S. mutans strain biofilms. Red represents the EPS (Alexa Flour 647), and green represents the bacteria (SYTO 9). Images were taken at ×60 oil magnification and analyzed with IMARIS 9.0. Representative images are shown from at least five randomly selected fields of each sample. (F) The EPS/bacteria ratio of 6-h S. mutans biofilms. The data were quantified with ImageJ. The results were the mean values of five randomly selected areas in each sample, expressed as mean ± standard deviation.CC BY · PubMed Central
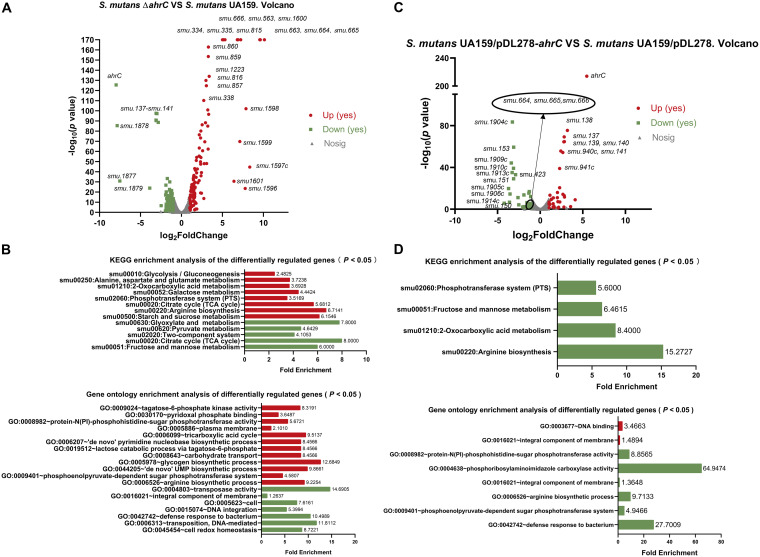
FIG 2 Transcriptomic analysis of the ΔahrC and UA159/pDL278-ahrC strains. (A) Volcano plot showing the differences in gene expression between S. mutans UA159 and the ΔahrC strain. (B) The KEGG pathway analysis and the GO enrichment analysis of DEGs in the ΔahrC strain. (C) Volcano plot showing the gene expression differences between S. mutans UA159/pDL278 and S. mutans UA159/pDL278-ahrC. (D) The KEGG pathway analysis and the GO enrichment analysis of DEGs in S. mutans UA159/pDL278-ahrC. Upregulated genes are shown in red, whereas downregulated genes are shown in green. GO, gene ontology; KEGG, Kyoto Encyclopedia of Genes and Genomes.
FIG 2 Transcriptomic analysis of the ΔahrC and UA159/pDL278-ahrC strains. (A) Volcano plot showing the differences in gene expression between S. mutans UA159 and the ΔahrC strain. (B) The KEGG pathway analysis and the GO enrichment analysis of DEGs in the ΔahrC strain. (C) Volcano plot showing the gene expression differences between S. mutans UA159/pDL278 and S. mutans UA159/pDL278-ahrC. (D) The KEGG pathway analysis and the GO enrichment analysis of DEGs in S. mutans UA159/pDL278-ahrC. Upregulated genes are shown in red, whereas downregulated genes are shown in green. GO, gene ontology; KEGG, Kyoto Encyclopedia of Genes and Genomes.CC BY · PubMed Central
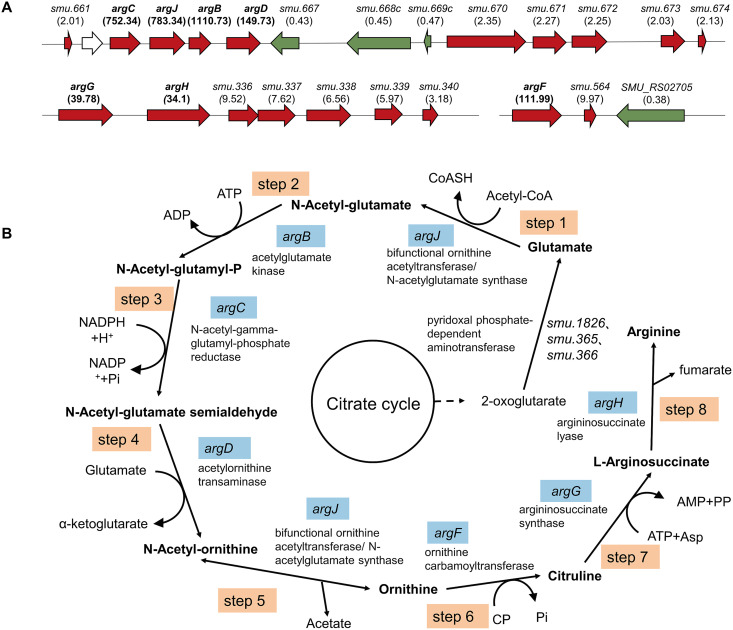
FIG 3 Genes regulating the arginine biosynthesis pathway. (A) The differentially expressed arginine biosynthesis operons in the S. mutans ΔahrC strain. The genetic organization of differentially expressed gene clusters associated with arginine biosynthesis in the S. mutans ΔahrC strain. Upregulated genes are indicated in red, whereas downregulated genes are shown in green, with the fold of differential expression represented by the values in parentheses. (B) Flowchart of the arginine biosynthesis pathway in S. mutans. Genes encoding enzymes in the arginine synthesis pathway are indicated in blue.
FIG 3 Genes regulating the arginine biosynthesis pathway. (A) The differentially expressed arginine biosynthesis operons in the S. mutans ΔahrC strain. The genetic organization of differentially expressed gene clusters associated with arginine biosynthesis in the S. mutans ΔahrC strain. Upregulated genes are indicated in red, whereas downregulated genes are shown in green, with the fold of differential expression represented by the values in parentheses. (B) Flowchart of the arginine biosynthesis pathway in S. mutans. Genes encoding enzymes in the arginine synthesis pathway are indicated in blue.CC BY · PubMed Central
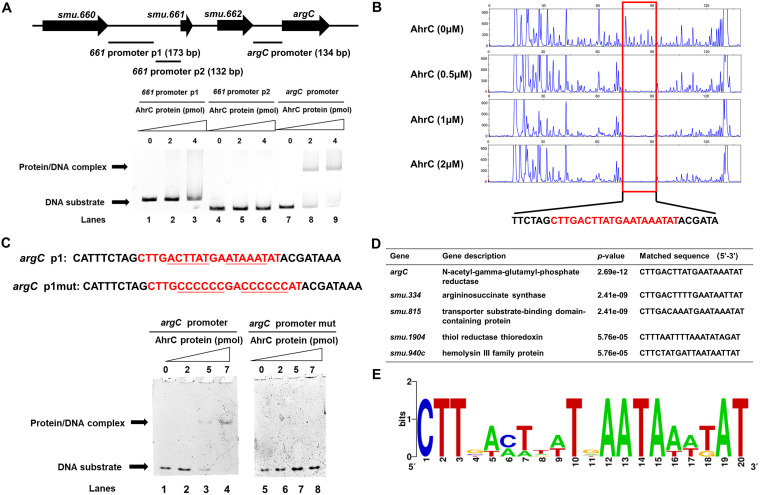
FIG 4 Identification of conserved DNA motif bound by AhrC. (A) The result of electrophoretic mobility shift assay (EMSA) showing AhrC protein binding to the argC promoter (lanes 7 to 9). (B) DNase I footprinting experiments showing the protective effect of AhrC protein (0, 0.5, 1, and 2 μM) against 5-FAM-labeled primers of argC promoter. The sequence of the protected area is indicated in red. (C) The conserved palindromic sequences and mutated sequences of argC promoter. DNA binding activity of AhrC on argC promoter p1 (lanes 1 to 4) and argC promoter p1mut (lanes 5 to 8). (D) The prediction of AhrC binding sequence in selected gene promoters. (E) The sequence logo for AhrC binding motif was generated by the WebLogo tool.
FIG 4 Identification of conserved DNA motif bound by AhrC. (A) The result of electrophoretic mobility shift assay (EMSA) showing AhrC protein binding to the argC promoter (lanes 7 to 9). (B) DNase I footprinting experiments showing the protective effect of AhrC protein (0, 0.5, 1, and 2 μM) against 5-FAM-labeled primers of argC promoter. The sequence of the protected area is indicated in red. (C) The conserved palindromic sequences and mutated sequences of argC promoter. DNA binding activity of AhrC on argC promoter p1 (lanes 1 to 4) and argC promoter p1mut (lanes 5 to 8). (D) The prediction of AhrC binding sequence in selected gene promoters. (E) The sequence logo for AhrC binding motif was generated by the WebLogo tool.CC BY · PubMed Central
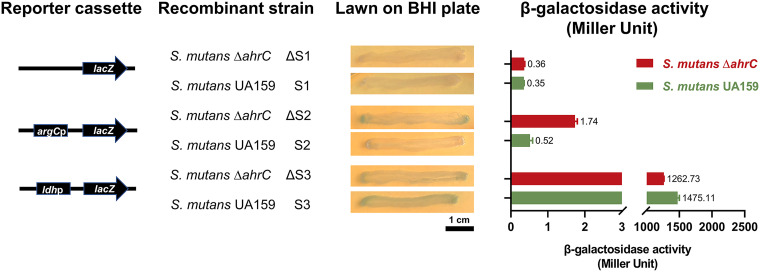
FIG 5 AhrC served as a suppressor. Constructing a series of lacZ and promoter-lacZ coexpression plasmids to analyze the effect of AhrC on argC expression. A schematic representation of each cloned reporter box is used to produce a recombinant strain. The lacZ and ldhp-lacZ plasmids were used as controls. The recombinant strains were inoculated on BHI-agar plates containing 1 mg/mL spectinomycin and 40 μg/mL X-gal for 48 h of incubation. The results of β-galactosidase activity analysis were expressed in Miller units. The data consisted of three replicates, expressed as mean ± standard deviation.
FIG 5 AhrC served as a suppressor. Constructing a series of lacZ and promoter-lacZ coexpression plasmids to analyze the effect of AhrC on argC expression. A schematic representation of each cloned reporter box is used to produce a recombinant strain. The lacZ and ldhp-lacZ plasmids were used as controls. The recombinant strains were inoculated on BHI-agar plates containing 1 mg/mL spectinomycin and 40 μg/mL X-gal for 48 h of incubation. The results of β-galactosidase activity analysis were expressed in Miller units. The data consisted of three replicates, expressed as mean ± standard deviation.CC BY · PubMed Central

Verification

Claims the paper makes

The claims and statistics of this paper haven’t been checked yet.

Run the check — free, no account needed. It reads the open-access text and checks the sources it cites.

A few free checks a day · papers already verified open instantly · results are public

Claims other papers make about this one

Each is checked against this paper’s own text: does it say what the citing paper says it does?

Self-check

Percentages, sums and reported differences re-computed from the paper’s own numbers.

The self-check needs the paper’s full text.

Citations

Cites

Research works printed but not linked: 61

  1. 10.1016/S0140-6736(07)60031-2 · DOI · Paper page
  2. 10.1016/j.tim.2017.09.008 · DOI · Paper page
  3. 10.1073/pnas.1919099117 · DOI
  4. 10.1038/ijos.2012.54 · DOI
  5. 10.1159/000499037 · DOI
  6. 10.1128/AEM.00496-17 · DOI
  7. 10.1080/20002297.2021.2015166 · DOI
  8. 10.1093/jn/137.6.1602S · DOI
  9. 10.1515/hsz-2019-0182 · DOI
  10. 10.1042/bst0320310 · DOI
  11. 10.1371/journal.pone.0032697 · DOI
  12. 10.1007/s00253-020-10868-6 · DOI
  13. 10.1073/pnas.1919683117 · DOI
  14. 10.3389/fmicb.2017.00145 · DOI
  15. 10.1099/mic.0.043067-0 · DOI · Paper page
  16. 10.1111/1462-2920.12897 · DOI
  17. 10.1074/jbc.M111.295832 · DOI
  18. 10.1016/j.biochi.2019.08.018 · DOI
  19. 10.1128/JB.00269-18 · DOI
  20. 10.1111/omi.12207 · DOI
  21. 10.1128/IAI.01210-12 · DOI
  22. 10.1038/s41598-017-17383-1 · DOI
  23. 10.1099/mic.0.2008/018929-0 · DOI
  24. 10.1128/JB.00779-06 · DOI
  25. 10.1126/sciadv.aay9597 · DOI
  26. 10.1128/JB.01641-08 · DOI
  27. 10.1128/IAI.68.2.925-930.2000 · DOI
  28. 10.1111/mmi.14597 · DOI
  29. 10.1139/w10-039 · DOI
  30. 10.1111/omi.12196 · DOI
  31. 10.1093/bioinformatics/btr064 · DOI · Paper page
  32. 10.1101/gr.849004 · DOI
  33. 10.1128/MMBR.00032-06 · DOI
  34. 10.3390/genes11040423 · DOI
  35. 10.1046/j.1432-1327.2000.01593.x · DOI
  36. 10.1111/j.1432-1033.1997.0232a.x · DOI
  37. 10.1128/AEM.00177-19 · DOI
  38. 10.1016/j.bbrc.2012.02.085 · DOI
  39. 10.3390/ijms23084386 · DOI
  40. 10.1128/mSphere.00295-17 · DOI
  41. 10.1177/0022034514561259 · DOI
  42. 10.1038/s41598-017-07042-w · DOI
  43. 10.1038/s41598-020-70675-x · DOI
  44. 10.3389/fmicb.2018.03224 · DOI
  45. 10.1111/j.1365-2958.2009.07029.x · DOI
  46. 10.1128/JB.00169-06 · DOI
  47. Huo YB, Mai JN, Ling JQ, Huo LJ. 2011. Effects of immA and immB coding putative bacteriocin immunity proteins on the antimicrobial sensitivity in planktonic Streptococcus mutans and biofilm formation. Zhonghua Kou Qiang Yi Xue Za Zhi 46:478–483. (In Chinese.)
  48. 10.1128/JB.02433-14 · DOI
  49. 10.1128/AEM.06362-11 · DOI
  50. 10.1128/mSystems.00788-21 · DOI
  51. 10.1073/pnas.1822026116 · DOI
  52. 10.1007/978-1-4939-9236-2_13 · DOI
  53. 10.1038/s41368-020-0079-5 · DOI
  54. 10.1111/omi.12264 · DOI
  55. 10.1093/bioinformatics/btu170 · DOI · Paper page
  56. 10.1186/s13059-014-0572-2 · DOI
  57. 10.1038/nmeth.1226 · DOI · Paper page
  58. Anders S. 2012. Analysing RNA-seq data with the DESeq package. Molecular Biology
  59. 10.1186/1471-2180-10-242 · DOI
  60. 10.1177/0022034520927385 · DOI
  61. 10.1177/00220345211000668 · DOI

Cited by

Sorted by citations

See all 22

Metadata

Authors
Jing, M., Zheng, T., Gong, T., Yan, J., Chen, J., Lin, Y., Tang, B., Ma, Q., Zhou, X., & Li, Y.
Affiliations
State Key Laboratory of Oral Diseases, National Clinical Research Center for Oral Diseases, West China Hospital of Stomatology, Sichuan University, Chengdu, China
Venue
Microbiology Spectrum
Published
2022-08-31
Volume
10
Issue
4
ISSN
2165-0497
Cited by
22
References
2
Language
en
Funders
National Natural Science Foundation of China (31870065, 32170046)

About these checks

Registry, retraction, Cites and statistics results are computed, not judged, with one exception: a printed reference that no index lists is read once by a model before it counts as a citation error. Claims are extracted by a model and kept only when their quote appears verbatim in the text; each cited source is then checked, with a model’s help, for whether it says what the claim relies on. Those verdicts can be wrong — read the claim’s quote and the cited source before relying on one.

Statistics and arithmetic are recomputed, not judged.

Confidence bands are shown only for fields calibrated on our annotated test set. None is calibrated yet, so no band is shown.

What counts as a claim ›How we measure confidence ›How we check this ›

Are you an author, or do you see a problem with this page? Request a review