

The DOI matches its Crossref record; 48 of the 50 references it cites were found in a registry or an index.
Recent trends in life expectancy across high income countries: retrospective observational study
Open accessAbstract
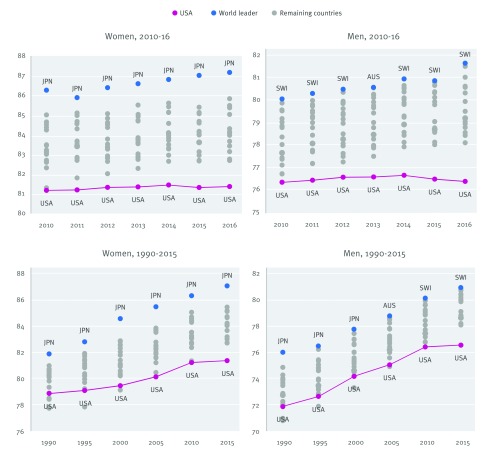
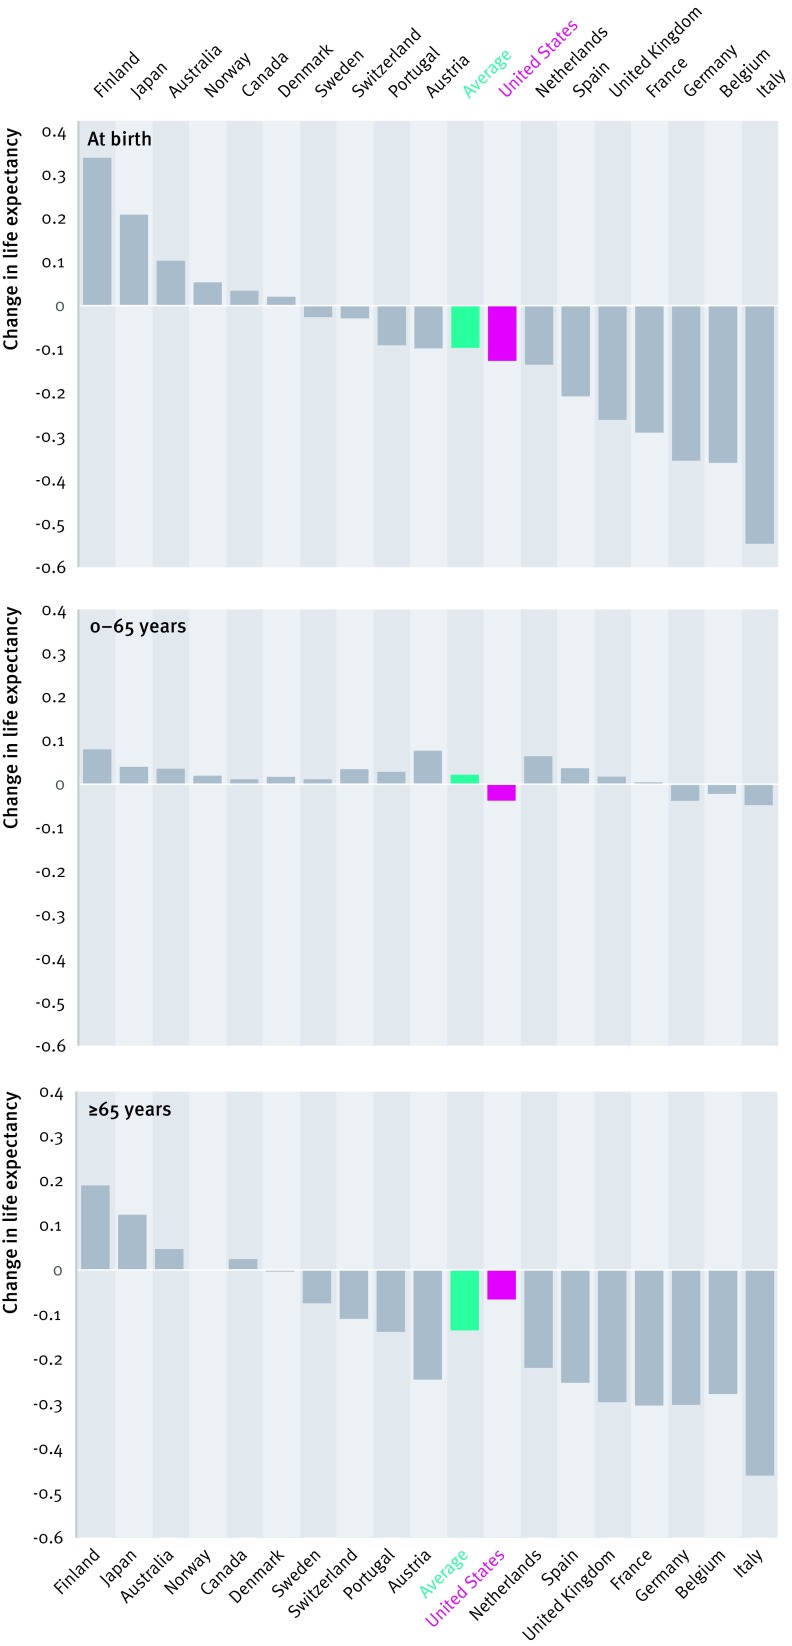
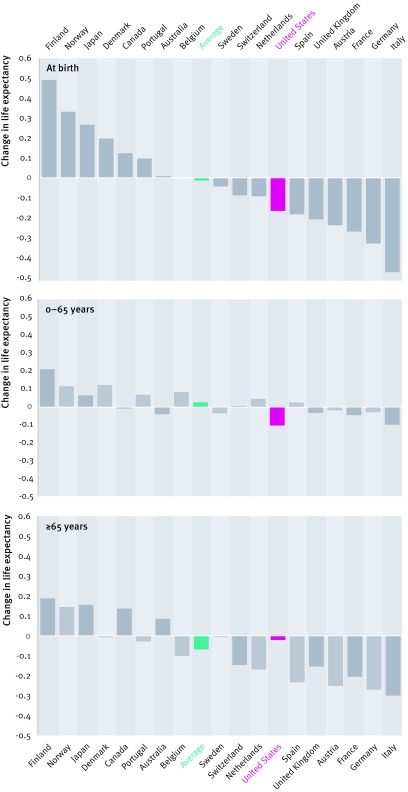
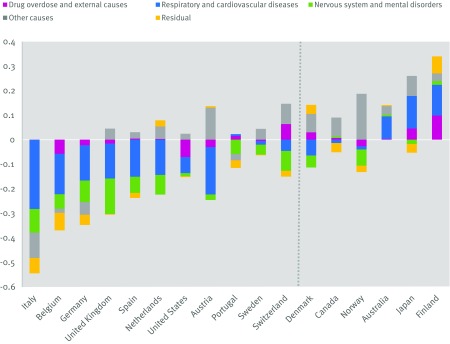
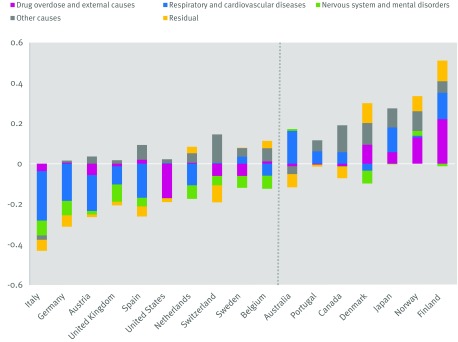
OBJECTIVES: To assess whether declines in life expectancy occurred across high income countries during 2014-16, to identify the causes of death contributing to these declines, and to examine the extent to which these declines were driven by shared or differing factors across countries. DESIGN: Demographic analysis using aggregated data. SETTING: Vital statistics systems of 18 member countries of the Organisation for Economic Co-operation and Development. PARTICIPANTS: 18 countries with high quality all cause and cause specific mortality data available in 2014-16. MAIN OUTCOME MEASURES: Life expectancy at birth, 0-65 years, and 65 or more years and cause of death contributions to changes in life expectancy at birth. RESULTS: The majority of high income countries in the study experienced declines in life expectancy during 2014-15; of the 18 countries, 12 experienced declines in life expectancy among women and 11 experienced declines in life expectancy among men. The average decline was 0.21 years for women and 0.18 years for men. In most countries experiencing declines in life expectancy, these declines were predominantly driven by trends in older age (≥65 years) mortality and in deaths related to respiratory disease, cardiovascular disease, nervous system disease, and mental disorders. In the United States, declines in life expectancy were more concentrated at younger ages (0-65 years), and drug overdose and other external causes of death played important roles in driving these declines. CONCLUSIONS: Most of the countries that experienced declines in life expectancy during 2014-15 experienced robust gains in life expectancy during 2015-16 that more than compensated for the declines. However, the United Kingdom and the United States appear to be experiencing stagnating or continued declines in life expectancy, raising questions about future trends in these countries.
Overview
The claims and statistics of this paper haven’t been checked yet.
Run the check — free, no account needed. It reads the open-access text and checks the sources it cites.
Integrity signals
Registry
Cites
Statistics
Figures
Verification
Claims the paper makes
The claims and statistics of this paper haven’t been checked yet.
Run the check — free, no account needed. It reads the open-access text and checks the sources it cites.
Claims other papers make about this one
Each is checked against this paper’s own text: does it say what the citing paper says it does?
The cited source says what the claim attributes to it.
In the citing paper
“Nonetheless, the slowdown in the United States has exceeded that of all other high-income countries, resulting in a significant widening of the US shortfall in life expectancy relative to its peers (5–7).”
From Insights into US life expectancy stagnation from birth cohort mortality dynamics (2026) · cites this paper as [5]
In the citing paper
“which was already an exceptionally bad year for life expectancy due to an irregularly strong flu season.”
From Quantifying impacts of the COVID-19 pandemic through life-expectancy losses: a population-level study of 29 countries (2022) · cites this paper as [13]
In the citing paper
“To put this into perspective, the 2014–2015 strong flu season was regarded as an exceptionally bad year among high-income countries, causing drops in life expectancy.13”
From Quantifying impacts of the COVID-19 pandemic through life-expectancy losses: a population-level study of 29 countries (2022) · cites this paper as [13]
In the citing paper
“our findings reflect a deepening during the pandemic of the US mid-life mortality crisis that has led to the stalling of life expectancy in recent years.13,14,46”
From Quantifying impacts of the COVID-19 pandemic through life-expectancy losses: a population-level study of 29 countries (2022) · cites this paper as [13]
In the citing paper
“The largest drop was observed in Italy with a loss of around half a year among males and females.”
From Quantifying impacts of the COVID-19 pandemic through life-expectancy losses: a population-level study of 29 countries (2022) · cites this paper as [13]
Self-check
Percentages, sums and reported differences re-computed from the paper’s own numbers.
The self-check needs the paper’s full text.
Citations
Cites
Yaşlı Kadınlarda Üreme Sağlığı
Kokanalı, D., & Engin Üstün, Y. (n.d.) · DergiPark (Istanbul University) · Cited by 170,090
Demography, Measuring and Modeling Population Processes
Véron, J., Preston, S. H., Heuveline, P., & Guillot, M. (2002) · Population · doi:10.2307/1535065 · Cited by 1,709
Drug Overdose Deaths in the United States, 1999–2020
Hedegaard, H., Miniño, A., Spencer, M. R., & Warner, M. (2021) · doi:10.15620/cdc:112340 · Cited by 1,283
Acute Myocardial Infarction after Laboratory-Confirmed Influenza Infection
Kwong, J. C., Schwartz, K. L., Campitelli, M. A., Chung, H., Crowcroft, N. S., Karnauchow, T., Katz, K. C., Ko, D. T., McGeer, A., McNally, D., et al. (2018) · New England Journal of Medicine · doi:10.1056/nejmoa1702090 · Cited by 1,231
Income distribution and life expectancy.
Wilkinson, R. G. (1992) · BMJ · doi:10.1136/bmj.304.6820.165 · Cited by 1,195
A nonidentifiability aspect of the problem of competing risks.
Tsiatis, A. A. (1975) · Proceedings of the National Academy of Sciences · doi:10.1073/pnas.72.1.20 · Cited by 870
OECD (2017) · Health at a glance · doi:10.1787/health_glance-2017-en · Cited by 822
Introduction to Stochastic Processes in Biostatistics
Bartlett, M. S., & Chiang, C. L. (1969) · Revue de l Institut International de Statistique / Review of the International Statistical Institute · doi:10.2307/1402301 · Cited by 684
Mortality in the United States, 2024
Xu, J., Murphy, S. L., Kochanek, K. D., & Arias, E. (2026) · doi:10.15620/cdc/174641 · Cited by 461
Estimating Influenza Disease Burden from Population-Based Surveillance Data in the United States
Reed, C., Chaves, S. S., Kirley, P. D., Emerson, R., Aragon, D., Hancock, E. B., Butler, L., Baumbach, J., Hollick, G. E., Bennett, N. M., et al. (2015) · PLoS ONE · doi:10.1371/journal.pone.0118369 · Cited by 390
Research works printed but not linked: 1
- [8]Woolf SH Aron L, eds. Institute of Medicine and National Research Council. U.S. Health in International Perspective: Shorter Lives, Poorer Health. National Academies Press, 2013. 24006554
Cited by
Sorted by citations
Life Expectancy and Mortality Rates in the United States, 1959-2017
Woolf, S. H., & Schoomaker, H. (2019) · JAMA · doi:10.1001/jama.2019.16932 · Cited by 968
McKee, M., & Stückler, D. (2020) · Nature Medicine · doi:10.1038/s41591-020-0863-y · Cited by 546
Andrasfay, T., & Goldman, N. (2021) · Proceedings of the National Academy of Sciences · doi:10.1073/pnas.2014746118 · Cited by 490
Is Cardiovascular Disease Slowing Improvements in Life Expectancy?
OECD, & Fund, T. K. (2020) · OECD eBooks · doi:10.1787/47a04a11-en · Cited by 445
Aburto, J. M., Schöley, J., Kashnitsky, I., Zhang, L., Rahal, C., Missov, T. I., Mills, M. C., Dowd, J. B., & Kashyap, R. (2022) · International Journal of Epidemiology · doi:10.1093/ije/dyab207 · Cited by 531
Metadata
- Authors
- Ho, J. Y., & Hendi, A. S.
- Affiliations
- University of Southern California (US)
- Princeton University (US)
- Corresponding author
- Ho, Jessica Y
- Venue
- BMJ
- Publisher
- BMJ
- Published
- 2018-08-15
- Volume
- 362
- Pages
- k2562
- ISSN
- 1756-1833 (ISSN-L)
- 0959-8138
- PMC
- PMC6092679
- OpenAlex
- W2887239822
- Cited by
- 439
- References
- 50
- Citations by year
- 2026: 17 · 2025: 36 · 2024: 62 · 2023: 66 · 2022: 66 · 2021: 66 · 2020: 59 · 2019: 57 · 2018: 10
- FWCI
- 99.22
- Type
- journal article
- Language
- en
- Update notices
- correction (2018-08-22)
- Open access
- hybrid
- doi.org
- Licence
- Locations
- BMJ (publishedVersion, cc-by-nc)
- Europe PMC (PubMed Central) (publishedVersion, other-oa)
- PubMed Central (publishedVersion, cc-by-nc)
- PubMed (publishedVersion)
- HighWire Press Open Archive (submittedVersion)
- Funders
- Eunice Kennedy Shriver National Institute of Child Health and Human Development (R00HD083519, P2CHD047879)
- Topics
- Social Sciences › Demography › Insurance, Mortality, Demography, Risk Management
- Health Sciences › Medicine › Epidemiology › Healthcare Systems and Public Health
- Social Sciences › Health › Health disparities and outcomes
- Keywords
- life expectancy decline, high-income countries, cause-specific mortality, drug overdose, respiratory mortality, cardiovascular mortality, sex differences in longevity, United States, United Kingdom, mortality trends
- MeSH terms
- Adolescent, Adult, Aged, Child, Child, Preschool, Female, Humans, Infant, Infant, Newborn, Life Expectancy, Male, Middle Aged, Mortality, Retrospective Studies, Developed Countries, Young Adult
About these checks
Registry, retraction, Cites and statistics results are computed, not judged, with one exception: a printed reference that no index lists is read once by a model before it counts as a citation error. Claims are extracted by a model and kept only when their quote appears verbatim in the text; each cited source is then checked, with a model’s help, for whether it says what the claim relies on. Those verdicts can be wrong — read the claim’s quote and the cited source before relying on one.
Statistics and arithmetic are recomputed, not judged.
Confidence bands are shown only for fields calibrated on our annotated test set. None is calibrated yet, so no band is shown.
What counts as a claim ›How we measure confidence ›How we check this ›
Are you an author, or do you see a problem with this page? Request a review
