

The DOI matches its Crossref record.
Novel genotype–phenotype associations demonstrated by high-throughput sequencing in patients with hypertrophic cardiomyopathy
Abstract
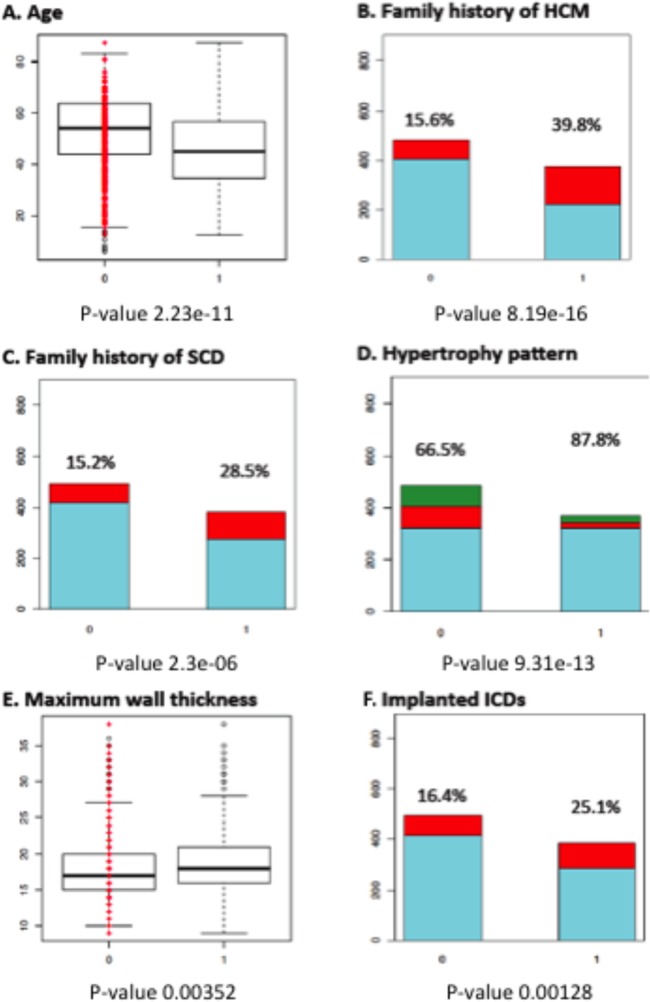
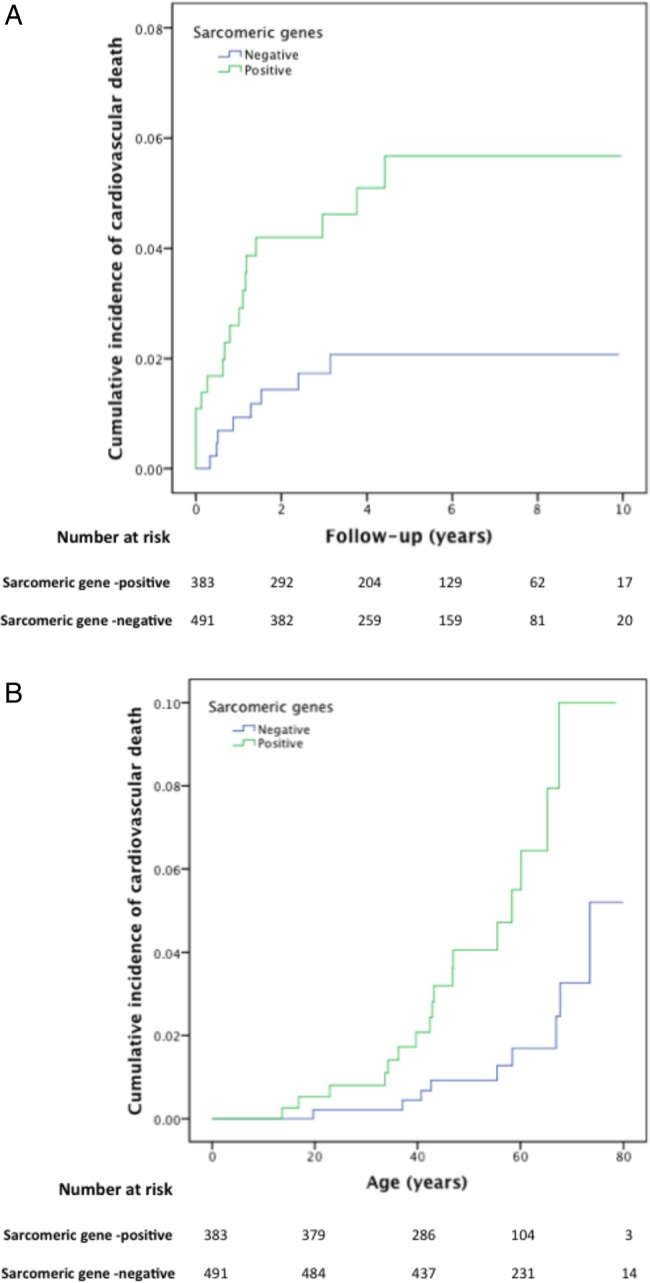
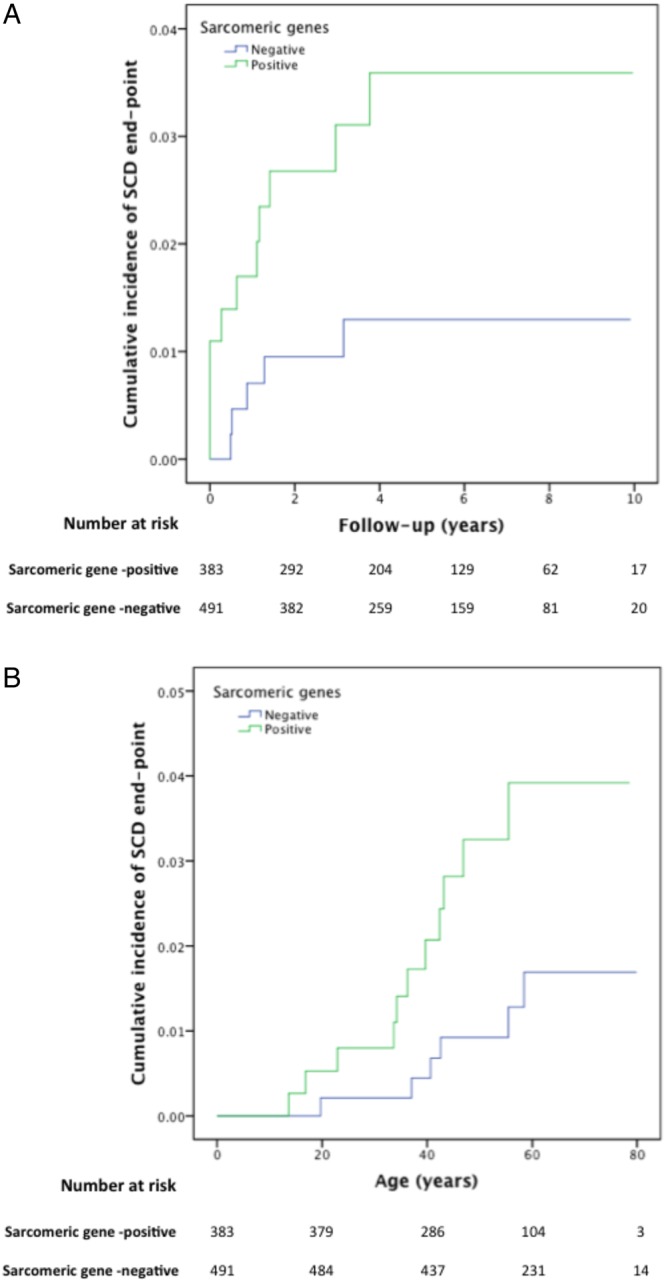
Objective: A predictable relation between genotype and disease expression is needed in order to use genetic testing for clinical decision-making in hypertrophic cardiomyopathy (HCM). The primary aims of this study were to examine the phenotypes associated with sarcomere protein (SP) gene mutations and test the hypothesis that variation in non-sarcomere genes modifies the phenotype. Methods: Unrelated and consecutive patients were clinically evaluated and prospectively followed in a specialist clinic. High-throughput sequencing was used to analyse 41 genes implicated in inherited cardiac conditions. Variants in SP and non-SP genes were tested for associations with phenotype and survival. Results: 874 patients (49.6±15.4 years, 67.8% men) were studied; likely disease-causing SP gene variants were detected in 383 (43.8%). Patients with SP variants were characterised by younger age and higher prevalence of family history of HCM, family history of sudden cardiac death, asymmetric septal hypertrophy, greater maximum LV wall thickness (all p values<0.0005) and an increased incidence of cardiovascular death (p=0.012). Similar associations were observed for individual SP genes. Patients with ANK2 variants had greater maximum wall thickness (p=0.0005). Associations at a lower level of significance were demonstrated with variation in other non-SP genes. Conclusions: Patients with HCM caused by rare SP variants differ with respect to age at presentation, family history of the disease, morphology and survival from patients without SP variants. Novel associations for SP genes are reported and, for the first time, we demonstrate possible influence of variation in non-SP genes associated with other forms of cardiomyopathy and arrhythmia syndromes on the clinical phenotype of HCM.
Overview
The claims and statistics of this paper haven’t been checked yet.
Run the check — free, no account needed. It reads the open-access text and checks the sources it cites.
Integrity signals
Registry
Cites
Statistics
Figures
Verification
Claims the paper makes
The claims and statistics of this paper haven’t been checked yet.
Run the check — free, no account needed. It reads the open-access text and checks the sources it cites.
Claims other papers make about this one
Each is checked against this paper’s own text: does it say what the citing paper says it does?
The cited source says what the claim attributes to it.
In the citing paper
“better outcomes by multiple metrics”
From Current management of hypertrophic cardiomyopathy (2025) · cites this paper as [73]
The cited source says what the claim attributes to it.
In the citing paper
“patients with gene elusive hypertrophic cardiomyopathy tend to present at later ages than their genotype positive counterparts”
From Current management of hypertrophic cardiomyopathy (2025) · cites this paper as [73]
The cited source says what the claim attributes to it.
In the citing paper
“a lower rate of family history of hypertrophic cardiomyopathy”
From Current management of hypertrophic cardiomyopathy (2025) · cites this paper as [73]
The cited source says what the claim attributes to it.
In the citing paper
“have milder disease”
From Current management of hypertrophic cardiomyopathy (2025) · cites this paper as [73]
Self-check
Percentages, sums and reported differences re-computed from the paper’s own numbers.
The self-check needs the paper’s full text.
Citations
Cites
No references could be resolved yet.
Research works printed but not linked: 30
- 10.1016/S0140-6736(04)16358-7 · DOI
- 10.1016/j.jacc.2011.06.011 · DOI · Paper page
- 10.1093/eurheartj/ehq271 · DOI
- 10.1016/j.jacc.2012.02.068 · DOI
- 10.4065/83.6.630 · DOI
- 10.1136/heartjnl-2013-303939 · DOI
- Watkins, 1998, Genotype: phenotype correlations in hypertrophic cardiomyopathy, Eur Heart J, 19, 10
- 10.1016/S0735-1097(02)01900-9 · DOI
- 10.1161/01.CIR.0000042675.59901.14 · DOI
- 10.1053/euhj.1997.0575 · DOI
- 10.1161/01.CIR.97.22.2230 · DOI
- 10.1016/S0735-1097(96)00530-X · DOI
- 10.1016/j.jacc.2004.07.045 · DOI
- 10.1161/CIRCGENETICS.111.959973 · DOI
- 10.1161/CIRCGENETICS.111.960831 · DOI
- 10.1016/j.jacc.2004.04.039 · DOI
- 10.1093/hmg/ddm202 · DOI · Paper page
- 10.1038/ejhg.2012.48 · DOI
- 10.1136/jmedgenet-2012-101270 · DOI
- 10.1016/S0735-1097(00)01003-2 · DOI
- 10.1093/eurheartj/ehm342 · DOI
- 10.1136/hrt.77.2.130 · DOI
- 10.1136/heartjnl-2012-303271 · DOI
- 10.1038/ng.806 · DOI
- 10.1016/j.ajhg.2011.03.004 · DOI
- 10.1038/ncpcardio1110 · DOI
- 10.1016/j.jacc.2009.11.062 · DOI
- 10.1016/j.hrthm.2009.09.070 · DOI
- 10.1161/CIRCULATIONAHA.111.060343 · DOI
- 10.1016/j.yjmcc.2009.04.010 · DOI
Cited by
Sorted by citations
Current management of hypertrophic cardiomyopathy
Sikand, N., Stendahl, J., Sen, S., Lampert, R., & Day, S. (2025) · BMJ · doi:10.1136/bmj-2023-077274 · Cited by 26
Metadata
- Authors
- Lopes, L. R., Syrris, P., Guttmann, O. P., O'Mahony, C., Tang, H. C., Dalageorgou, C., Jenkins, S., Hubank, M., Monserrat, L., McKenna, W. J., Plagnol, V., & Elliott, P. M.
- Venue
- Heart
- Publisher
- BMJ
- Published
- 2014-10-28
- Volume
- 101
- Issue
- 4
- Pages
- 294-301
- ISSN
- 1355-6037
- 1468-201X
- PMC
- PMC4345808
- Cited by
- 162
- References
- 0
- Language
- en
About these checks
Registry, retraction, Cites and statistics results are computed, not judged, with one exception: a printed reference that no index lists is read once by a model before it counts as a citation error. Claims are extracted by a model and kept only when their quote appears verbatim in the text; each cited source is then checked, with a model’s help, for whether it says what the claim relies on. Those verdicts can be wrong — read the claim’s quote and the cited source before relying on one.
Statistics and arithmetic are recomputed, not judged.
Confidence bands are shown only for fields calibrated on our annotated test set. None is calibrated yet, so no band is shown.
What counts as a claim ›How we measure confidence ›How we check this ›
Are you an author, or do you see a problem with this page? Request a review
