

The DOI matches its Crossref record; 1 of the 1 references it cites were found in a registry or an index.
Expression of MicroRNAs in the Urinary Sediment of Patients with IgA Nephropathy
Abstract
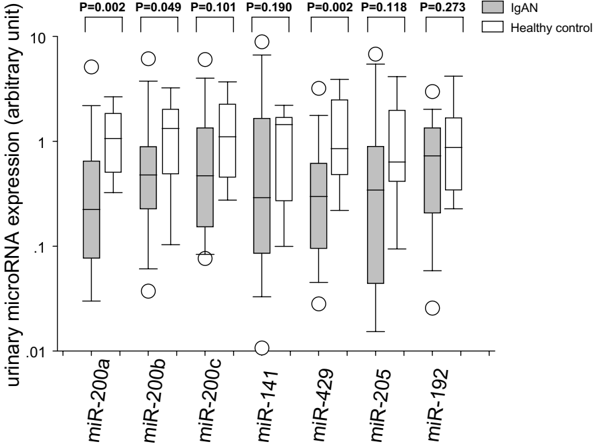
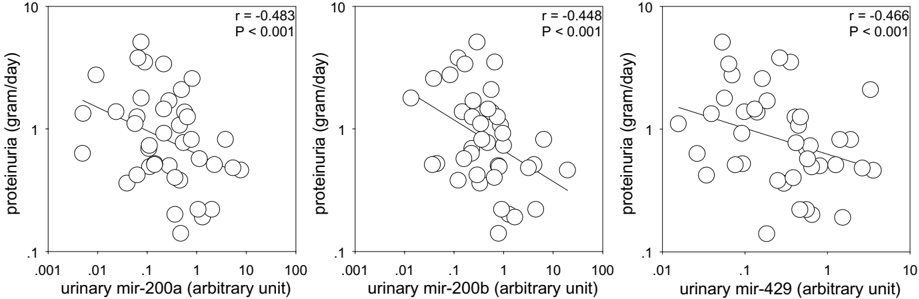
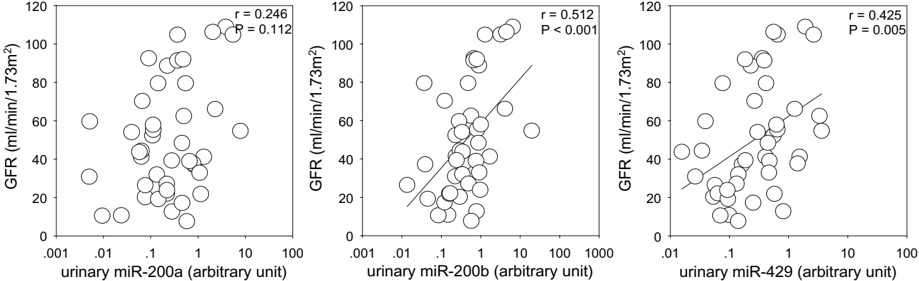
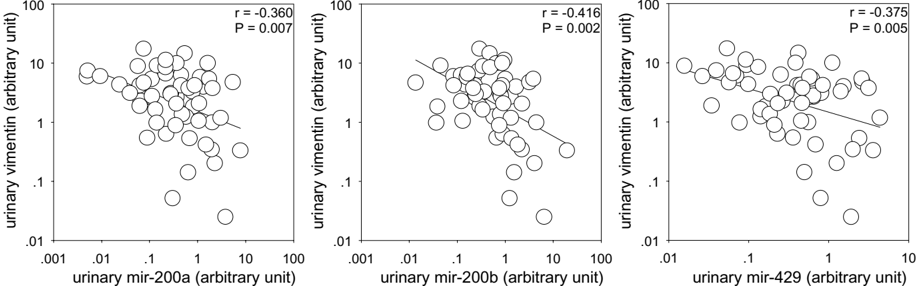
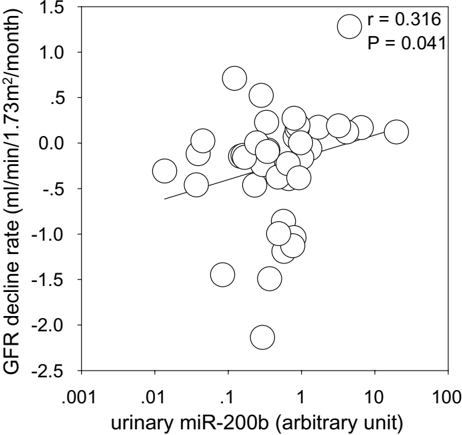
Background:Micro-RNAs (miRNAs) regulate one-third of all protein-coding genes and are fundamental in the pathophysiology of a wide range of diseases. We studied the expression of several miRNA species (miR-200 family, miR-205 and miR-192) in the urinary sediment of patients with IgA nephropathy (IgAN). Methods:We studied 43 patients with biopsy-proven IgAN. Urinary expression of miRNAs was determined and compared to that from 13 healthy controls. Results:The levels of urinary miR-200a, miR-200b and miR-429, but not miR-200c, miR-141, miR-205, or miR-192, were down-regulated in patients with IgAN. Proteinuria significantly correlated with urinary expression of miR-200a (r= −0.483,P< 0.001), miR-200b (r= −0.448,P= 0.001) and miR-429 (r= −0.466,P= 0.001). Baseline renal function significantly correlated with urinary expression of miR-200b (r= 0.512,P< 0.001) and miR-429 (r= 0.425, P = 0.005). Urinary gene expression of ZEB2 inversely correlated with miR-200b (r= −0.321,P= 0.017); and vimentin expression inversely correlated with that of miR-200a (r= −0.360,P= 0.007), miR-200b (r= −0.416,P= 0.002) and miR-429 (r= −0.375,P= 0.005). After 33.4 ± 12.6 months, the rate of renal function decline significantly correlated with urinary expression of miR-200b (r= 0.316,P= 0.034). Conclusions:Urinary expression of miR-200a, miR-200b and miR-429 were down-regulated in patients with IgAN, and the degree of reduction correlated with disease severity and rate of progression. The results suggested that these miRNA species might play important roles in the pathophysiology of IgAN. Further studies are needed to clarify the role of urinary miRNA repression as a non-invasive marker of IgAN.
Overview
The claims and statistics of this paper haven’t been checked yet.
Run the check — free, no account needed. It reads the open-access text and checks the sources it cites.
Integrity signals
Registry
Cites
Statistics
Figures














Verification
Claims the paper makes
The claims and statistics of this paper haven’t been checked yet.
Run the check — free, no account needed. It reads the open-access text and checks the sources it cites.
Claims other papers make about this one
Each is checked against this paper’s own text: does it say what the citing paper says it does?
In the citing paper
“Some investigators have already carried out several useful attempts45, but these attempts still lack specific urinary sediment miRNAs for the diagnosis of IgAN.”
From Selection of urinary sediment miRNAs as specific biomarkers of IgA nephropathy (2016) · cites this paper as [4]
Self-check
Percentages, sums and reported differences re-computed from the paper’s own numbers.
The self-check needs the paper’s full text.
Citations
Cites
Protein biomarker discovery and validation: the long and uncertain path to clinical utility
Rifai, N., Gillette, M. A., & Carr, S. A. (2006) · Nature Biotechnology · doi:10.1038/nbt1235 · Cited by 1,867
Research works printed but not linked: 4
- H.T. Cook, Interpretation of renal biopsies in IgA nephropathy, Contrib Nephrol 157 (2007), 44-49.
- B. Julian, R. Wyatt, K. Matousovic, Z. Moldoveanu, J. Mestecky and J. Novak, IgA Nephropathy: A Clinical Overview, Tomino Y (ed): IgA Nephropathy Today Contrib Nephrol Basel, Karger 157 (2007), 19-26.
- E.L. Paterson, N. Kolesnikoff, P.A. Gregory, A.G. Bert, Y. Khew-Goodall and G.J. Goodall, The microRNA-200 fami- ly regulates epithelial to mesenchymal transition, Scientific- WorldJournal 8 (2008), 901-904.
- W. Mitch, Measuring the rate of progression of renal insuffi- ciency, in: The Progressive Nature of Renal Disease, edited by W.E. Mitch, J. Stein and B.M. Brenner, New York, Churchill Livingstone Inc, 1986, pp. 203-220.
Cited by
Sorted by citations
Selection of urinary sediment miRNAs as specific biomarkers of IgA nephropathy
Duan, Z.-Y., Cai, G.-Y., Bu, R., Lu, Y., Hou, K., & Chen, X.-M. (2016) · Scientific Reports · doi:10.1038/srep23498 · Cited by 61
Metadata
- Authors
- Wang, G., Kwan, B. C.-H., Lai, F. M.-M., Chow, K.-M., Kam-Tao Li, P., & Szeto, C.-C.
- Affiliations
- Department of Medicine & Therapeutics, Prince of Wales Hospital, The Chinese University of Hong Kong, Shatin, Hong Kong, China
- Department of Anatomical & Cellular Pathology, Prince of Wales Hospital, The Chinese University of Hong Kong, Shatin, Hong Kong, China
- Venue
- Disease Markers
- Publisher
- Wiley
- Published
- 2010
- Volume
- 28
- Issue
- 2
- Pages
- 79-86
- ISSN
- 0278-0240
- 1875-8630
- Cited by
- 85
- References
- 1
- Language
- en
- Funders
- The Chinese University of Hong Kong (6901031, 8500008)
About these checks
Registry, retraction, Cites and statistics results are computed, not judged, with one exception: a printed reference that no index lists is read once by a model before it counts as a citation error. Claims are extracted by a model and kept only when their quote appears verbatim in the text; each cited source is then checked, with a model’s help, for whether it says what the claim relies on. Those verdicts can be wrong — read the claim’s quote and the cited source before relying on one.
Statistics and arithmetic are recomputed, not judged.
Confidence bands are shown only for fields calibrated on our annotated test set. None is calibrated yet, so no band is shown.
What counts as a claim ›How we measure confidence ›How we check this ›
Are you an author, or do you see a problem with this page? Request a review
