

The DOI matches its Crossref record; 46 of the 46 references it cites were found in a registry or an index.
Neuroprotective Effects of Clostridium butyricum against Vascular Dementia in Mice via Metabolic Butyrate
Open accessAbstract
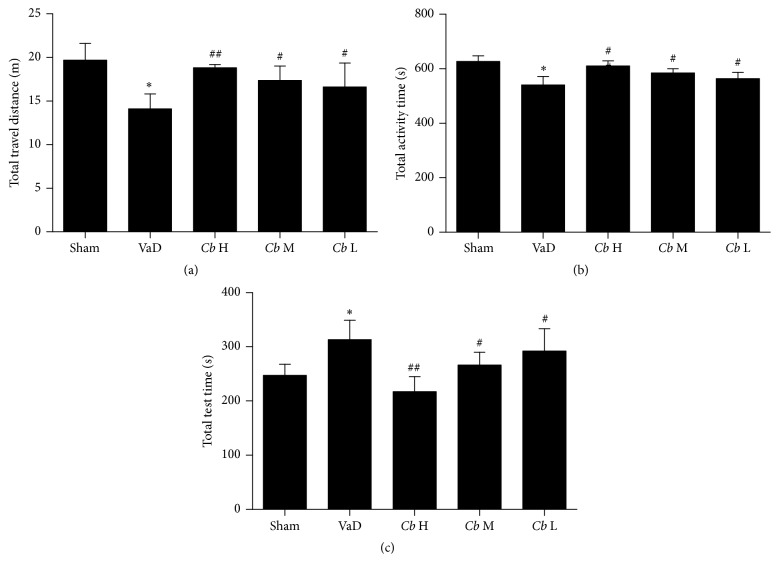
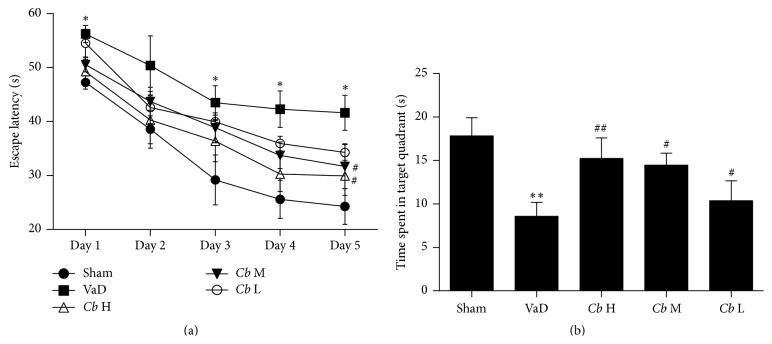
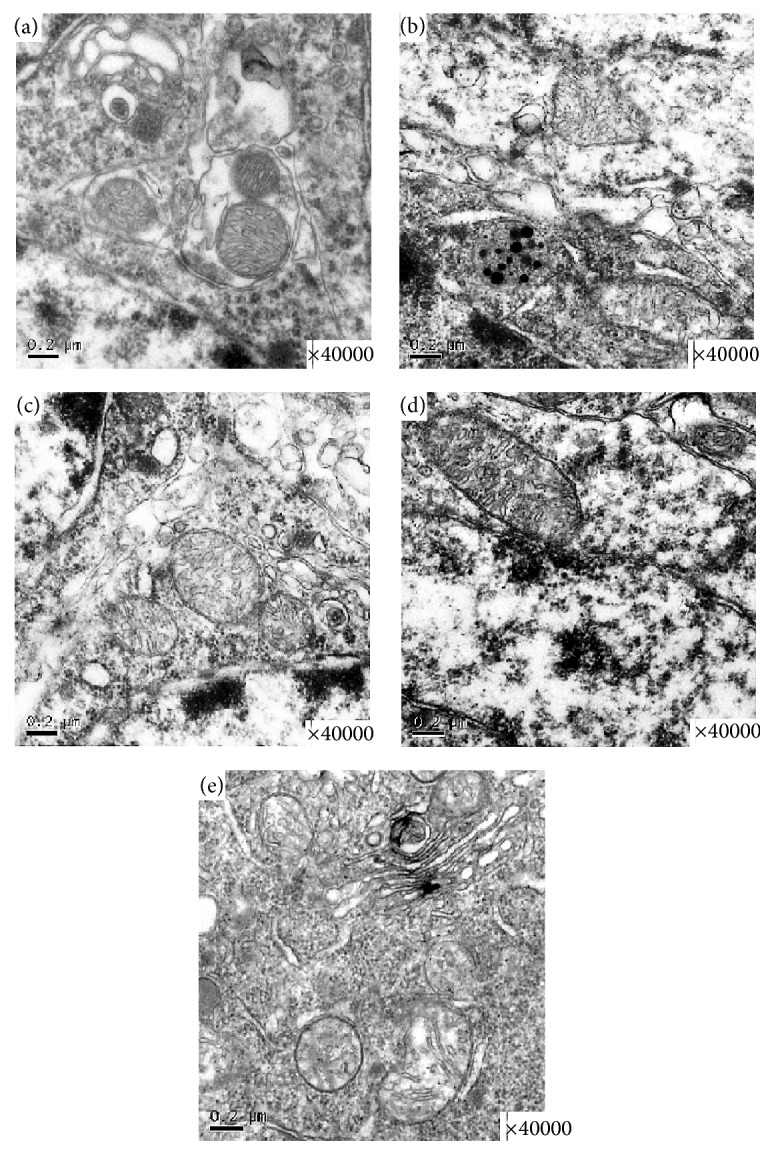
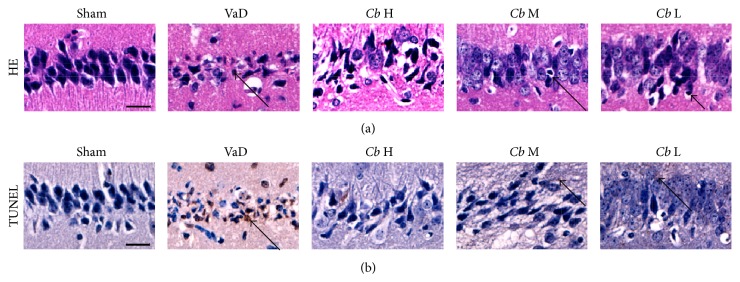
Probiotics actively participate in neuropsychiatric disorders. However, the role of gut microbiota in brain disorders and vascular dementia (VaD) remains unclear. We used a mouse model of VaD induced by a permanent right unilateral common carotid arteries occlusion (rUCCAO) to investigate the neuroprotective effects and possible underlying mechanisms of Clostridium butyricum. Following rUCCAO, C. butyricum was intragastrically administered for 6 successive weeks. Cognitive function was estimated. Morphological examination was performed by electron microscopy and hematoxylin-eosin (H&E) staining. The BDNF-PI3K/Akt pathway-related proteins were assessed by western blot and immunohistochemistry. The diversity of gut microbiota and the levels of butyrate in the feces and the brains were determined. The results showed that C. butyricum significantly attenuated the cognitive dysfunction and histopathological changes in VaD mice. C. butyricum not only increased the levels of BDNF and Bcl-2 and decreased level of Bax but also induced Akt phosphorylation (p-Akt) and ultimately reduced neuronal apoptosis. Moreover, C. butyricum could regulate the gut microbiota and restore the butyrate content in the feces and the brains. These results suggest that C. butyricum might be effective in the treatment of VaD by regulating the gut-brain axis and that it can be considered a new therapeutic strategy against VaD.
Overview
The claims and statistics of this paper haven’t been checked yet.
Run the check — free, no account needed. It reads the open-access text and checks the sources it cites.
Integrity signals
Registry
Cites
Statistics
Figures
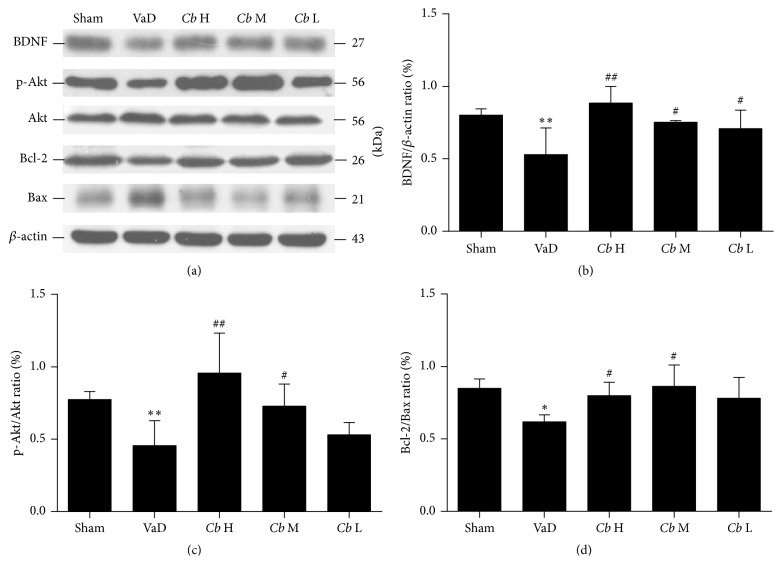
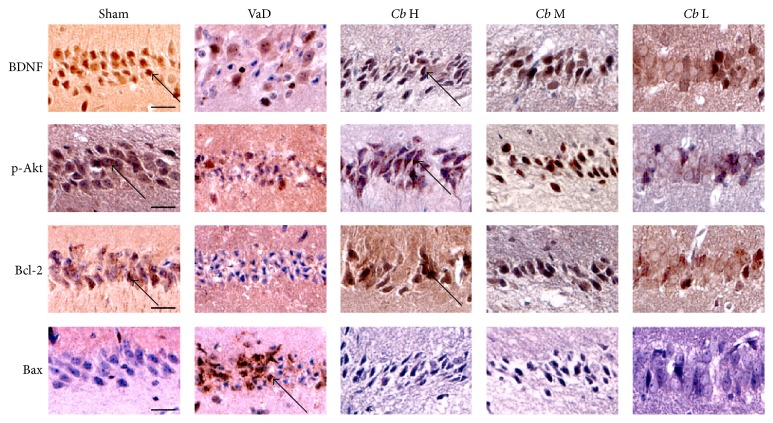
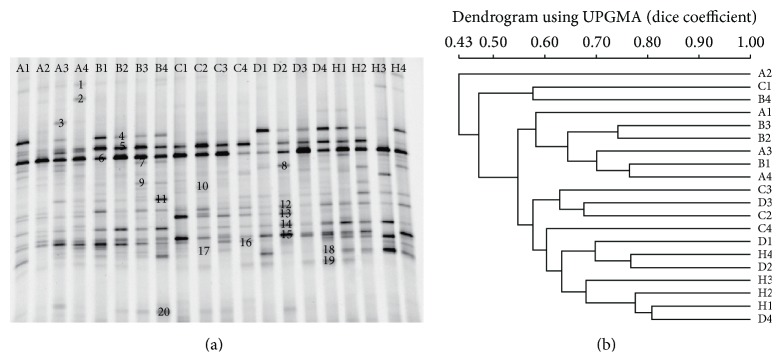
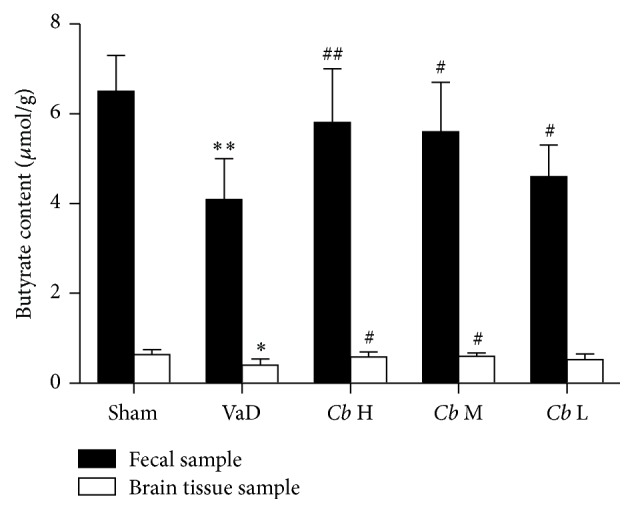
Verification
Claims the paper makes
The claims and statistics of this paper haven’t been checked yet.
Run the check — free, no account needed. It reads the open-access text and checks the sources it cites.
Claims other papers make about this one
Each is checked against this paper’s own text: does it say what the citing paper says it does?
The source backs part of the claim, not all of it — or backs it for a different population, condition or comparison.
In the citing paper
“the levels of butyrate in the brain of mice supplemented with live Clostridium butyricum reached a range from 0.4 to 0.7 μmol/g, which was about an order of magnitude higher than concentrations reported in peripheral blood (96, 97).”
From The Role of Short-Chain Fatty Acids From Gut Microbiota in Gut-Brain Communication (2020) · cites this paper as [96]
Experimental — accuracy not yet measuredIn the citing paper
“Six weeks of administration with the probiotic Clostridium butyricum restored cognitive function in a mouse model for vascular dementia, which was associated with increased butyrate levels in fecal and brain samples, and activation of the hippocampal BDNF-PI3K/Akt pathway (392).”
From Signalling cognition: The gut microbiota and hypothalamic-pituitary-adrenal axis (2023) · cites this paper as [392]
In the citing paper
“In a study by Liu et al., administration of the SCFA butyrate improved cognitive impairments in a mouse model of vascular dementia (392).”
From Signalling cognition: The gut microbiota and hypothalamic-pituitary-adrenal axis (2023) · cites this paper as [392]
Self-check
Percentages, sums and reported differences re-computed from the paper’s own numbers.
The self-check needs the paper’s full text.
Citations
Cites
1 retracted
Harada, S., Fujita‐Hamabe, W., & Tokuyama, S. (2011) · Journal of Pharmacological Sciences · doi:10.1254/jphs.11164fp · Cited by 23
RetractedMuyzer, G., de Waal, E. C., & Uitterlinden, A. G. (1993) · Applied and Environmental Microbiology · doi:10.1128/aem.59.3.695-700.1993 · Cited by 11,490
Mind-altering microorganisms: the impact of the gut microbiota on brain and behaviour
Cryan, J. F., & Dinan, T. G. (2012) · Nature Reviews Neuroscience · doi:10.1038/nrn3346 · Cited by 4,572
Bravo, J. A., Forsythe, P., Chew, M. V., Escaravage, E., Savignac, H. M., Dinan, T. G., Bienenstock, J., & Cryan, J. F. (2011) · Proceedings of the National Academy of Sciences · doi:10.1073/pnas.1102999108 · Cited by 3,888
Hsiao, E. Y., McBride, S. W., Hsien, S., Sharon, G., Hyde, E. R., McCue, T., Codelli, J. A., Chow, J., Reisman, S. E., Petrosino, J. F., et al. (2013) · Cell · doi:10.1016/j.cell.2013.11.024 · Cited by 3,283
Normal gut microbiota modulates brain development and behavior
Heijtz, R. D., Wang, S., Anuar, F., Qian, Y., Björkholm, B., Samuelsson, A., Hibberd, M. L., Forssberg, H., & Pettersson, S. (2011) · Proceedings of the National Academy of Sciences · doi:10.1073/pnas.1010529108 · Cited by 3,228
Microbiota-Generated Metabolites Promote Metabolic Benefits via Gut-Brain Neural Circuits
De Vadder, F., Kovatcheva-Datchary, P., Goncalves, D., Vinera, J., Zitoun, C., Duchampt, A., Bäckhed, F., & Mithieux, G. (2014) · Cell · doi:10.1016/j.cell.2013.12.016 · Cited by 2,200
Effects of Dietary Fiber and Its Components on Metabolic Health
Lattimer, J. M., & Haub, M. D. (2010) · Nutrients · doi:10.3390/nu2121266 · Cited by 1,333
Brain-gut-microbe communication in health and disease
Grenham, S., Clarke, G., Cryan, J. F., & Dinan, T. G. (2011) · Frontiers in Physiology · doi:10.3389/fphys.2011.00094 · Cited by 952
Bacterial infection causes stress-induced memory dysfunction in mice
Gareau, M. G., Wine, E., Rodrigues, D. M., Cho, J. H., Whary, M. T., Philpott, D. J., MacQueen, G., & Sherman, P. M. (2011) · Gut · doi:10.1136/gut.2009.202515 · Cited by 909 · cited 1×
“Commensal microbes play critical roles in brain health and disease [9], and dysbiosis may contribute to depression and anxiety [10, 11].”
Background
Research works printed but not linked: 2
- 2015, International Journal of Clinical and Experimental Pathology, 8, 4695
- 2010, Gastroenterology & Hepatology, 6, 39
Cited by
Sorted by citations
Cryan, J. F., O'Riordan, K. J., Cowan, C. S. M., Sandhu, K. V., Bastiaanssen, T. F. S., Boehme, M., Codagnone, M. G., Cussotto, S., Fulling, C., Golubeva, A. V., et al. (2019) · Physiological Reviews · doi:10.1152/physrev.00018.2018 · Cited by 5,286
The role of short-chain fatty acids in microbiota–gut–brain communication
Dalile, B., Van Oudenhove, L., Vervliet, B., & Verbeke, K. (2019) · Nature Reviews Gastroenterology & Hepatology · doi:10.1038/s41575-019-0157-3 · Cited by 3,357
The Role of Short-Chain Fatty Acids From Gut Microbiota in Gut-Brain Communication
Silva, Y. P., Bernardi, A., & Frozza, R. L. (2020) · Frontiers in Endocrinology · doi:10.3389/fendo.2020.00025 · Cited by 3,043
“an order of magnitude higher than concentrations reported in peripheral blood (96, 97).”
BackgroundThe central nervous system and the gut microbiome
Sharon, G., Sampson, T. R., Geschwind, D. H., & Mazmanian, S. K. (2016) · Cell · doi:10.1016/j.cell.2016.10.027 · Cited by 1,513
Microbial Regulation of Host Physiology by Short-chain Fatty Acids
van der Hee, B., & Wells, J. M. (2021) · Trends in Microbiology · doi:10.1016/j.tim.2021.02.001 · Cited by 1,013
Metadata
- Authors
- Liu, J., Sun, J., Wang, F., Yu, X., Ling, Z., Li, H., Zhang, H., Jin, J., Chen, W., Pang, M., Yu, J., He, Y., & Xu, J.
- Affiliations
- Wenzhou Medical University (CN)
- School of Environmental Science and Public Health, Wenzhou Medical University, Wenzhou, Zhejiang 325035, China
- First Affiliated Hospital Zhejiang University (CN)
- Xi'an Jiaotong University (CN)
- Corresponding author
- Xu, Jiru
- ORCID
- Venue
- BioMed Research International
- Publisher
- Wiley
- Published
- 2015
- Volume
- 2015
- Pages
- 1-12
- ISSN
- 1110-7243 (ISSN-L)
- 2314-6133
- 2314-6141
- PMC
- PMC4615854
- OpenAlex
- W2114102190
- Cited by
- 225
- References
- 46
- Citations by year
- 2026: 15 · 2025: 22 · 2024: 26 · 2023: 33 · 2022: 32 · 2021: 24 · 2020: 25 · 2019: 21 · 2018: 14 · 2017: 5 · 2016: 7 · 2015: 1
- FWCI
- 4.81
- Type
- journal article
- Language
- en
- Open access
- hybrid
- doi.org
- Locations
- BioMed Research International (publishedVersion, cc-by)
- PubMed Central (publishedVersion, cc-by)
- PubMed (publishedVersion)
- DOAJ (DOAJ: Directory of Open Access Journals) (submittedVersion, cc-by-sa)
- Funders
- Zhejiang Science and Technology Development Funds (2015C37090, LY13B070012)
- Natural Science Foundation of Zhejiang Province (2015C37090, LY13B070012)
- Topics
- Life Sciences › Neuroscience › Neurology › Neurological Disease Mechanisms and Treatments
- Life Sciences › Biochemistry, Genetics and Molecular Biology › Molecular Biology › Gut microbiota and health
- Life Sciences › Agricultural and Biological Sciences › Food Science › Probiotics and Fermented Foods
- Keywords
- Clostridium butyricum, vascular dementia, butyrate, gut microbiota, gut-brain axis, neuroprotection, cognitive impairment, neuronal apoptosis, brain-derived neurotrophic factor, PI3K/Akt signaling, carotid artery occlusion, probiotics
- MeSH terms
- Animals, Brain, Butyrates, Carotid Arteries, Disease Models, Animal, Hippocampus, Immunohistochemistry, Male, Mice, Inbred ICR, Microscopy, Electron, Phosphorylation, Dementia, Vascular, Apoptosis, Neuroprotective Agents, Brain-Derived Neurotrophic Factor, Phosphatidylinositol 3-Kinases, Probiotics, Clostridium butyricum, Mice
About these checks
Registry, retraction, Cites and statistics results are computed, not judged, with one exception: a printed reference that no index lists is read once by a model before it counts as a citation error. Claims are extracted by a model and kept only when their quote appears verbatim in the text; each cited source is then checked, with a model’s help, for whether it says what the claim relies on. Those verdicts can be wrong — read the claim’s quote and the cited source before relying on one.
Statistics and arithmetic are recomputed, not judged.
Confidence bands are shown only for fields calibrated on our annotated test set. None is calibrated yet, so no band is shown.
What counts as a claim ›How we measure confidence ›How we check this ›
Are you an author, or do you see a problem with this page? Request a review
