

The DOI matches its Crossref record; 53 of the 54 references it cites were found in a registry or an index.
The Influence of Aging on the Regenerative Potential of Human Adipose Derived Mesenchymal Stem Cells
Open accessAbstract
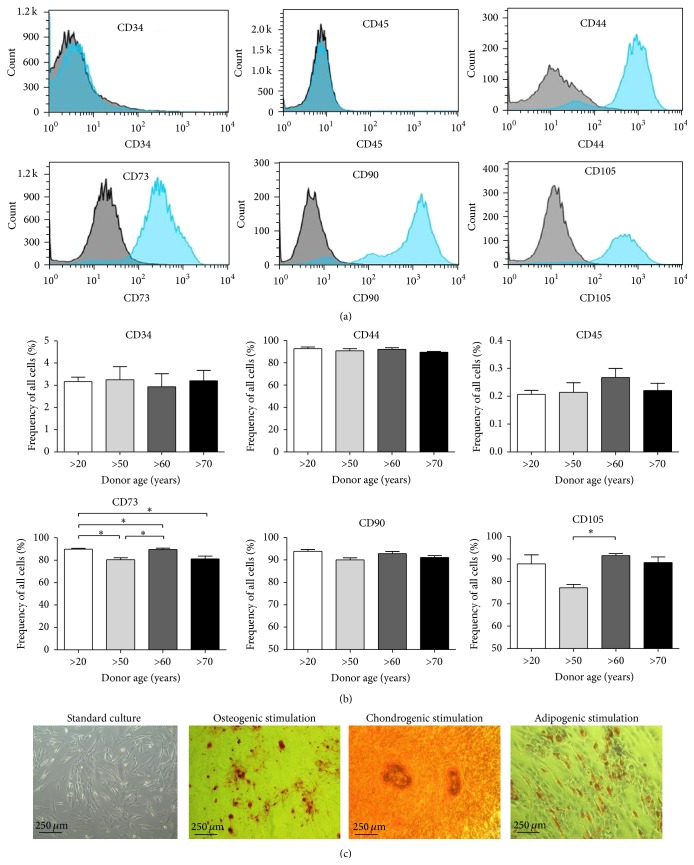
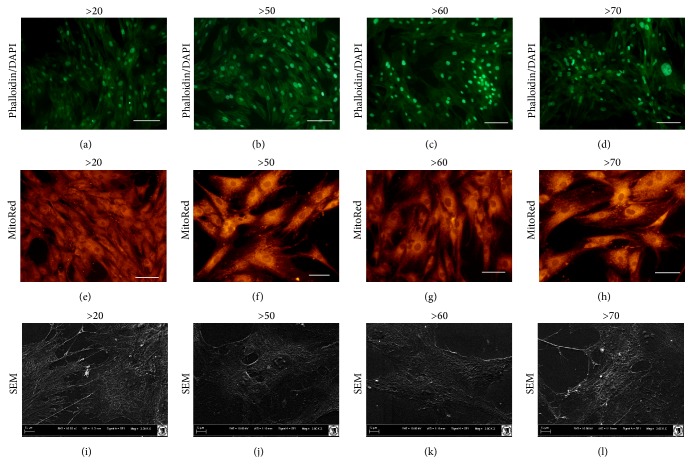
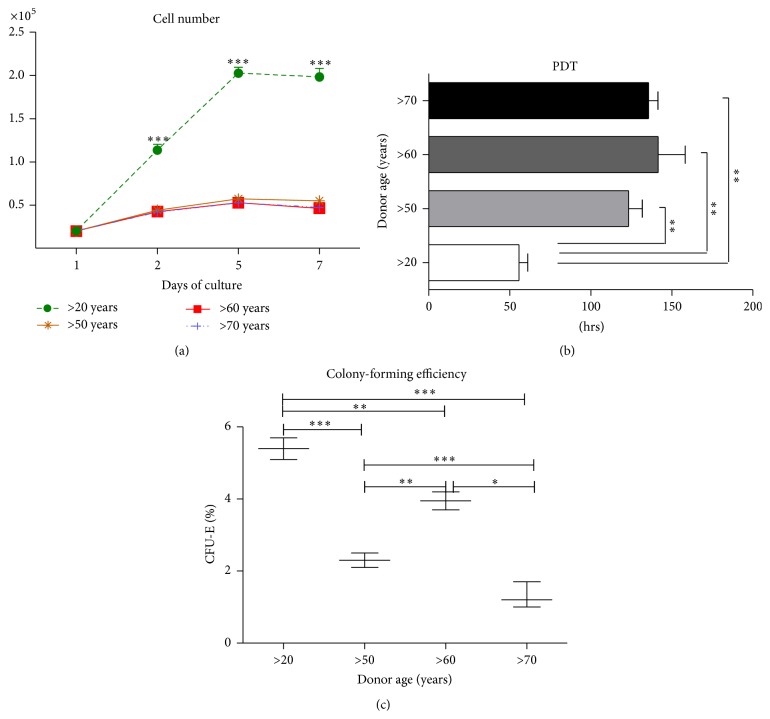
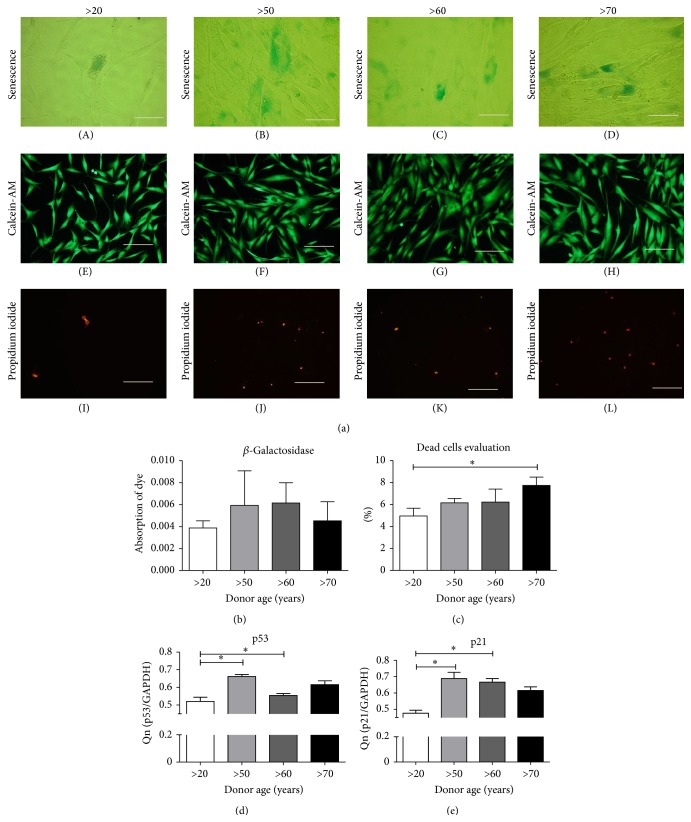
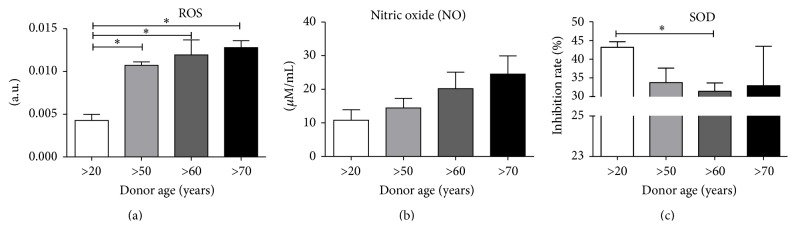
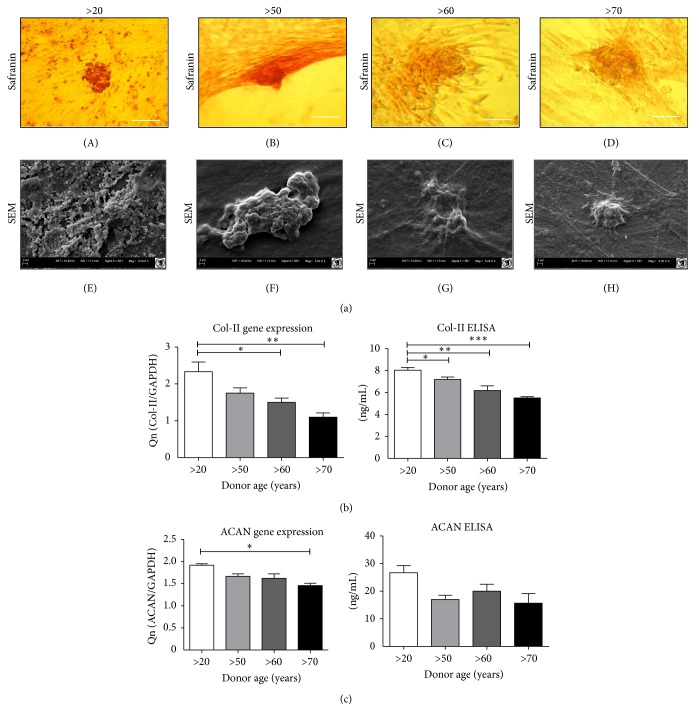
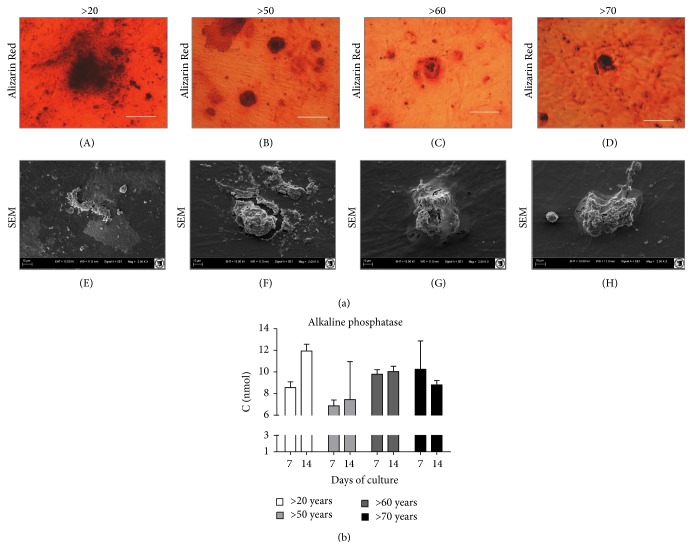
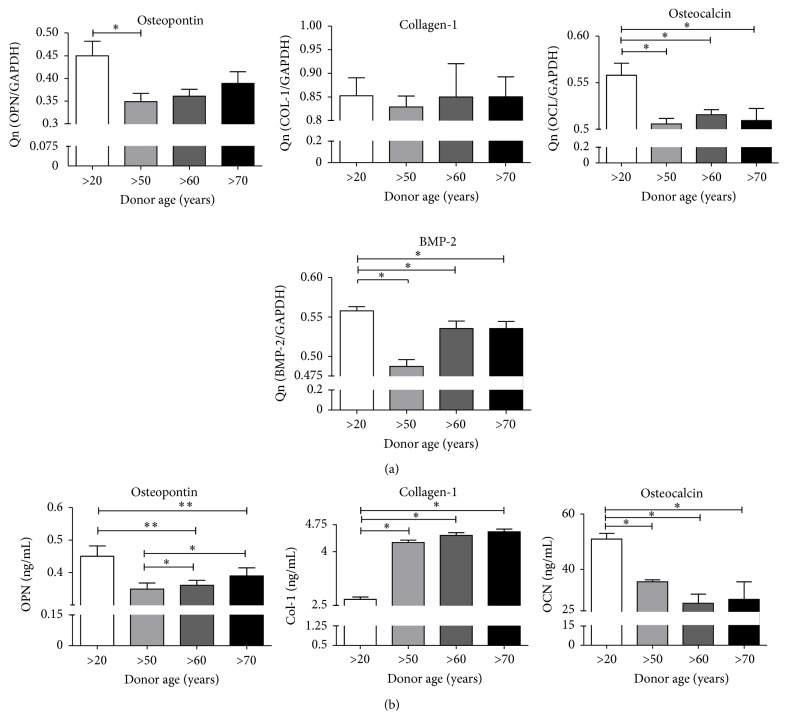
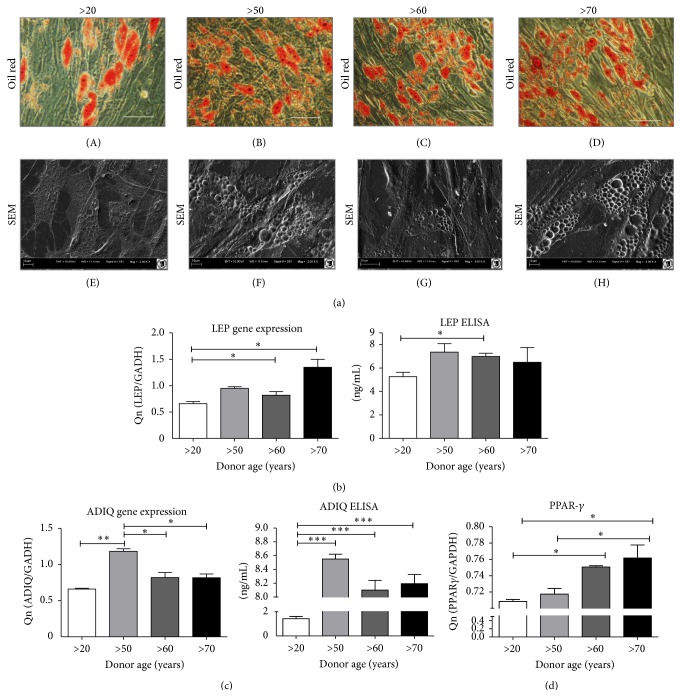
Tissue regeneration using human adipose derived mesenchymal stem cells (hASCs) has significant potential as a novel treatment for many degenerative bone and joint diseases. Previous studies have established that age negatively affects the proliferation status and the osteogenic and chondrogenic differentiation potential of mesenchymal stem cells. The aim of this study was to assess the age‐related maintenance of physiological function and differentiation potential of hASCs in vitro. hASCs were isolated from patients of four different age groups: (1) >20 years ( n = 7), (2) >50 years ( n = 7), (3) >60 years ( n = 7), and (4) >70 years ( n = 7). The hASCs were characterized according to the number of fibroblasts colony forming unit (CFU‐F), proliferation rate, population doubling time (PDT), and quantified parameters of adipogenic, chondrogenic, and osteogenic differentiation. Compared to younger cells, aged hASCs had decreased proliferation rates, decreased chondrogenic and osteogenic potential, and increased senescent features. A shift in favor of adipogenic differentiation with increased age was also observed. As many bone and joint diseases increase in prevalence with age, it is important to consider the negative influence of age on hASCs viability, proliferation status, and multilineage differentiation potential when considering the potential therapeutic applications of hASCs.
Overview
The claims and statistics of this paper haven’t been checked yet.
Run the check — free, no account needed. It reads the open-access text and checks the sources it cites.
Integrity signals
Registry
Cites
Statistics
Figures
Verification
Claims the paper makes
The claims and statistics of this paper haven’t been checked yet.
Run the check — free, no account needed. It reads the open-access text and checks the sources it cites.
Claims other papers make about this one
Each is checked against this paper’s own text: does it say what the citing paper says it does?
The source backs part of the claim, not all of it — or backs it for a different population, condition or comparison.
In the citing paper
“MSCs derived from older individuals or those with underlying health conditions, such as HBV infection, may exhibit impaired proliferative, differentiation, and regenerative capacities, leading to ineffective treatments or unfavorable clinical outcomes [315, 316].”
From Mechanisms, efficacy, and future perspectives of cellular-based therapies for liver fibrosis/cirrhosis: focusing on mesenchymal stromal cells (2025) · cites this paper as [315]
Experimental — accuracy not yet measured
Self-check
Percentages, sums and reported differences re-computed from the paper’s own numbers.
The self-check needs the paper’s full text.
Citations
Cites
Single-Step Method of RNA Isolation by Acid Guanidinium Thiocyanate–Phenol–Chloroform Extraction
Chomczynski, P., & Sacchi, N. (1987) · Analytical Biochemistry · doi:10.1006/abio.1987.9999 · Cited by 65,515
Human Adipose Tissue Is a Source of Multipotent Stem Cells
Zuk, P. A., Zhu, M., Ashjian, P. H., Ugarte, D. A. D., Huang, J. I., Mizuno, H., Alfonso, Z. C., Fraser, J. K., Benhaim, P., & Hedrick, M. H. (2002) · Molecular Biology of the Cell · doi:10.1091/mbc.e02-02-0105 · Cited by 6,762
Stöckl, S., Göttl, C., Grifka, J. K., & Grässel, S. (2013) · Cellular Physiology and Biochemistry · doi:10.1159/000350089 · Cited by 4,670
Kern, S., Eichler, H., Stoeve, J., Klüter, H., & Bieback, K. (2006) · STEM CELLS · doi:10.1634/stemcells.2005-0342 · Cited by 3,370
Epidemiology of Osteoarthritis
Zhang, Y., & Jordan, J. M. (2010) · Clinics in Geriatric Medicine · doi:10.1016/j.cger.2010.03.001 · Cited by 2,320
Osteoarthritis: an update with relevance for clinical practice
Bijlsma, J. W. J., Berenbaum, F., & Lafeber, F. P. J. G. (2011) · The Lancet · doi:10.1016/s0140-6736(11)60243-2 · Cited by 2,301
Four faces of cellular senescence
Rodier, F., & Campisi, J. (2011) · Journal of Cell Biology · doi:10.1083/jcb.201009094 · Cited by 2,070 · cited 1×
“A reduction in proliferation rate and viability of cells might be ultimately reflected in cell senescence and apoptosis [39].”
Bone regeneration: current concepts and future directions
Dimitriou, R. I., Jones, E., McGonagle, D., & Giannoudis, P. V. (2011) · BMC Medicine · doi:10.1186/1741-7015-9-66 · Cited by 2,024
Wagner, W., Wein, F., Seckinger, A., Frankhauser, M., Wirkner, U., Krause, U., Blake, J., Schwager, C., Eckstein, V., Ansorge, W. J., et al. (2005) · Experimental Hematology · doi:10.1016/j.exphem.2005.07.003 · Cited by 1,257
Stenderup, K. (2003) · Bone · doi:10.1016/j.bone.2003.07.005 · Cited by 1,207
Aging of mesenchymal stem cell in vitro
Bonab, M. M., Alimoghaddam, K., Talebian, F., Ghaffari, S. H., Ghavamzadeh, A., & Nikbin, B. (2006) · BMC Cell Biology · doi:10.1186/1471-2121-7-14 · Cited by 910
Aspects of the Structure, Function, and Applications of Superoxide Dismutas
Bannister, J. V., Bannister, W. H., & Rotilio, G. (1987) · Critical Reviews in Biochemistry and Molecular Biology · doi:10.3109/10409238709083738 · Cited by 860
The aging of hematopoietic stem cells
Morrison, S. J., Wandycz, A. M., Akashi, K., Globerson, A., & Weissman, I. L. (1996) · Nature Medicine · doi:10.1038/nm0996-1011 · Cited by 853
Zhou, S., Greenberger, J. S., Epperly, M. W., Goff, J. P., Adler, C., LeBoff, M. S., & Glowacki, J. (2008) · Aging Cell · doi:10.1111/j.1474-9726.2008.00377.x · Cited by 799
Adipose‐derived stem cell: a better stem cell than BMSC
Zhu, Y., Liu, T., Song, K., Fan, X., Ma, X., & Cui, Z. (2008) · Cell Biochemistry and Function · doi:10.1002/cbf.1488 · Cited by 572
Choudhery, M. S., Badowski, M., Muise, A., Pierce, J., & Harris, D. T. (2014) · Journal of Translational Medicine · doi:10.1186/1479-5876-12-8 · Cited by 529
Murphy, M. J., Dixon, K., Beck, S. C., Fabian, D., Feldman, A. L., & Barry, F. (2002) · Arthritis & Rheumatism · doi:10.1002/art.10118 · Cited by 528
Aspiration to Obtain Osteoblast Progenitor Cells from Human Bone Marrow
Muschler, G. F., Boehm, C., & Easley, K. A. (1997) · Journal of Bone and Joint Surgery · doi:10.2106/00004623-199711000-00012 · Cited by 511
Turturici, G., Tinnirello, R., Sconzo, G., & Geraci, F. (2014) · American Journal of Physiology-Cell Physiology · doi:10.1152/ajpcell.00228.2013 · Cited by 483
Therapeutic potential of mesenchymal stem cell-derived microvesicles
Biancone, L., Bruno, S., Deregibus, M. C., Tetta, C., & Camussi, G. (2012) · Nephrology Dialysis Transplantation · doi:10.1093/ndt/gfs168 · Cited by 401
Degenerative Arthritis After Tibial Plateau Fractures
Honkonen, S. E. (1995) · Journal of Orthopaedic Trauma · doi:10.1097/00005131-199509040-00001 · Cited by 392
Comparative Analysis of Mesenchymal Stem Cells from Bone Marrow, Cartilage, and Adipose Tissue
Peng, L., Jia, Z., Yin, X., Zhang, X., Liu, Y., Chen, P., Ma, K., & Zhou, C. (2008) · Stem Cells and Development · doi:10.1089/scd.2007.0217 · Cited by 368
Beane, O. S., Fonseca, V. C., Cooper, L. L., Koren, G., & Darling, E. M. (2014) · PLoS ONE · doi:10.1371/journal.pone.0115963 · Cited by 325
Mesenchymal stem cells for cartilage repair in osteoarthritis
Gupta, P. K., Das, A. K., Chullikana, A., & Majumdar, A. S. (2012) · Stem Cell Research & Therapy · doi:10.1186/scrt116 · Cited by 274
A crucial role of caspase-3 in osteogenic differentiation of bone marrow stromal stem cells
Miura, M., Chen, X., Allen, M. R., Bi, Y., Gronthos, S., Seo, B., Lakhani, S. A., Flavell, R. A., Feng, X., Robey, P. G., et al. (2004) · Journal of Clinical Investigation · doi:10.1172/jci20427 · Cited by 263
Stenderup, K., Justesen, J., Eriksen, E. F., Rattan, S. I. S., & Kassem, M. S. (2001) · Journal of Bone and Mineral Research · doi:10.1359/jbmr.2001.16.6.1120 · Cited by 242
Estrada, J. C., Torres, Y., Benguría, A., Dopazo, A., Roche, E., Carrera-Quintanar, L., Acín‐Pérez, R., Enrı́quez, J. A., Torres-Ruiz, R., Ramírez, J. C., et al. (2013) · Cell Death and Disease · doi:10.1038/cddis.2013.211 · Cited by 241
Regulation of reactive oxygen species-induced apoptosis and necrosis by caspase 3-like proteases
Higuchi, M., Honda, T., Proske, R. J., & Yeh, E. T. H. (1998) · Oncogene · doi:10.1038/sj.onc.1202211 · Cited by 223
Mendes, S. C., Tibbe, J. M., Veenhof, M., Bakker, K., Both, S. K., Platenburg, P. P., Öner, F. C., de Bruijn, J. D., & van Blitterswijk, C. (2002) · Tissue Engineering · doi:10.1089/107632702320934010 · Cited by 215
Justesen, J., Stenderup, K., Eriksen, E. F., & Kassem, M. S. (2002) · Calcified Tissue International · doi:10.1007/s00223-001-2059-x · Cited by 202
Zhang, Y., & Herman, B. A. (2002) · Mechanisms of Ageing and Development · doi:10.1016/s0047-6374(01)00349-9 · Cited by 178
Fetal cell microchimerism in tissue from multiple sites in women with systemic sclerosis
Johnson, K. L., Nelson, J. L., Fürst, D. E., McSweeney, P. A., Roberts, D. J., Zhen, D., & Bianchi, D. W. (2001) · Arthritis & Rheumatism · doi:10.1002/1529-0131(200108)44:8 · Cited by 173
Degenerative arthritis after intra-articular fractures of the knee. Long-term results
Volpin, G., Dowd, G. S. E., Stein, H., & Bentley, G. (1990) · Journal of Bone and Joint Surgery - British Volume · doi:10.1302/0301-620x.72b4.2380219 · Cited by 170
Age‐related changes in mesenchymal stem cells derived from rhesus macaque bone marrow
Yu, J. M., Wu, X., Gimble, J. M., Guan, X., Freitas, M. A., & Bunnell, B. A. (2010) · Aging Cell · doi:10.1111/j.1474-9726.2010.00646.x · Cited by 162
de Girolamo, L., Lopa, S., Arrigoni, E., Sartori, M. F., Preis, F. W. B., & Brini, A. T. (2009) · Cytotherapy · doi:10.3109/14653240903079393 · Cited by 144
Comparison of human mesenchymal stem cells derived from adipose and cord tissue
Choudhery, M. S., Badowski, M., Muise, A., & Harris, D. T. (2013) · Cytotherapy · doi:10.1016/j.jcyt.2012.11.010 · Cited by 128
Stem Cell Therapy for Osteoporosis
Antebi, B., Pelled, G., & Gazit, D. (2014) · Current Osteoporosis Reports · doi:10.1007/s11914-013-0184-x · Cited by 125
Posttraumatic Osteoarthritis Caused by Battlefield Injuries
Rivera, J. C., Wenke, J. C., Buckwalter, J. A., Ficke, J. R., & Johnson, A. E. (2012) · Journal of the American Academy of Orthopaedic Surgeons · doi:10.5435/jaaos-20-08-s64 · Cited by 113
Oreffo, R. O. C. (1998) · Scandinavian Journal of Rheumatology · doi:10.1080/030097498442235 · Cited by 99
Stem cell implantation for osteonecrosis of the femoral head
Lim, Y. W., Kim, Y. S., Lee, J. W., & Kwon, S. Y. (2013) · Experimental & Molecular Medicine · doi:10.1038/emm.2013.128 · Cited by 96
Matsumoto, T., Kubo, S., Meszaros, L. B., Corsi, K. A., Cooper, G. M., Li, G., Ūsas, A., Osawa, A., Fu, F. H., & Huard, J. (2008) · Arthritis & Rheumatism · doi:10.1002/art.24125 · Cited by 94
Impact of Aging on Rat Bone Marrow-Derived Stem Cell Chondrogenesis
Zheng, H., Martin, J. A., Duwayri, Y. M., Falcon, G., & Buckwalter, J. A. (2007) · The Journals of Gerontology Series A · doi:10.1093/gerona/62.2.136 · Cited by 85
Yukata, K., Xie, C. L., Li, T.-F., Takahata, M., Hoak, D., Kondabolu, S., Zhang, X., Awad, H. A., Schwarz, E. M., Beck, C. A., et al. (2014) · Bone · doi:10.1016/j.bone.2014.02.002 · Cited by 82
Nicpoń, J., Marycz, K., & Grzesiak, J. (2013) · Polish Journal of Veterinary Sciences · doi:10.2478/pjvs-2013-0107 · Cited by 58
Self-citationPPAR-γ and aging: one link through klotho?
Zhang, R., & Zheng, F. (2008) · Kidney International · doi:10.1038/ki.2008.382 · Cited by 53
Deregibus, M. C., Tetta, C., & Camussi, G. (2010) · PubMed · doi:10.14670/hh-25.397 · Cited by 52
Śmieszek, A., Donesz‐Sikorska, A., Grzesiak, J., Krzak, J., & Marycz, K. (2014) · Journal of Biomaterials Applications · doi:10.1177/0885328214545095 · Cited by 49
Self-citationMarycz, K., Śmieszek, A., Grzesiak, J., Donesz‐Sikorska, A., & Krzak, J. (2013) · Biomedical Materials · doi:10.1088/1748-6041/8/6/065004 · Cited by 44
Self-citationMesenchymal Stem Cells and Articular Cartilage Repair: Clinical Studies and Future Direction
Punwar, S., & Khan, W. S. (2011) · The Open Orthopaedics Journal · doi:10.2174/1874325001105010296 · Cited by 33
Marycz, K., Krzak, J., Donesz‐Sikorska, A., & Śmieszek, A. (2013) · Journal of Biomedical Materials Research Part A · doi:10.1002/jbm.a.35072 · Cited by 30
Self-citationMarycz, K., Toker, N. Y., Grzesiak, J., Wrzeszcz, K., & Golonka, P. (2012) · Journal of Animal and Veterinary Advances · doi:10.3923/javaa.2012.4324.4331 · Cited by 29
Self-citationMicrovesicles from Mesenchymal Stromal Cells Protect against Acute Kidney Injury
Bonventre, J. V. (2009) · Journal of the American Society of Nephrology · doi:10.1681/asn.2009030322 · Cited by 29
Modelling and optimization of chromiumIII biosorption on soybean meal
Witek‐Krowiak, A., Podstawczyk, D. A., Chojnacka, K., Dawiec‐Liśniewska, A., & Marycz, K. (2013) · Open Chemistry · doi:10.2478/s11532-013-0274-8 · Cited by 23
Self-citation
Cited by
Sorted by citations
Wu, J., Kuang, L., Chen, C., Yang, J., Zeng, W., Li, T., Chen, H., Huang, S., Fu, Z., Li, J., et al. (2019) · Biomaterials · doi:10.1016/j.biomaterials.2019.03.022 · Cited by 576
Lin, H., Sohn, J., Shen, H., Langhans, M. T., & Tuan, R. S. (2018) · Biomaterials · doi:10.1016/j.biomaterials.2018.06.026 · Cited by 455
TGF-β Signaling in Cellular Senescence and Aging-Related Pathology
Tominaga, K., & Suzuki, H. I. (2019) · International Journal of Molecular Sciences · doi:10.3390/ijms20205002 · Cited by 393
Zhao, M., Liu, S., Wang, C., Wang, Y., Wan, M., Liu, F., Gong, M., Yuan, Y., Chen, Y., Cheng, J., et al. (2020) · ACS Nano · doi:10.1021/acsnano.0c08947 · Cited by 360
Baldari, S., Rocco, G. D., Piccoli, M., Pozzobon, M., Muraca, M., & Toietta, G. (2017) · International Journal of Molecular Sciences · doi:10.3390/ijms18102087 · Cited by 289
Metadata
- Authors
- Marędziak, M., Marycz, K., Tomaszewski, K. A., Kornicka, K., & Henry, B. M.
- Affiliations
- Wrocław University of Environmental and Life Sciences (PL)
- Jagiellonian University (PL)
- Corresponding author
- Marycz, Krzysztof
- ORCID
- Venue
- Stem Cells International
- Publisher
- Wiley
- Published
- 2016-01
- Volume
- 2016
- Issue
- 1
- Pages
- 2152435-2152435
- ISSN
- 1687-966X (ISSN-L)
- 1687-9678
- PMC
- PMC4749808
- OpenAlex
- W2286064488
- Cited by
- 225
- References
- 54
- Citations by year
- 2026: 8 · 2025: 15 · 2024: 15 · 2023: 13 · 2022: 19 · 2021: 34 · 2020: 31 · 2019: 29 · 2018: 24 · 2017: 22 · 2016: 13
- FWCI
- 21.28
- Type
- journal article
- Language
- en
- Open access
- gold
- doi.org
- Licence
- Locations
- Stem Cells International (publishedVersion, cc-by)
- Europe PMC (PubMed Central) (publishedVersion, cc-by)
- PubMed Central (publishedVersion, cc-by)
- PubMed (publishedVersion)
- Jagiellonian University Repository (Jagiellonian University) (submittedVersion, cc-by-nc-nd)
- Homo Politicus (Academy of Humanities and Economics in Lodz) (submittedVersion)
- DOAJ (DOAJ: Directory of Open Access Journals) (submittedVersion, cc-by-sa)
- Funders
- Wrocław Centre of Biotechnology
- Foundation for Polish Science
- Topics
- Life Sciences › Biochemistry, Genetics and Molecular Biology › Cell Biology › Mesenchymal stem cell research
- Health Sciences › Dentistry › Periodontics › Periodontal Regeneration and Treatments
- Health Sciences › Medicine › Rheumatology › Osteoarthritis Treatment and Mechanisms
- Keywords
- human adipose-derived mesenchymal stem cells, aging, cellular senescence, multilineage differentiation, osteogenic differentiation, chondrogenic differentiation, adipogenesis, cell proliferation, population doubling time, CFU-F, tissue regeneration
About these checks
Registry, retraction, Cites and statistics results are computed, not judged, with one exception: a printed reference that no index lists is read once by a model before it counts as a citation error. Claims are extracted by a model and kept only when their quote appears verbatim in the text; each cited source is then checked, with a model’s help, for whether it says what the claim relies on. Those verdicts can be wrong — read the claim’s quote and the cited source before relying on one.
Statistics and arithmetic are recomputed, not judged.
Confidence bands are shown only for fields calibrated on our annotated test set. None is calibrated yet, so no band is shown.
What counts as a claim ›How we measure confidence ›How we check this ›
Are you an author, or do you see a problem with this page? Request a review
