

Optimal Satellite LEO Constellation Design Based on Global Coverage in One Revisit Time
Open accessThe DOI matches its Crossref record; 6 of the 6 references it cites were found in a registry or an index; none of the 6 sources its claims cite is checked for support yet.
Abstract
This paper presents a globe coverage of constellation satellite in one revisit and the regional coverage at defined latitude. This constellation seems to be very close to optimal under the maximum revisit time comparing to the results in other papers. They are produced easily by using tables and data achievements. These satellites are fully connected by crosslinks sweeping the Earth. This model is more optimal comparing to the conventional constellations that distribute satellites evenly in the space. Since satellites on the LEO orbit are side by side, in most cases, they can maintain communication continuously. This special feature allows all satellites in the constellation connecting ground at any time when a satellite is available to the stations. Length of the crosslink is allowed to reject location connection or real-time data transmission. For example, six satellites in the constellation cover the whole Earth within one revisit time and all the data are collected by two Earth stations for keeping continuous coverage. Thus, the adjacent satellites may be more efficient and provide more coverage.
Overview
CoChat Summary
TL;DR
The paper proposes COF and COB LEO constellation arrangements using RAAN/mean-anomaly offsets and crosslinks to achieve global coverage in one revisit time, comparing them with Walker and GA constellations. It reports that six COF satellites at 650 km and >10° elevation can cover the Earth in one revisit, with MRT slightly above the 97-minute orbital period and crosslink reach about 5200 km.
Key findings
- Six polar COF satellites at 650 km altitude with elevation angle >10° give central angle θ = 14.6°, latitude 12°, and cover the entire Earth in one revisit; -ΔM = ΔΩ = 31.3°, minimum crosslink height is 105 km, maximum crosslink range is about 5200 km, and MRT is slightly bigger than the 97-minute orbital period.
- For six COF satellites at 650 km, Earth stations near the poles—McMurdo (77.7 S, 168.2 E) and Thule (76.5 N, 68.7 W)—can connect for more than 83% of the time; revisit time equals 104 minutes, and two Earth stations can be used simultaneously through ISL.
- For four satellites at 1100 km and elevation 0°, θ = 31.47°; optimal COF occurs at 90° inclination with -ΔM = ΔΩ = 68°, and another optimal solution is at 850 km with elevation zero and -ΔM = ΔΩ = 60.4°. For five satellites at 700 km, θ = 25.7°, -ΔM = ΔΩ = 49°, and inclination 100° in Reference [3].
- A hybrid LEO constellation of 21 active satellites at 1100 km and 80° inclination plus 28 active satellites at 750 km, totaling 49 satellites, is said to cover the entire Earth in a revisit with optimal overlap; the conclusion states MRT may be 90 to 130 minutes and COF is more convenient and efficient than COB.
Methods
- Circular constellation design assumes satellites have the same height and orientation; initial RAAN and mean anomaly values place satellites along a slope of -1 for posigrade orbits or +1 for retrograde orbits. COF uses a “Figure 9” pattern, while COB uses overlapping “Brush Line” footprints.
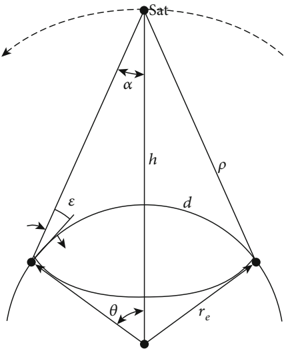
- Coverage analysis uses off-nadir and central-angle equations, footprint shift S from nodal rate, Earth rotation rate, and node period; crosslink geometry uses a 105 km grazing altitude, with appendices deriving COB parameters and crosslink ellipse equations.
- Simulations compare MRT as a function of latitude for COF, Walker, and GA constellations, using examples with 4, 5, 6, and 9 satellites at altitudes from 650 to 1100 km, inclinations from 50° to 105°, and elevation angles from 0° to 12°.
Limitations
- The paper states that simulation shows small spots or cavities with no connection to Earth stations, though different satellites may cover them, and that land coverage differs from one revisit to a subsequent revisit.
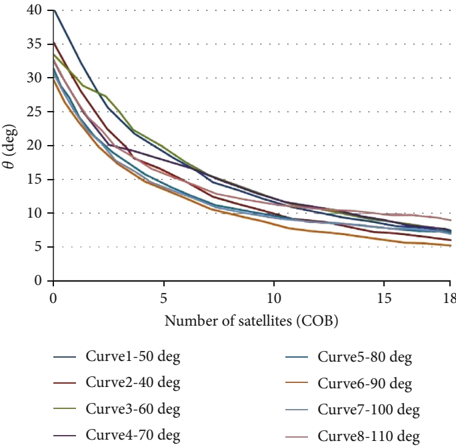
- The coverage analysis states an assumption that the Earth is not spinning for the equator coverage derivation; the COB section also states, as written, that the size of circular coverage θ cannot be calculated when elevation angle ε is 10°.
- Evident from the text: comparisons rely on examples from Reference [3] and on figures/tables, with incomplete simulation parameters and some garbled equations, making independent reproduction difficult.
Model-written summary. Check it against the paper before relying on it.
Integrity signals
Registry
Cites
Statistics
Figures








Verification
Claims the paper makes
0 Valid · 11 Not valid · 4 Not checked · 90 Own results and interpretations
A result the paper reports from its own data — it cites no other source for it, so there is none to check. The quote shows it is in the paper.
In the paper
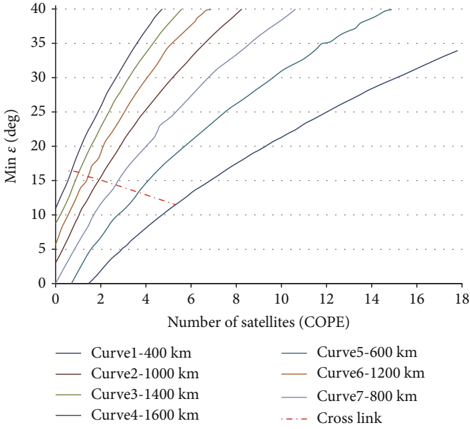
“Displayed in Figure 17 for six satellites in the COF method, the minimum elevation angle is 12 degrees, if the maximum MRT is obtained.”
§ Optimal Satellite LEO Constellation Design Based on Global Coverage in One Revisit Time > 7. More Results in COF Constellations
plainstates an associationSingle case- Asserted: passes — The authors put it forward as true.
- Checkable: passes — It can be checked against evidence.
- Load-bearing: unclear — It is unclear whether the paper’s conclusions depend on it.
- Based: passes — The paper gives a reason why it holds.
A result the paper states — it cites no source for it, so there is none to check. The quote shows it is in the paper.
In the paper
“The maximum range of crosslink is about 5200 kilometers.”
§ Optimal Satellite LEO Constellation Design Based on Global Coverage in One Revisit Time > 7. More Results in COF Constellations
hedged- Asserted: passes — The authors put it forward as true.
- Checkable: passes — It can be checked against evidence.
- Load-bearing: unclear — It is unclear whether the paper’s conclusions depend on it.
- Based: passes — The paper gives a reason why it holds.
A result the paper states — it cites no source for it, so there is none to check. The quote shows it is in the paper.
In the paper
“In inclinations of retrograde, constellation has the same results as line with slope of +1.”
§ Optimal Satellite LEO Constellation Design Based on Global Coverage in One Revisit Time > 2. RAAN and Mean Anomaly
plainstates an association- Asserted: passes — The authors put it forward as true.
- Checkable: passes — It can be checked against evidence.
- Load-bearing: unclear — It is unclear whether the paper’s conclusions depend on it.
- Based: passes — The paper gives a reason why it holds.
- Rests on an assumption not shown here.
A result the paper states — it cites no source for it, so there is none to check. The quote shows it is in the paper.
In the paper
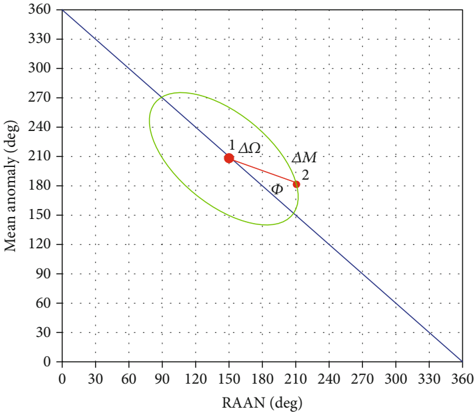
“Adjacent satellites that are active in the COB method are at points of the green oval with a maximum ΔΩ.”
§ Optimal Satellite LEO Constellation Design Based on Global Coverage in One Revisit Time > 5. "Brush Line" in COB Constellation
plainstates an association- Asserted: passes — The authors put it forward as true.
- Checkable: passes — It can be checked against evidence.
- Load-bearing: passes — The paper’s conclusions depend on it.
- Based: passes — The paper gives a reason why it holds.
A result the paper reports from its own data — it cites no other source for it, so there is none to check. The quote shows it is in the paper.
In the paper
“Clearly, coverage of the COF in latitude below 50 degrees is better than GA constellation”
§ Optimal Satellite LEO Constellation Design Based on Global Coverage in One Revisit Time > 6. More Results of MRT in Different Constellations
boostedstates an association- Asserted: passes — The authors put it forward as true.
- Checkable: passes — It can be checked against evidence.
- Load-bearing: unclear — It is unclear whether the paper’s conclusions depend on it.
- Based: passes — The paper gives a reason why it holds.
44 more claims
Create a free account to see all 105 claims and every source verdict.
- Probably not a substantial claim. 37
- It may state two separate claims as one. 24
- Borderline: one of the tests for a substantial claim is unclear. 1
Self-check
Percentages, sums and reported differences re-computed from the paper’s own numbers.
Each contradiction between two passages listed here was confirmed by an independent check.
Rated minor: it would not touch a result — a value no result rests on, a p-value that stays on the same side of the significance level, or a conflict that is clerical, resolved elsewhere in the paper, or outside its own findings.
In the paper
§ Optimal Satellite LEO Constellation Design Based on Global Coverage in One Revisit Time > 6. More Results of MRT in Different Constellations
“Figure 12 shows the values of MRT as a function of latitude at minimum elevation angle = 0 for COF, Walker, and GA orderings.”
§ Optimal Satellite LEO Constellation Design Based on Global Coverage in One Revisit Time > 5. "Brush Line" in COB Constellation
“Figure 12 shows the results of polar COB constellations with coverage size or central angle (θ) respecting to elevation angle (ε).”
Citations
Cites
Satellite Constellation Design Tradeoffs Using Multiple-Objective Evolutionary Computation
Ferringer, M. P., & Spencer, D. B. (2006) · Journal of Spacecraft and Rockets · doi:10.2514/1.18788 · Cited by 79
Orbit Design for Ground Surveillance Using Genetic Algorithms
Abdelkhalik, O., & Mortari, D. (2006) · Journal of Guidance, Control, and Dynamics · doi:10.2514/1.16722 · Cited by 59 · cited 1×
“Further details of these researches can be found in References [2, 7] and [6].”
BackgroundOptimal Earth orbiting satellite constellations via a Pareto Genetic Algorithm
Mason, W., Coverstone-Carroll, V. L., & Hartmann, J. W. (1998) · AIAA/AAS Astrodynamics Specialist Conference and Exhibit · doi:10.2514/6.1998-4381 · Cited by 40
The performance of the constellations satellites based on reliability
Peng, Z., & Kohani, S. (2017) · Journal of Space Safety Engineering · doi:10.1016/j.jsse.2017.07.003 · Cited by 10
Self-citationOptimizing Flower Constellations for Global Coverage
Casanova, D., Avendano, M. E., & Mortari, D. (2012) · AIAA/AAS Astrodynamics Specialist Conference and Exhibit · doi:10.2514/6.2012-4805 · Cited by 10
Low Earth Orbit Debris Removal Technology Assessment Using Genetic Algorithms
Marcus, M. L., & Sedwick, R. J. (2017) · Journal of Spacecraft and Rockets · doi:10.2514/1.a33671 · Cited by 9
Research works printed but not linked: 1
- 1. E. George, "Optimization of satellite constellations for discon- tinuous global coverage via genetic algorithms," in AAS 97- 621, AAS/AIAA Astrodynamics Specialist Conference 1997, Sun Valley, ID, August4-7, 1997, Advances in the Astronautical Sci- ences Series, Vol. 97, pp. 333-347, Univelt Inc., San Diego, 1998.
Cited by
Cakaj, S. (2021) · Frontiers in Communications and Networks · doi:10.3389/frcmn.2021.643095 · Cited by 128
Hassan, S. S., Kim, D. H., Tun, Y. K., Tran, N. H. K., Saad, W., & Hong, C. S. (2022) · IEEE Internet of Things Journal · doi:10.1109/jiot.2022.3220631 · Cited by 85
A Feasibility Study for Signal-in-Space Design for LEO-PNT Solutions With Miniaturized Satellites
Ferré, R. M., Praks, J., Seco‐Granados, G., & Lohan, E. S. (2022) · IEEE Journal on Miniaturization for Air and Space Systems · doi:10.1109/jmass.2022.3206023 · Cited by 43
Trends in LPWAN Technologies for LEO Satellite Constellations in the NewSpace Context
Ledesma, O., Lamo, P., & Fraire, J. A. (2024) · Electronics · doi:10.3390/electronics13030579 · Cited by 38
Configuration Design Method of Mega Constellation for Low Earth Orbit Observation
Yang, Y., Wu, X., Li, J., Zang, J., Lu, J., & Zgeib, R. (2024) · Space Science & Technology · doi:10.34133/space.0175 · Cited by 23
Metadata
- Authors
- Zong, P., & Kohani, S.
- Affiliations
- Nanjing University of Aeronautics and Astronautics (CN)
- Corresponding author
- Kohani, Saeid
- ORCID
- Kohani, Saeid
- Venue
- International Journal of Aerospace Engineering
- Publisher
- Wiley
- Published
- 2019-12-06
- Volume
- 2019
- Pages
- 1-12
- ISSN
- 1687-5966 (ISSN-L)
- 1687-5974
- OpenAlex
- W2992789691
- Cited by
- 22
- References
- 4
- Citations by year
- 2026: 5 · 2025: 4 · 2024: 5 · 2023: 3 · 2022: 3 · 2021: 2
- FWCI
- 0.92
- Type
- journal article
- Language
- en
- Open access
- gold
- doi.org
- Locations
- International Journal of Aerospace Engineering (publishedVersion, cc-by)
- DOAJ (DOAJ: Directory of Open Access Journals) (submittedVersion, cc-by-sa)
- Topics
- Physical Sciences › Engineering › Aerospace Engineering › Satellite Communication Systems
- Physical Sciences › Engineering › Aerospace Engineering › Spacecraft Dynamics and Control
- Physical Sciences › Engineering › Aerospace Engineering › Space Satellite Systems and Control
- Keywords
- LEO satellite constellations, global coverage, revisit time, crosslinking, satellite connectivity, continuous coverage
About these checks
Registry, retraction, Cites and statistics results are computed, not judged, with one exception: a printed reference that no index lists is read once by a model before it counts as a citation error. Claims are extracted by a model and kept only when their quote appears verbatim in the text; each cited source is then checked, with a model’s help, for whether it says what the claim relies on. Those verdicts can be wrong — read the claim’s quote and the cited source before relying on one.
A language model drew the claims from the paper on 2026-10-10, under version 3 of the claim definition (model deepseek-v4.1-flash, prompt extract-v3).
A second model labelled each claim on 2026-10-10 (model jev-1.13-20260917, definition revision gold-guideline-v0.2).
Statistics and arithmetic are recomputed, not judged.
Confidence bands are shown only for fields calibrated on our annotated test set. None is calibrated yet, so no band is shown.
What counts as a claim ›How we measure confidence ›How we check this ›
Are you an author, or do you see a problem with this page? Request a review
Data sources
Bibliographic data: Semantic Scholar, OpenAlex, Crossref.
Contains information from the Semantic Scholar Academic Graph Datasets, made available under the ODC Attribution License (ODC-BY 1.0).
Semantic Scholar’s data is described in: Kinney, R., et al. (2023). The Semantic Scholar Open Data Platform. arXiv:2301.10140.
