

The DOI matches its Crossref record; 40 of the 40 references it cites were found in a registry or an index.
Comparative AAV-eGFP Transgene Expression Using Vector Serotypes 1–9, 7m8, and 8b in Human Pluripotent Stem Cells, RPEs, and Human and Rat Cortical Neurons
Open accessAbstract
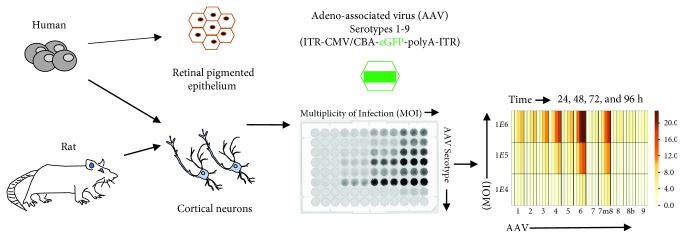
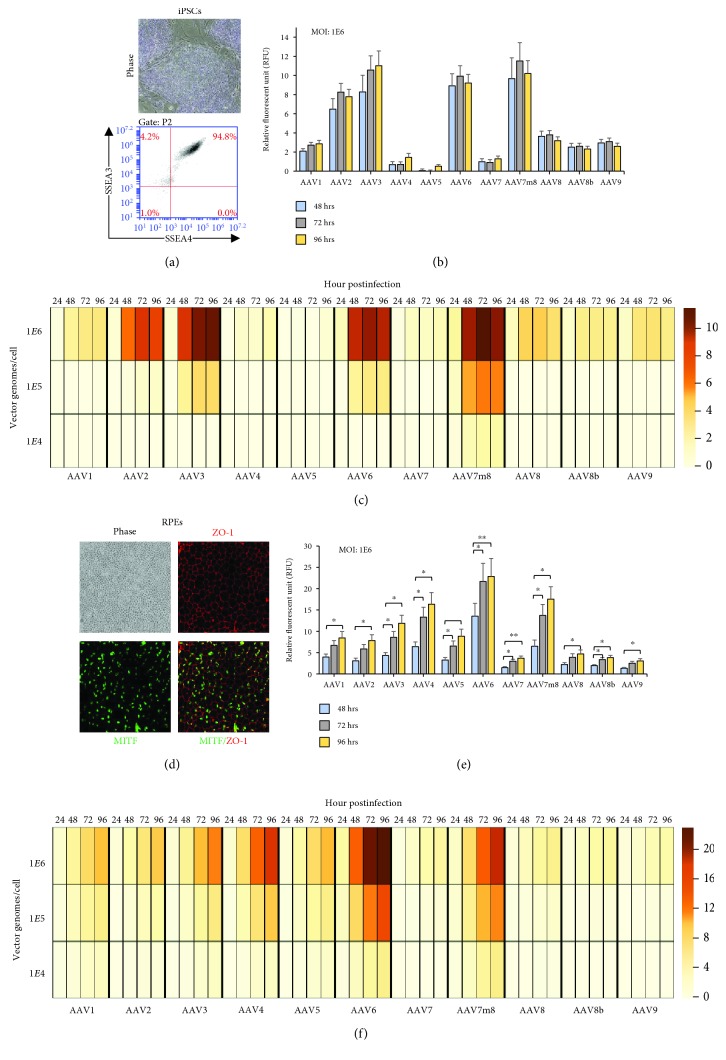
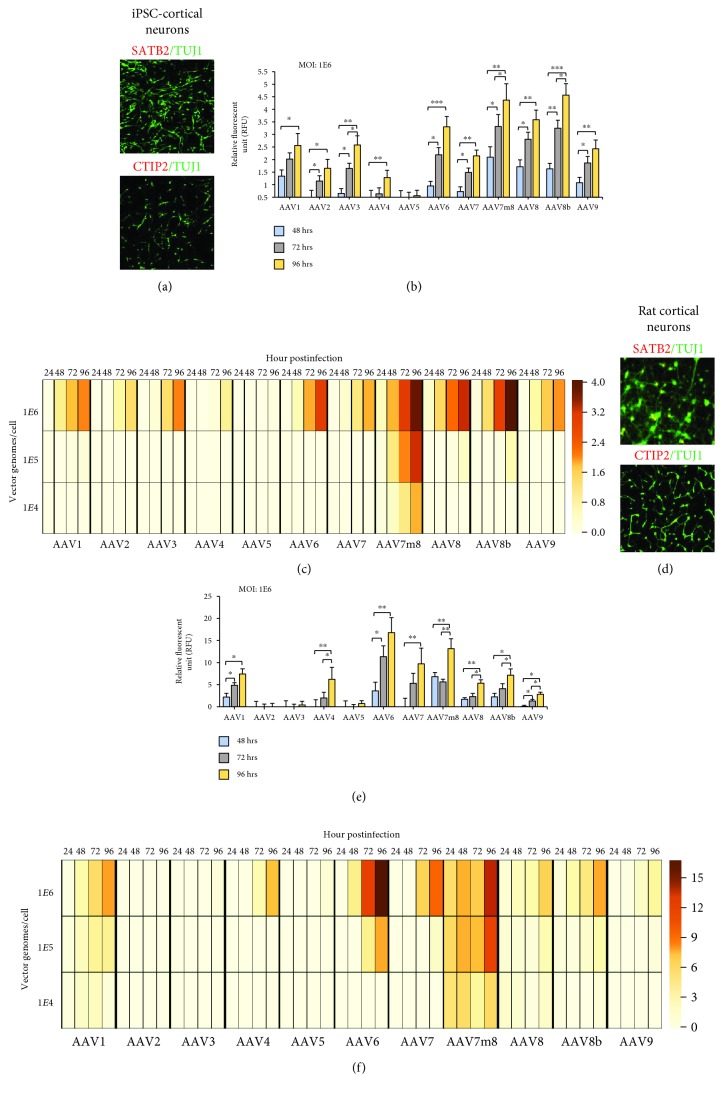
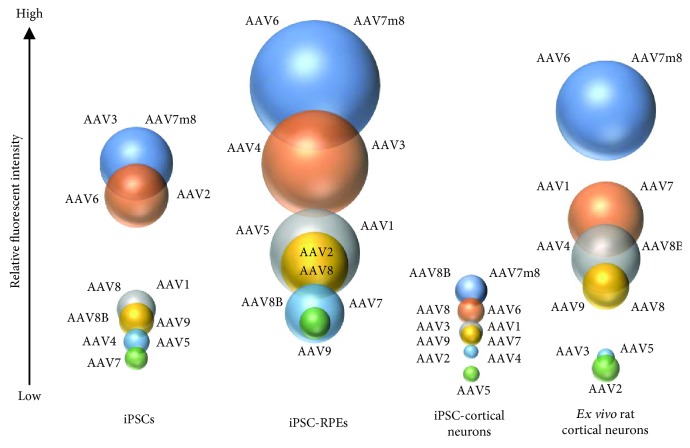
Recombinant adeno-associated virus (rAAV), produced from a nonpathogenic parvovirus, has become an increasing popular vector for gene therapy applications in human clinical trials. However, transduction and transgene expression of rAAVs can differ across in vitro and ex vivo cellular transduction strategies. This study compared 11 rAAV serotypes, carrying one reporter transgene cassette containing a cytomegalovirus immediate-early enhancer (eCMV) and chicken beta actin (CBA) promoter driving the expression of an enhanced green-fluorescent protein (eGFP) gene, which was transduced into four different cell types: human iPSC, iPSC-derived RPE, iPSC-derived cortical, and dissociated embryonic day 18 rat cortical neurons. Each cell type was exposed to three multiplicity of infections (MOI: 1E4, 1E5, and 1E6 vg/cell). After 24, 48, 72, and 96 h posttransduction, GFP-expressing cells were examined and compared across dosage, time, and cell type. Retinal pigmented epithelium showed highest AAV-eGFP expression and iPSC cortical the lowest. At an MOI of 1E6 vg/cell, all serotypes show measurable levels of AAV-eGFP expression; moreover, AAV7m8 and AAV6 perform best across MOI and cell type. We conclude that serotype tropism is not only capsid dependent but also cell type plays a significant role in transgene expression dynamics.
Overview
The claims and statistics of this paper haven’t been checked yet.
Free: it reads the open-access text and checks the first 5 claims that cite a source we can check. Create a free account to check every claim.
Integrity signals
Registry
Cites
Statistics
Figures
Verification
Claims the paper makes
The claims and statistics of this paper haven’t been checked yet.
Free: it reads the open-access text and checks the first 5 claims that cite a source we can check. Create a free account to check every claim.
Claims other papers make about this one
Each is checked against this paper’s own text: does it say what the citing paper says it does?
The source backs part of the claim, not all of it — or backs it for a different population, condition or comparison.
In the citing paper
“They express the transgene within days or weeks and can reach full expression levels after 4-6 weeks in vivo [20,21].”
From Recombinant Adeno-Associated Viral Vectors (rAAV)-Vector Elements in Ocular Gene Therapy Clinical Trials and Transgene Expression and Bioactivity Assays (2020) · cites this paper as [21]
Experimental — accuracy not yet measuredThe source backs part of the claim, not all of it — or backs it for a different population, condition or comparison.
In the citing paper
“For example, rAAV6 and rAAV-derived vectors (ShH10; ShH10-Y445F) infected hiPSCs and hiPSC-derived RPE cells properly and thoroughly [21,62,265].”
From Recombinant Adeno-Associated Viral Vectors (rAAV)-Vector Elements in Ocular Gene Therapy Clinical Trials and Transgene Expression and Bioactivity Assays (2020) · cites this paper as [21]
Experimental — accuracy not yet measuredThe source backs part of the claim, not all of it — or backs it for a different population, condition or comparison.
In the citing paper
“Interestingly though, (early) radial retinal progenitor cells in retinal organoids or common cell lines can efficiently be infected by rAAV6, the rAAV6 variants (ShH10 and ShH10Y-445F), and the AAV2-7m8 [21,62,265,284].”
From Recombinant Adeno-Associated Viral Vectors (rAAV)-Vector Elements in Ocular Gene Therapy Clinical Trials and Transgene Expression and Bioactivity Assays (2020) · cites this paper as [21]
Experimental — accuracy not yet measuredThe source backs part of the claim, not all of it — or backs it for a different population, condition or comparison.
In the citing paper
“Overall, our results indicated AAV2.7m8 to be a useful delivery vector for cells across retinal cell types, confirming several previous studies (29–32).”
From Characterization of RNA editing and gene therapy with a compact CRISPR-Cas13 in the retina (2024) · cites this paper as [29]
Experimental — accuracy not yet measuredThe cited source says what the claim attributes to it.
In the citing paper
“These differences are likely due to cell-specific transduction as RPE cells are readily transduced by a variety of AAV capsids, particularly AAV2.7m8 (29).”
From Characterization of RNA editing and gene therapy with a compact CRISPR-Cas13 in the retina (2024) · cites this paper as [29]
Self-check
Percentages, sums and reported differences re-computed from the paper’s own numbers.
The self-check needs the paper’s full text.
Citations
Cites
Safety and Efficacy of Gene Transfer for Leber's Congenital Amaurosis
Maguire, A. M., Simonelli, F., Pierce, E. A., Pugh, E. N., Mingozzi, F., Bennicelli, J., Banfi, S., Marshall, K. A., Testa, F., Surace, E. M., et al. (2008) · New England Journal of Medicine · doi:10.1056/nejmoa0802315 · Cited by 2,145
Self-citationRussell, S., Bennett, J., Wellman, J. A., Chung, D. C., Yu, Z.-F., Tillman, A., Wittes, J., Pappas, J., Elci, O., McCague, S., et al. (2017) · The Lancet · doi:10.1016/s0140-6736(17)31868-8 · Cited by 1,952
Self-citationMaguire, A. M., High, K. A., Auricchio, A., Wright, J. F., Pierce, E. A., Testa, F., Mingozzi, F., Bennicelli, J. L., Ying, G.-S., Rossi, S., et al. (2009) · The Lancet · doi:10.1016/s0140-6736(09)61836-5 · Cited by 865
Self-citationMacLaren, R. E., Groppe, M., Barnard, A. R., Cottriall, C. L., Tolmachova, T., Seymour, L., Clark, K. R., During, M. J., Cremers, F. P. M., Black, G. C. M., et al. (2014) · The Lancet · doi:10.1016/s0140-6736(13)62117-0 · Cited by 796 · cited 1×
“RPE cells have been subject to a number of clinical interventions for the treatment of vision disorders such as retinitis pigmentosa (RP), Leber ’ s congenital amarosis (LCA), advanced neovascular age-related macular degeneration, and choroidal neovascularization [10, 21 – 23].”
Ferrari, F. K., Samulski, T., Shenk, T., & Samulski, R. J. (1996) · Journal of Virology · doi:10.1128/jvi.70.5.3227-3234.1996 · Cited by 761 · cited 1×
“This time, delay may relate to the time needed to convert the single stranded DNA in AAV to a double-stranded transcriptionally competent form [28, 29].”
Maroof, A. M., Keros, S., Tyson, J. A., Ying, S.-W., Ganat, Y. M., Merkle, F. T., Liu, B., Goulburn, A., Stanley, E. G., Elefanty, A. G., et al. (2013) · Cell Stem Cell · doi:10.1016/j.stem.2013.04.008 · Cited by 596 · cited 1×
“The differentiation was performed as previously published with some modifications [15, 16].”
Espuny-Camacho, I., Michelsen, K. A., Gall, D., Linaro, D., Hasche, A., Bonnefont, J., Bali, C., Orduz, D., Bilheu, A., Herpoel, A., et al. (2013) · Neuron · doi:10.1016/j.neuron.2012.12.011 · Cited by 568 · cited 1×
“The di ff erentiation was performed as previously published with some modi fi cations [15, 16].”
Fisher, K. J., Gao, G. P., Weitzman, M. D., DeMatteo, R., Burda, J. F., & Wilson, J. M. (1996) · Journal of Virology · doi:10.1128/jvi.70.1.520-532.1996 · Cited by 547 · cited 1×
“This time, delay may relate to the time needed to convert the single stranded DNA in AAV to a double-stranded transcriptionally competent form [28, 29].”
Gene therapy vectors based on adeno-associated virus type 1
Xiao, W., Chirmule, N., Berta, S. C., McCullough, B., Gao, G., & Wilson, J. M. (1999) · Journal of Virology · doi:10.1128/jvi.73.5.3994-4003.1999 · Cited by 541
Bennett, J., Wellman, J., Marshall, K. A., McCague, S., Ashtari, M., DiStefano-Pappas, J., Elci, O. U., Chung, D. C., Sun, J., Wright, J. F., et al. (2016) · The Lancet · doi:10.1016/s0140-6736(16)30371-3 · Cited by 461 · cited 1×
“Although AAV serotype 2 (AAV2) is the most studied with respect to safety and efficacy and is the first AAV vector approved as a drug for the treatment of a retinal disease, other AAV serotypes have great potential and their utility needs to be fully elucidated [1, 2, 10, 11].”
Self-citation
Cited by
Westhaus, A., Cabanes-Creus, M., Rybicki, A., Baltazar, G., Navarro, R. G., Zhu, E., Drouyer, M., Knight, M., Albu, R. F., Ng, B. H., et al. (2020) · Human Gene Therapy · doi:10.1089/hum.2019.264 · Cited by 102
“As AAV LK03 is largely homologous to AAV3B, our data are in agreement with published work, where AAV3B has previously been shown to transduce iPSCs more efficiently than other AAVs.52 It is possible that the observed toxicity was enhanced by the single-stranded AAV genome used in our experiments, culture conditions, t…”
ResultInfluentialBuck, T., & Wijnholds, J. (2020) · International Journal of Molecular Sciences · doi:10.3390/ijms21124197 · Cited by 92
“rAAV DNA carrier systems have been successfully used because they have a plethora of advantages: (1) They express the transgene within days or weeks and can reach full expression levels after 4–6 weeks in vivo [20,21].”
BackgroundAAV-Mediated Gene Delivery to 3D Retinal Organoids Derived from Human Induced Pluripotent Stem Cells
Garita-Hernandez, M., Routet, F., Guibbal, L., Khabou, H., Toualbi, L., Riancho, L., Reichman, S., Duebel, J., Sahel, J.-A., Goureau, O., et al. (2020) · International Journal of Molecular Sciences · doi:10.3390/ijms21030994 · Cited by 82
Strategies for Optimizing the Production of Proteins and Peptides with Multiple Disulfide Bonds
Ma, Y., Lee, C.-J., & Park, J.-S. (2020) · Antibiotics · doi:10.3390/antibiotics9090541 · Cited by 67
Generation of ‘semi-guided’ cortical organoids with complex neural oscillations
Fitzgerald, M. Q., Chu, T., Puppo, F., Blanch, R., Chillón, M., Subramaniam, S., & Muotri, A. R. (2024) · Nature Protocols · doi:10.1038/s41596-024-00994-0 · Cited by 50
Metadata
- Authors
- Duong, T. T., Lim, J., Vasireddy, V., Papp, T., Nguyen, H., Leo, L., Pan, J., Zhou, S., Chen, H. I., Bennett, J., & Mills, J. A.
- Affiliations
- University of Pennsylvania (US)
- Department of Neurosurgery, University of Pennsylvania, Philadelphia, Pennsylvania 19104, USA
- Corresponding author
- Mills, Jason A.
- Venue
- Stem Cells International
- Publisher
- Wiley
- Published
- 2019-01-17
- Volume
- 2019
- Pages
- 1-11
- ISSN
- 1687-966X (ISSN-L)
- 1687-9678
- PMC
- PMC6360060
- OpenAlex
- W2910320351
- Cited by
- 33
- References
- 40
- Citations by year
- 2025: 3 · 2024: 6 · 2023: 6 · 2022: 5 · 2021: 6 · 2020: 6 · 2019: 1
- FWCI
- 2.71
- Type
- journal article
- Language
- en
- Open access
- gold
- doi.org
- Locations
- Stem Cells International (publishedVersion, cc-by)
- Europe PMC (PubMed Central) (publishedVersion, cc-by)
- PubMed Central (publishedVersion, cc-by)
- PubMed (publishedVersion)
- DOAJ (DOAJ: Directory of Open Access Journals) (submittedVersion, cc-by-sa)
- Funders
- Paul MacKall and Evanina Bell MacKall Trust (P30EY01583-26, IK2RX002013)
- National Institutes of Health (P30EY01583-26, IK2RX002013)
- F. M. Kirby Foundation (P30EY01583-26, IK2RX002013)
- Research to Prevent Blindness (P30EY01583-26, IK2RX002013)
- Robert and Susan Heidenberg Investigative Research Fund for Ocular Gene Therapy (P30EY01583-26, IK2RX002013)
- Department of Veterans Affairs (P30EY01583-26, IK2RX002013)
- Foundation for Fighting Blindness (P30EY01583-26, IK2RX002013)
- Center for Advanced Retinal and Ocular Therapeutics (P30EY01583-26, IK2RX002013)
- Vietnam Education Foundation (P30EY01583-26, IK2RX002013)
- Topics
- Life Sciences › Biochemistry, Genetics and Molecular Biology › Genetics › Virus-based gene therapy research
- Life Sciences › Biochemistry, Genetics and Molecular Biology › Molecular Biology › RNA Interference and Gene Delivery
- Health Sciences › Medicine › Ophthalmology › Retinal Development and Disorders
- Keywords
- recombinant adeno-associated virus, AAV serotypes, AAV6, cell type specificity, iPSC-derived cortical neurons, rat cortical neurons, multiplicity of infection, gene therapy vectors
About these checks
Registry, retraction, Cites and statistics results are computed, not judged, with one exception: a printed reference that no index lists is read once by a model before it counts as a citation error. Claims are extracted by a model and kept only when their quote appears verbatim in the text; each cited source is then checked, with a model’s help, for whether it says what the claim relies on. Those verdicts can be wrong — read the claim’s quote and the cited source before relying on one.
Statistics and arithmetic are recomputed, not judged.
Confidence bands are shown only for fields calibrated on our annotated test set. None is calibrated yet, so no band is shown.
What counts as a claim ›How we measure confidence ›How we check this ›
Are you an author, or do you see a problem with this page? Request a review
How to cite
Cite CoChat for the checks on this page, and the paper for its own findings.
- This page
- CoChat. (2026). Citation check: Comparative AAV-eGFP Transgene Expression Using Vector Serotypes 1–9, 7m8, and 8b in Human Pluripotent Stem Cells, RPEs, and Human and Rat Cortical Neurons. https://app.cochat.ai/papers/10.1155/2019/7281912
- The paper
- Duong, T. T., Lim, J., Vasireddy, V., Papp, T., Nguyen, H., Leo, L., Pan, J., Zhou, S., Chen, H. I., Bennett, J., & Mills, J. A. (2019). Comparative AAV-eGFP Transgene Expression Using Vector Serotypes 1–9, 7m8, and 8b in Human Pluripotent Stem Cells, RPEs, and Human and Rat Cortical Neurons. Stem Cells International. https://doi.org/10.1155/2019/7281912
Data sources
Bibliographic data: Semantic Scholar, OpenAlex, Crossref.
Contains information from the Semantic Scholar Academic Graph Datasets, made available under the ODC Attribution License (ODC-BY 1.0).
Semantic Scholar’s data is described in: Kinney, R., et al. (2023). The Semantic Scholar Open Data Platform. arXiv:2301.10140.
