

The DOI matches its Crossref record.
Development and Validation of a Robust Immune-Related Prognostic Signature for Gastric Cancer
Open accessAbstract
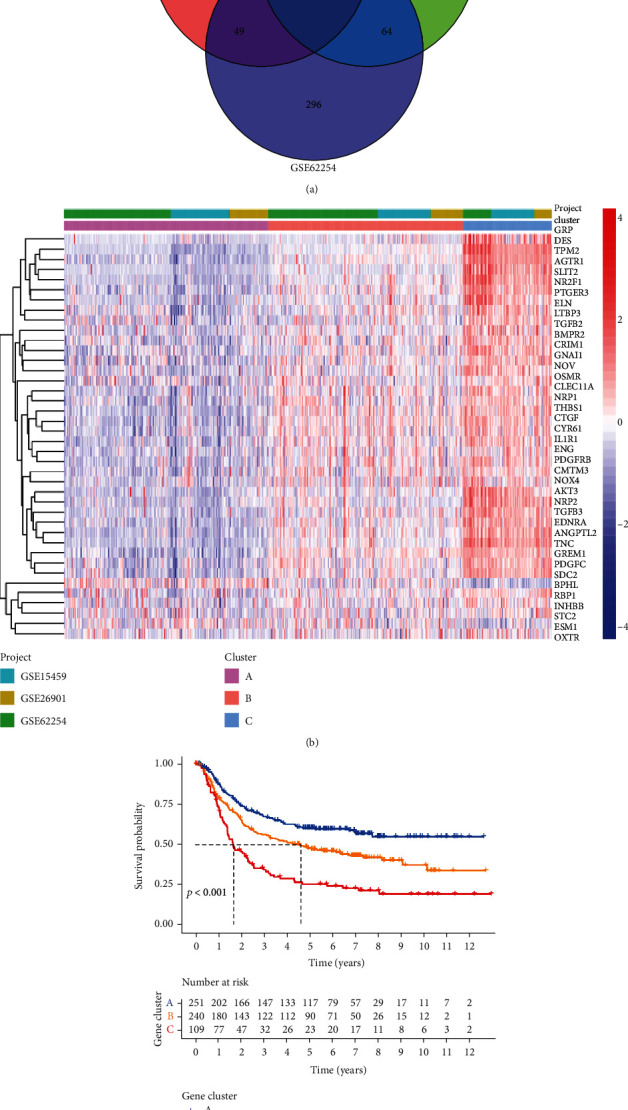
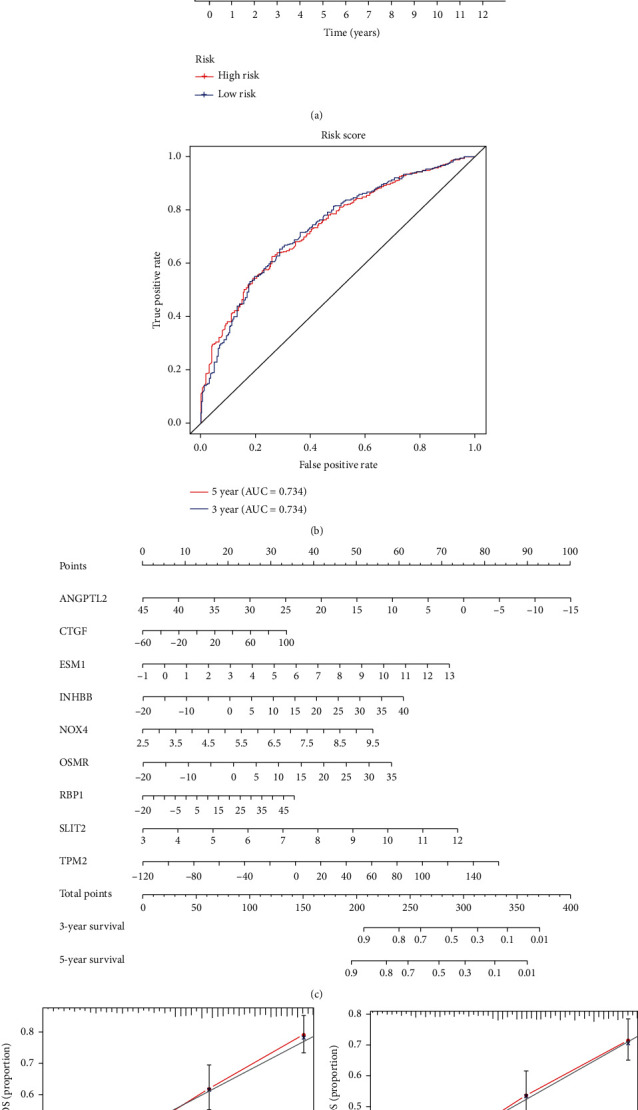
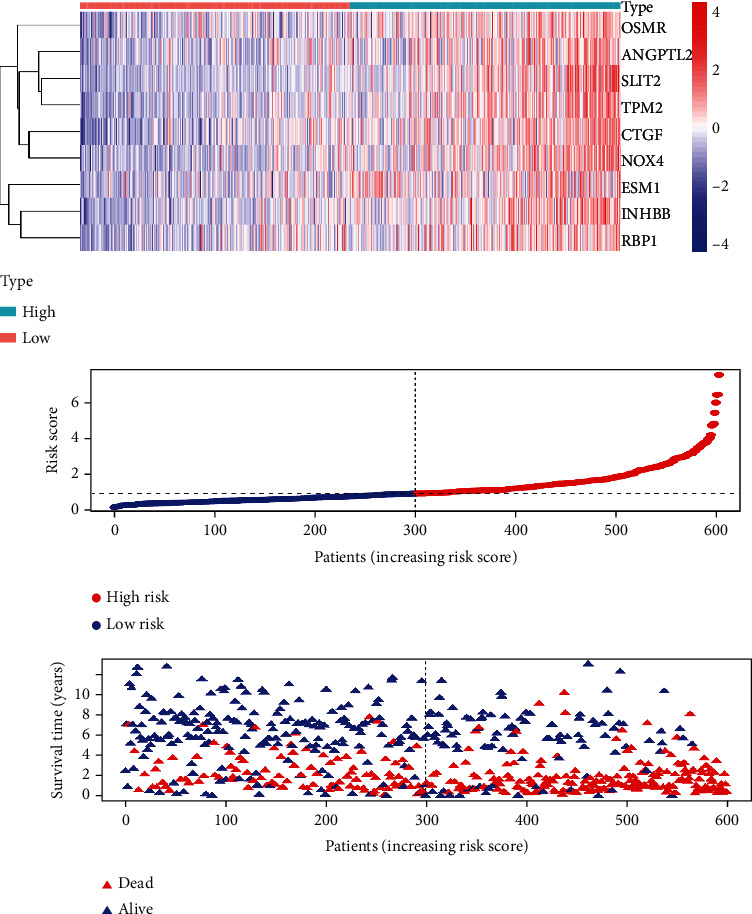
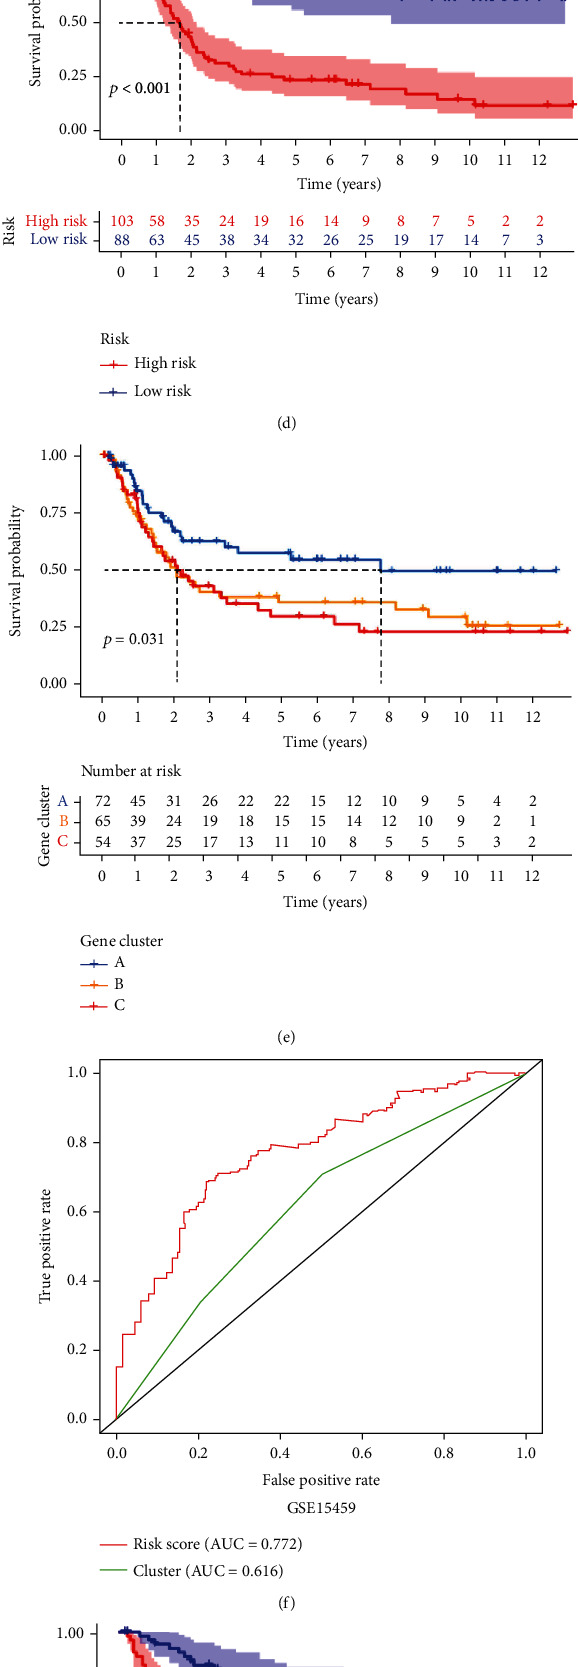
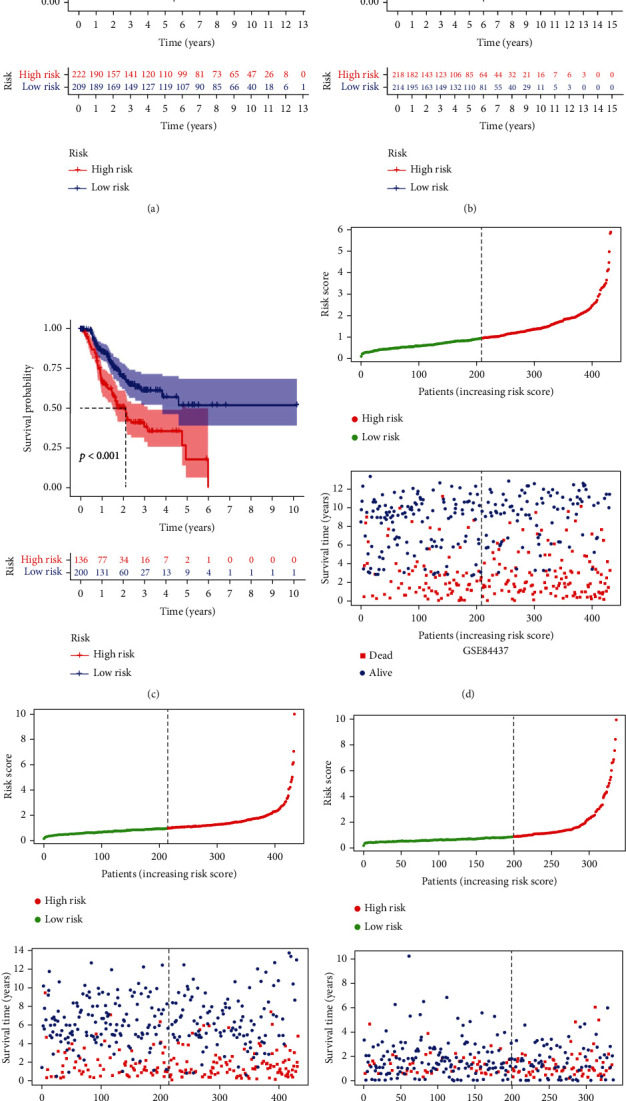
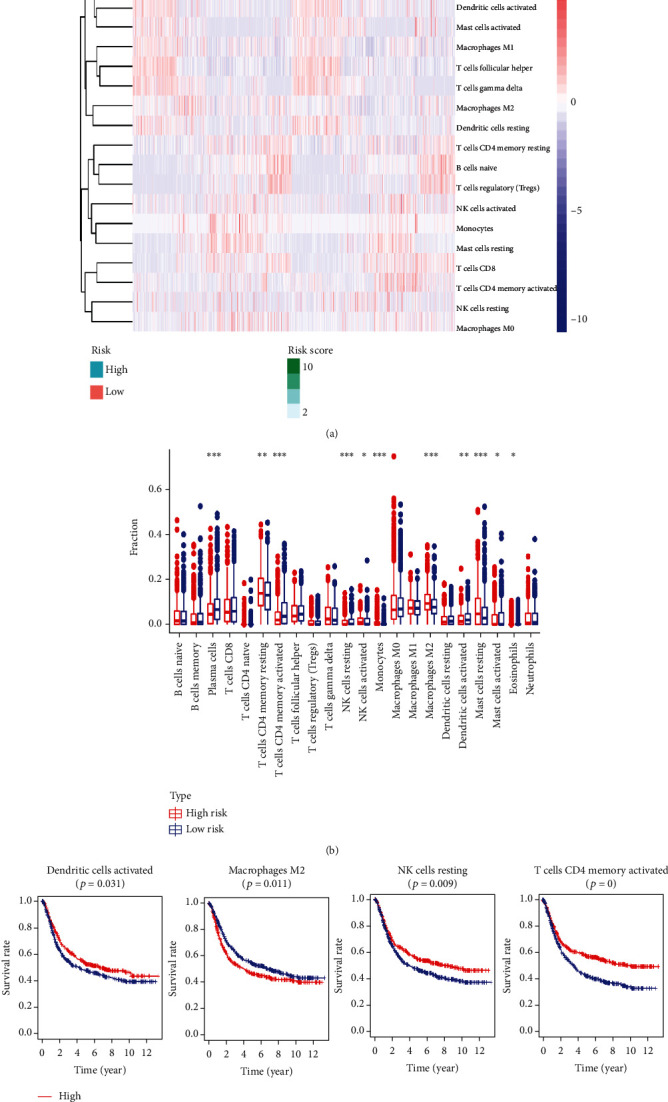
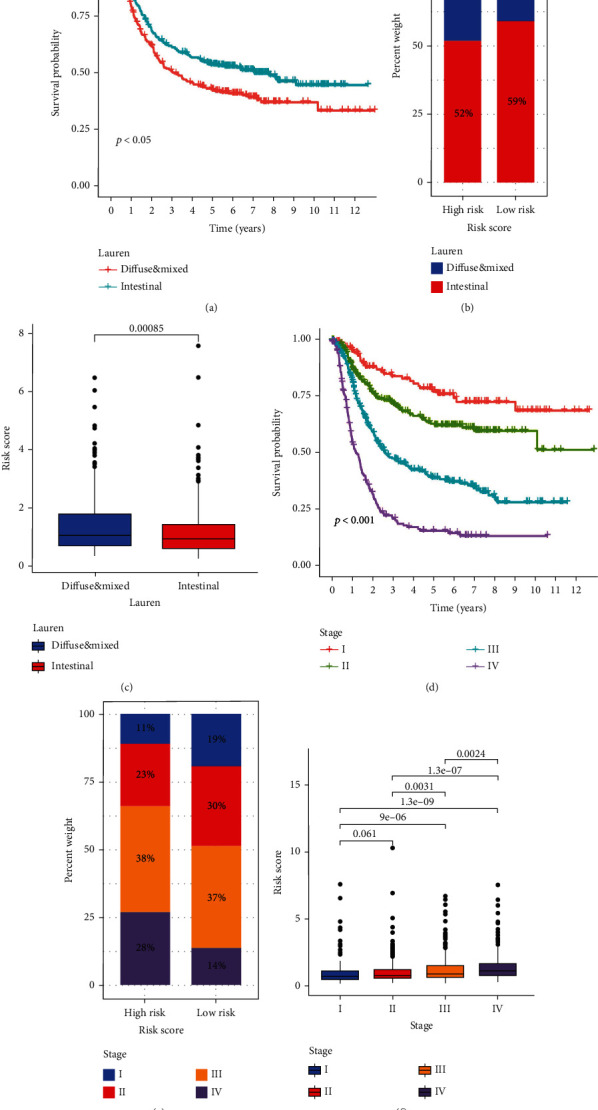
Background. An increasing number of reports have found that immune-related genes (IRGs) have a significant impact on the prognosis of a variety of cancers, but the prognostic value of IRGs in gastric cancer (GC) has not been fully elucidated. Methods. Univariate Cox regression analysis was adopted for the identification of prognostic IRGs in three independent cohorts (GSE62254,n=300; GSE15459,n=191; and GSE26901,n=109). After obtaining the intersecting prognostic genes, the three independent cohorts were merged into a training cohort (n=600) to establish a prognostic model. The risk score was determined using multivariate Cox and LASSO regression analyses. Patients were classified into low-risk and high-risk groups according to the median risk score. The risk score performance was validated externally in the three independent cohorts (GSE26253,n=432; GSE84437,n=431; and TCGA,n=336). Immune cell infiltration (ICI) was quantified by the CIBERSORT method. Results. A risk score comprising nine genes showed high accuracy for the prediction of the overall survival (OS) of patients with GC in the training cohort (AUC>0.7). The risk of death was found to have a positive correlation with the risk score. The univariate and multivariate Cox regression analyses revealed that the risk score was an independent indicator of the prognosis of patients with GC (p<0.001). External validation confirmed the universal applicability of the risk score. The low-risk group presented a lower infiltration level of M2 macrophages than the high-risk group (p<0.001), and the prognosis of patients with GC with a higher infiltration level of M2 macrophages was poor (p=0.011). According to clinical correlation analysis, compared with patients with the diffuse and mixed type of GC, those with the Lauren classification intestinal GC type had a significantly lower risk score (p=0.00085). The patients’ risk score increased with the progression of the clinicopathological stage. Conclusion. In this study, we constructed and validated a robust prognostic signature for GC, which may help improve the prognostic assessment system and treatment strategy for GC.
Overview
The claims and statistics of this paper haven’t been checked yet.
Run the check — free, no account needed. It reads the open-access text and checks the sources it cites.
Integrity signals
Registry
Cites
Statistics
Figures
Verification
Claims the paper makes
The claims and statistics of this paper haven’t been checked yet.
Run the check — free, no account needed. It reads the open-access text and checks the sources it cites.
Claims other papers make about this one
Each is checked against this paper’s own text: does it say what the citing paper says it does?
The cited source says what the claim attributes to it.
In the citing paper
“studies that evaluate the robustness to various data distributions through external validation inherently address the generalizability of the model19–22.”
From A scoping review of robustness concepts for machine learning in healthcare (2025) · cites this paper as [21]
Self-check
Percentages, sums and reported differences re-computed from the paper’s own numbers.
The self-check needs the paper’s full text.
Citations
Cites
No references could be resolved yet.
Research works printed but not linked: 47
- 10.3748/wjg.v12.i3.354 · DOI
- 10.1016/S0140-6736(16)30354-3 · DOI
- 10.1016/S0140-6736(09)60617-6 · DOI
- 10.1016/j.cgh.2019.07.045 · DOI
- 10.1111/jgh.15037 · DOI
- R. E. Sexton, 2020, Gastric cancer: a comprehensive review of current and future treatment strategies, Cancer and Metastasis Reviews, 1
- 10.3390/cancers12071981 · DOI
- H. R. Kazmi, 2018, Epigenetic mechanisms and events in gastric cancer-emerging novel biomarkers, Pathology & Oncology Research, 24, 757, 10.1007/s12253-018-0410-z · DOI
- W. Yang, 2017, Molecular mechanisms and theranostic potential of miRNAs in drug resistance of gastric cancer, Expert opinion on therapeutic targets, 21, 1063, 10.1080/14728222.2017.1389900 · DOI
- J. Wang, 2020, A novel prognostic signature of immune‐related genes for patients with colorectal cancer, Journal of cellular and molecular medicine, 24, 8491, 10.1111/jcmm.15443 · DOI
- B. Li, 2017, Development and validation of an individualized immune prognostic signature in early-stage nonsquamous non–small cell lung cancer, JAMA oncology, 3, 1529, 10.1001/jamaoncol.2017.1609 · DOI · Paper page
- J. Huo, 2020, Development and validation of a novel immune-gene pairs prognostic model associated with CTNNB1 alteration in hepatocellular carcinoma, Medical Science Monitor, 26
- 10.3389/fmolb.2020.581354 · DOI
- J. Huo, 2021, Eight-gene metabolic signature related with tumor-associated macrophages predicting overall survival for hepatocellular carcinoma, BMC cancer, 21, 1
- J. Huo, 2021, Development and validation of a CTNNB1‐associated metabolic prognostic model for hepatocellular carcinoma, Journal of Cellular and Molecular Medicine, 25, 1151, 10.1111/jcmm.16181 · DOI
- 10.1016/j.lfs.2020.118396 · DOI
- P. Charoentong, 2017, Pan-cancer immunogenomic analyses reveal genotype-immunophenotype relationships and predictors of response to checkpoint blockade, Cell reports, 18, 248, 10.1016/j.celrep.2016.12.019 · DOI · Paper page
- A. Jemal, 2011, Global cancer statistics, CA: a cancer journal for clinicians, 61, 69
- A. D. Wagner, 2017, Chemotherapy for advanced gastric cancer, Cochrane database of systematic reviews, 10.1002/14651858.CD004064.pub4 · DOI
- T. Sano, 2017, Proposal of a new stage grouping of gastric cancer for TNM classification: International Gastric Cancer Association staging project, Gastric cancer, 20, 217, 10.1007/s10120-016-0601-9 · DOI
- T. L. Whiteside, 2008, The tumor microenvironment and its role in promoting tumor growth, Oncogene, 27, 5904, 10.1038/onc.2008.271 · DOI · Paper page
- R. Kim, 2007, Cancer immunoediting: from immune surveillance to immune escape, 9, 10.1016/B978-012372551-6/50066-3 · DOI
- S. Yu, 2020, Seven-gene signature based on glycolysis is closely related to the prognosis and tumor immune infiltration of patients with gastric cancer, Frontiers in oncology, 10
- R. Cristescu, 2015, Molecular analysis of gastric cancer identifies subtypes associated with distinct clinical outcomes, Nature medicine, 21, 449, 10.1038/nm.3850 · DOI · Paper page
- S. C. Oh, 2018, Clinical and genomic landscape of gastric cancer with a mesenchymal phenotype, Nature communications, 9, 1
- S. Aras, 2017, TAMeless traitors: macrophages in cancer progression and metastasis, British journal of cancer, 117, 1583, 10.1038/bjc.2017.356 · DOI
- S. C. Ming, 1977, Gastric carcinoma: a pathobiological classification, Cancer, 39, 2475, 10.1002/1097-0142(197706)39:6<2475::AID-CNCR2820390626>3.0.CO;2-L · DOI
- M. Qiu, 2014, Lauren classification combined with HER2 status is a better prognostic factor in Chinese gastric cancer patients, BMC cancer, 14, 1
- J. Y. Lee, 2017, The characteristics and prognosis of diffuse-type early gastric cancer diagnosed during health check-ups, Gut and liver, 11, 807, 10.5009/gnl17033 · DOI
- H. Jung, 2011, Validation of the seventh edition of the American Joint Committee on Cancer TNM staging system for gastric cancer, Cancer, 117, 2371, 10.1002/cncr.25778 · DOI
- S. Zhang, 2021, Construction of an immune-related gene signature to predict survival and treatment outcome in gastric cancer, Science Progress, 104, 0036850421997286, 10.1177/0036850421997286 · DOI
- B. Jiang, 2019, An immune-related gene signature predicts prognosis of gastric cancer, Medicine, 98, 10.1097/MD.0000000000016273 · DOI
- E. Zhao, 2020, A signature of 14 immune-related gene pairs predicts overall survival in gastric cancer, Clinical and Translational Oncology, 1
- A. Etemadi, 2020, The global, regional, and national burden of stomach cancer in 195 countries, 1990–2017: a systematic analysis for the Global Burden of Disease study 2017, The Lancet Gastroenterology & Hepatology, 5, 42, 10.1016/S2468-1253(19)30328-0 · DOI
- H. Osumi, 2020, Tumor cell‐derived angiopoietin‐like protein 2 establishes a preference for glycolytic metabolism in lung cancer cells, Cancer science, 111, 1241, 10.1111/cas.14337 · DOI
- H. Horiguchi, 2020, Stroma-derived ANGPTL2 establishes an anti-tumor microenvironment during intestinal tumorigenesis, Oncogene, 1
- Y. W. Shen, 2020, Targeting CTGF in cancer: an emerging therapeutic opportunity
- Y. Cui, 2020, Pan-cancer analysis identifies ESM1 as a novel oncogene for esophageal cancer, Esophagus, 1
- 10.1155/2020/6909672 · DOI
- Y. Chen, 2020, Sox9/INHBB axis-mediated crosstalk between the hepatoma and hepatic stellate cells promotes the metastasis of hepatocellular carcinoma, Cancer Letters, 499, 243, 10.1016/j.canlet.2020.11.025 · DOI
- A. Dasgupta, 2020, SIRT1–NOX4 signaling axis regulates cancer cachexia, Journal of Experimental Medicine, 217, 10.1084/jem.20190745 · DOI
- K. Ford, 2020, NOX4 inhibition potentiates immunotherapy by overcoming cancer-associated fibroblast-mediated CD8 T-cell exclusion from tumors, Cancer research, 80, 1846, 10.1158/0008-5472.CAN-19-3158 · DOI · Paper page
- A. Sharanek, 2020, OSMR controls glioma stem cell respiration and confers resistance of glioblastoma to ionizing radiation, Nature communications, 11, 1, 10.1038/s41467-020-17885-z · DOI
- L. Gao, 2020, The RBP1–CKAP4 axis activates oncogenic autophagy and promotes cancer progression in oral squamous cell carcinoma, Cell death & disease, 11, 1
- Y. Zhang, 2021, Slit2 is a potential biomarker for renal impairment in systemic lupus erythematosus, Clinical and Experimental Medicine, 21, 63, 10.1007/s10238-020-00664-x · DOI
- B. Tavora, 2020, Tumoural activation of TLR3–SLIT2 axis in endothelium drives metastasis, Nature, 586, 299, 10.1038/s41586-020-2774-y · DOI
- Y. Zhou, 2020, Single-cell multiomics sequencing reveals prevalent genomic alterations in tumor stromal cells of human colorectal cancer, Cancer Cell, 38, 818, 10.1016/j.ccell.2020.09.015 · DOI
Cited by
A scoping review of robustness concepts for machine learning in healthcare
Balendran, A., Beji, C., Bouvier, F., Khalifa, O., Evgeniou, T., Ravaud, P., & Porcher, R. (2025) · npj Digital Medicine · doi:10.1038/s41746-024-01420-1 · Cited by 43
Metadata
- Authors
- Huo, J., Wu, L., & Zang, Y.
- Affiliations
- Qingdao University (CN)
- Affiliated Hospital of Qingdao University (CN)
- Corresponding author
- Wu, Liqun
- Venue
- Journal of Immunology Research
- Publisher
- Wiley
- Published
- 2021-04-30
- Volume
- 2021
- Pages
- 1-24
- ISSN
- 2314-7156 (ISSN-L)
- 2314-8861
- PMC
- PMC8110424
- OpenAlex
- W3157208801
- Cited by
- 16
- References
- 0
- Citations by year
- 2026: 2 · 2025: 2 · 2024: 1 · 2023: 5 · 2022: 4 · 2021: 2
- FWCI
- 2.60
- Type
- journal article
- Language
- en
- Open access
- gold
- doi.org
- Locations
- Journal of Immunology Research (publishedVersion, cc-by)
- PubMed Central (publishedVersion, cc-by)
- PubMed (publishedVersion)
- DOAJ (DOAJ: Directory of Open Access Journals) (submittedVersion, cc-by-sa)
- Topics
- Health Sciences › Medicine › Oncology › Gastric Cancer Management and Outcomes
- Life Sciences › Biochemistry, Genetics and Molecular Biology › Cancer Research › Ferroptosis and cancer prognosis
- Health Sciences › Medicine › Oncology › Cancer Immunotherapy and Biomarkers
- Keywords
- gastric cancer, immune-related genes, prognostic gene signature, risk score, overall survival, M2 macrophage infiltration, tumor immune cell infiltration, Lauren classification, clinicopathological stage, LASSO, Cox proportional hazards model
- MeSH terms
- Aged, Female, Humans, Male, Middle Aged, Neoplasm Staging, Risk Factors, Stomach Neoplasms, Biomarkers, Tumor, Cohort Studies, Gene Expression Regulation, Neoplastic, Risk Assessment, Gene Expression Profiling, Protein Interaction Mapping, Nomograms, Kaplan-Meier Estimate, Gene Regulatory Networks, Protein Interaction Maps, Datasets as Topic
About these checks
Registry, retraction, Cites and statistics results are computed, not judged, with one exception: a printed reference that no index lists is read once by a model before it counts as a citation error. Claims are extracted by a model and kept only when their quote appears verbatim in the text; each cited source is then checked, with a model’s help, for whether it says what the claim relies on. Those verdicts can be wrong — read the claim’s quote and the cited source before relying on one.
Statistics and arithmetic are recomputed, not judged.
Confidence bands are shown only for fields calibrated on our annotated test set. None is calibrated yet, so no band is shown.
What counts as a claim ›How we measure confidence ›How we check this ›
Are you an author, or do you see a problem with this page? Request a review
How to cite
Cite CoChat for the checks on this page, and the paper for its own findings.
- This page
- CoChat. (2026). Citation check: Development and Validation of a Robust Immune-Related Prognostic Signature for Gastric Cancer. https://app.cochat.ai/papers/10.1155/2021/5554342
- The paper
- Huo, J., Wu, L., & Zang, Y. (2021). Development and Validation of a Robust Immune-Related Prognostic Signature for Gastric Cancer. Journal of Immunology Research. https://doi.org/10.1155/2021/5554342
Data sources
Bibliographic data: Semantic Scholar, OpenAlex, Crossref.
Contains information from the Semantic Scholar Academic Graph Datasets, made available under the ODC Attribution License (ODC-BY 1.0).
Semantic Scholar’s data is described in: Kinney, R., et al. (2023). The Semantic Scholar Open Data Platform. arXiv:2301.10140.
