Cited by 1RNA Research and SplicingSarcoma Diagnosis and TreatmentRNA modifications and cancer

The DOI matches its Crossref record; 6 of the 6 references it cites were found in a registry or an index.

TENT5A Maintains MYC mRNA Stability to Enhance Osteosarcoma Stemness

Open access

Published version of a preprint

Abstract

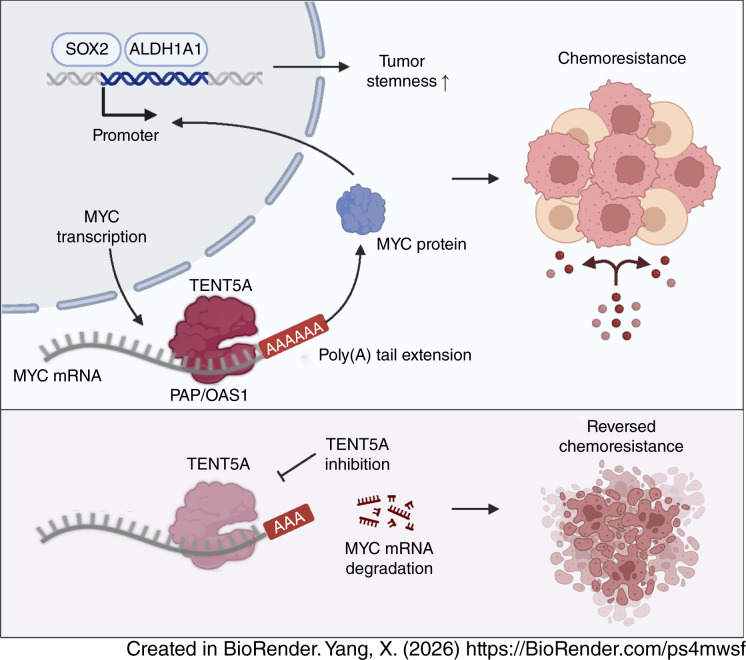
MYC genomic amplification and pathway activation are associated with aggressive behavior and poor prognosis in osteosarcoma. However, a discordance exists between copy-number gains and transcriptional output from MYC in osteosarcoma, and defining these mechanisms is critical to understanding and intercepting persistent MYC signaling. In this study, we showed that cytoplasmic mRNA poly(A) sustains MYC activation in osteosarcoma. Multiomics profiling and single-cell transcriptomics identified TENT5A, a noncanonical RNA-binding poly(A) polymerase, as selectively upregulated in MYC-activated tumors and enriched in proliferative, stem-like populations. Biochemical and genetic evidence demonstrated that TENT5A directly bound MYC mRNA via its PAP/OAS1 domain, extended its poly(A) tail, and stabilized the transcript, thereby reinforcing MYC-driven stemness and chemoresistance. Gain- and loss-of-function assays, orthotopic xenografts, and patient-derived organoids confirmed that elevated TENT5A enhanced tumor-initiating capacity and reduced chemotherapy sensitivity. Pharmacologic inhibition of TENT5A disrupted MYC mRNA stabilization, shortened poly(A) tails, and reversed chemoresistance in preclinical models. These findings delineate a posttranscriptional RNA stabilization pathway that reconciles the disconnect between MYC genetic alterations and transcriptional activity and nominate the RNA-binding protein TENT5A as a therapeutically tractable target in osteosarcoma. Significance: Enhanced MYC mRNA stability mediated by TENT5A-induced poly(A) elongation supports cancer stem cell maintenance in osteosarcoma, highlighting TENT5A inhibition as a potential strategy to block MYC activity in cancer.

Overview

The claims and statistics of this paper haven’t been checked yet.

Run the check — free, no account needed. It reads the open-access text and checks the sources it cites.

A few free checks a day · papers already verified open instantly · results are public

Integrity signals

Registry

Crossref · 10.1158/0008-5472.can-25-4635

Cites

6 of 6 references verified0 citation errors · 0 not checkable

Statistics

Figures

Graphical abstract
Graphical abstract CC BY-NC-ND · PubMed Central
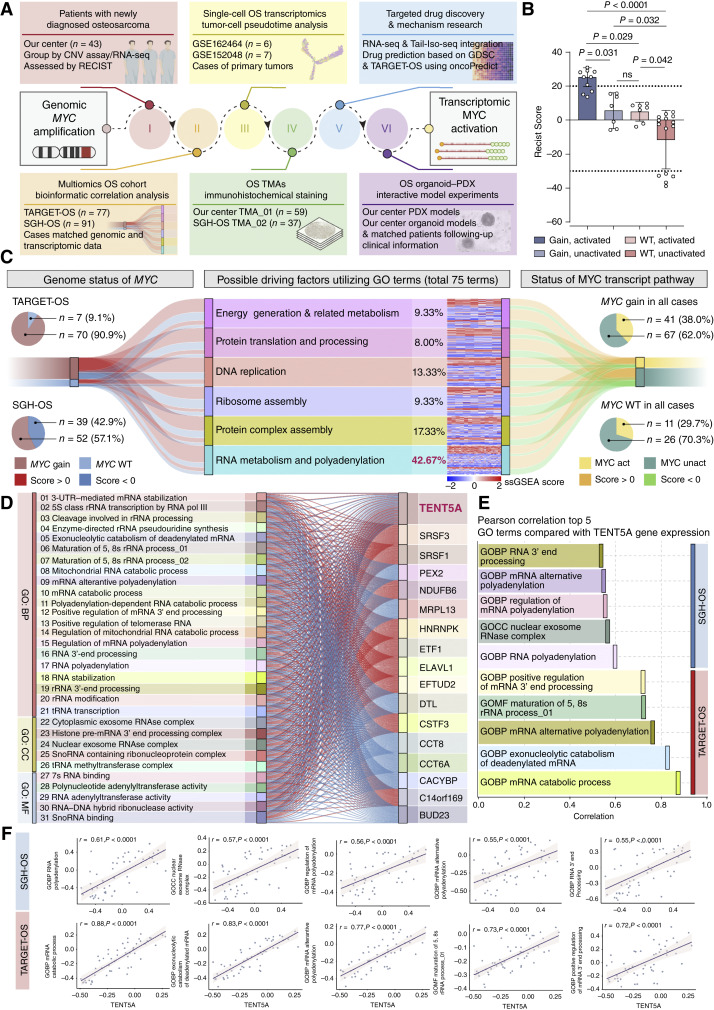
Figure 1. Integrated analysis identifies TENT5A-mediated RNA polyadenylation as a key regulator of MYC activation in osteosarcoma. A, Overview of the integrative workflow spanning six modules: clinical cohort profiling, single-cell pseudotime analysis, transcriptomic and genomic integration, TMA validation, drug-sensitivity prediction, and functional assessment in PDX and organoid models. CNV, copy-number variation. B, Box plots of RECIST version 1.1 scores stratified by MYC genomic status and pathway activation. Significance was determined by one-way ANOVA; ns, not significant. C, Sankey diagram illustrating GO pathways associated with MYC genomic status (gain vs. WT) and transcriptional activation, based on TARGET-OS and SGH-OS datasets. ssGSEA, single-sample GSEA. D, Sankey diagram highlighting RNA metabolism-related GO terms and the correlation network among enriched genes. E and F, Bar and scatter plots showing Pearson correlations between TENT5A expression and the top five RNA metabolism– and polyadenylation-related GO terms in TARGET-OS and SGH-OS datasets. OS, osteosarcoma; GOMF, Gene Ontology Molecular Function.
Figure 1. Integrated analysis identifies TENT5A-mediated RNA polyadenylation as a key regulator of MYC activation in osteosarcoma. A, Overview of the integrative workflow spanning six modules: clinical cohort profiling, single-cell pseudotime analysis, transcriptomic and genomic integration, TMA validation, drug-sensitivity prediction, and functional assessment in PDX and organoid models. CNV, copy-number variation. B, Box plots of RECIST version 1.1 scores stratified by MYC genomic status and pathway activation. Significance was determined by one-way ANOVA; ns, not significant. C, Sankey diagram illustrating GO pathways associated with MYC genomic status (gain vs. WT) and transcriptional activation, based on TARGET-OS and SGH-OS datasets. ssGSEA, single-sample GSEA. D, Sankey diagram highlighting RNA metabolism-related GO terms and the correlation network among enriched genes. E and F, Bar and scatter plots showing Pearson correlations between TENT5A expression and the top five RNA metabolism– and polyadenylation-related GO terms in TARGET-OS and SGH-OS datasets. OS, osteosarcoma; GOMF, Gene Ontology Molecular Function.CC BY-NC-ND · PubMed Central
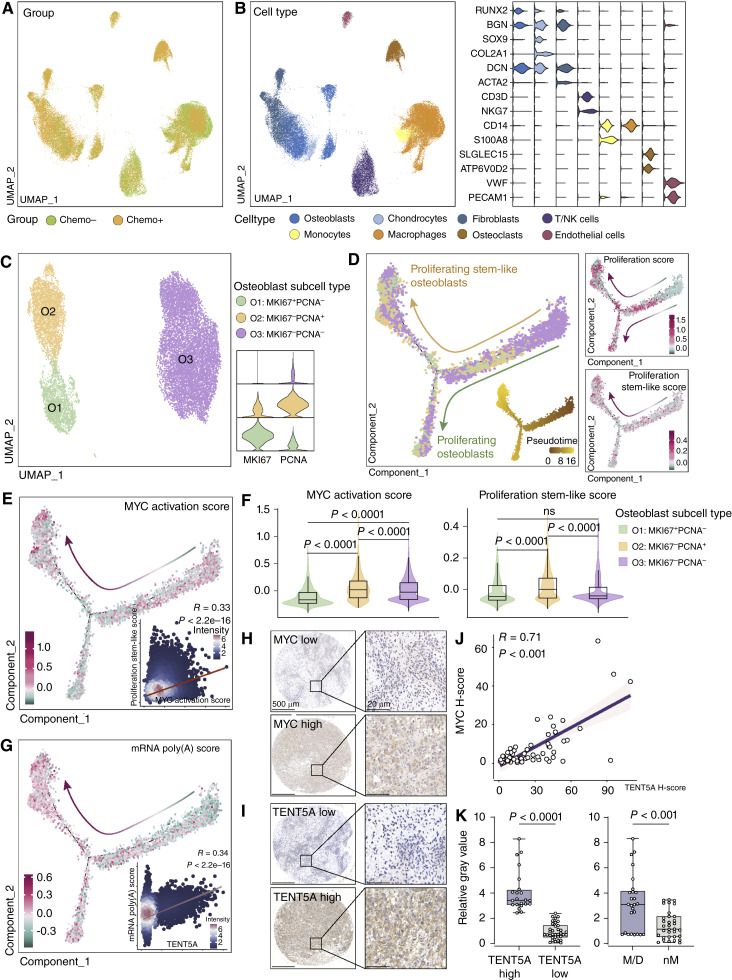
Figure 2. mRNA polyadenylation–mediated MYC activation sustains stemness in proliferative osteosarcoma cells. A, Uniform Manifold Approximation and Projection (UMAP) visualization of osteosarcoma cell populations stratified by chemotherapy response. Chemo−, chemo-sensitive; Chemo+, chemoresistant. B, UMAP visualization of distinct osteosarcoma cell type clusters with accompanying violin plots showing marker gene expression. C, Identification of osteoblast subtypes (O1, O2, O3) based on MKI67 and PCNA expression, with violin plots illustrating subtype-specific expression levels. D, Pseudotime trajectory of osteoblast differentiation, highlighting proliferating stem-like (O2) and proliferating nonstem (O3) subpopulations. Associated scatter plots show proliferation and stemness scores along the trajectory. E, Pseudotime trajectory of MYC activation scores, with an inset scatter plot showing the Pearson correlation between MYC activation and stem-like proliferation scores. F, Violin plots of MYC activation and stem-like proliferation scores across osteoblast subtypes. Statistical significance was determined by one-way ANOVA. ns, not significant. G, Trajectory of mRNA polyadenylation scores during pseudotime, with an inset scatter plot showing the Pearson correlation with TENT5A expression. H–J, Representative IHC images of MYC and TENT5A in matched TMAs (SGH-OS cohort), with a scatter plot showing the Pearson correlation between TENT5A and MYC protein expression (H-scores). Scale bars, 500 μm (left) and 20 μm (right). K, Box plots of TENT5A protein expression (high vs. low H-score) vs. clinical outcomes. M/D, metastasis or death; nM, nonmetastasis and alive. Data are presented as mean ± SEM. Statistical significance was determined by Student t test.
Figure 2. mRNA polyadenylation–mediated MYC activation sustains stemness in proliferative osteosarcoma cells. A, Uniform Manifold Approximation and Projection (UMAP) visualization of osteosarcoma cell populations stratified by chemotherapy response. Chemo−, chemo-sensitive; Chemo+, chemoresistant. B, UMAP visualization of distinct osteosarcoma cell type clusters with accompanying violin plots showing marker gene expression. C, Identification of osteoblast subtypes (O1, O2, O3) based on MKI67 and PCNA expression, with violin plots illustrating subtype-specific expression levels. D, Pseudotime trajectory of osteoblast differentiation, highlighting proliferating stem-like (O2) and proliferating nonstem (O3) subpopulations. Associated scatter plots show proliferation and stemness scores along the trajectory. E, Pseudotime trajectory of MYC activation scores, with an inset scatter plot showing the Pearson correlation between MYC activation and stem-like proliferation scores. F, Violin plots of MYC activation and stem-like proliferation scores across osteoblast subtypes. Statistical significance was determined by one-way ANOVA. ns, not significant. G, Trajectory of mRNA polyadenylation scores during pseudotime, with an inset scatter plot showing the Pearson correlation with TENT5A expression. H–J, Representative IHC images of MYC and TENT5A in matched TMAs (SGH-OS cohort), with a scatter plot showing the Pearson correlation between TENT5A and MYC protein expression (H-scores). Scale bars, 500 μm (left) and 20 μm (right). K, Box plots of TENT5A protein expression (high vs. low H-score) vs. clinical outcomes. M/D, metastasis or death; nM, nonmetastasis and alive. Data are presented as mean ± SEM. Statistical significance was determined by Student t test.CC BY-NC-ND · PubMed Central
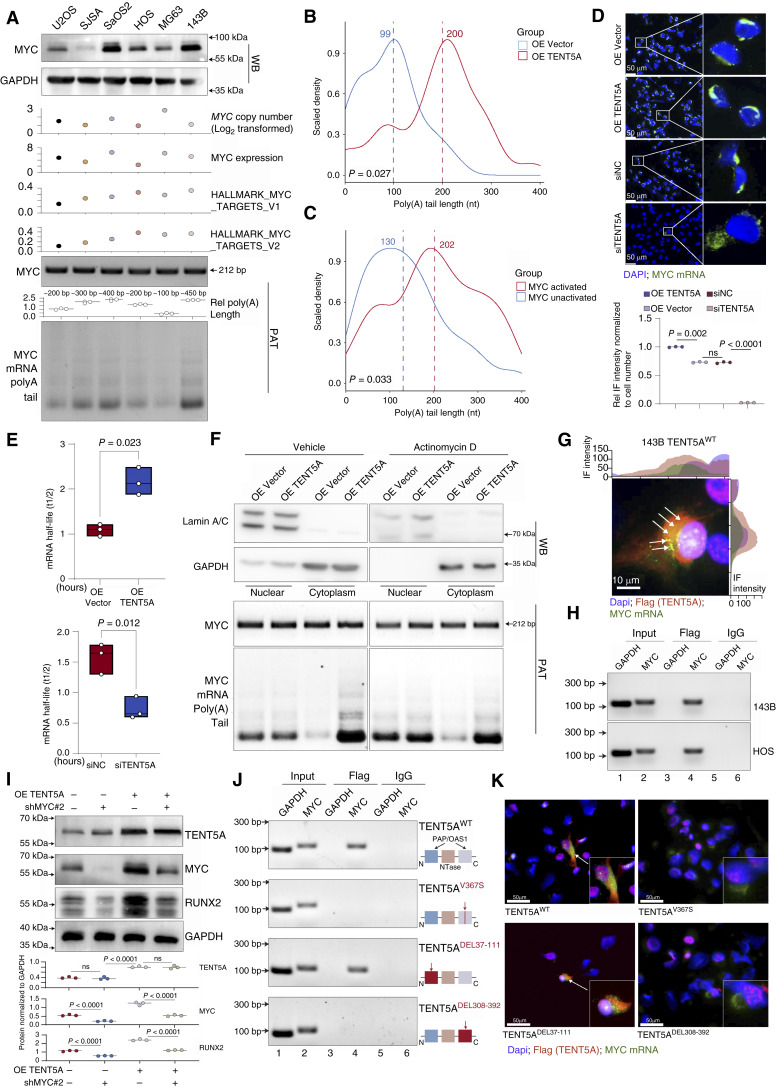
Figure 3. TENT5A-mediated mRNA polyadenylation promotes MYC mRNA stability in osteosarcoma cells. A, Western blot of MYC and GAPDH in six osteosarcoma cell lines (U2OS, SJSA, Saos-2, HOS, MG63, and 143B). Corresponding MYC DNA copy number (log2-transformed), mRNA expression (FPKM), and enrichment scores for HALLMARK_MYC_TARGETS_V1/V2 retrieved from the CCLE database. Bottom, PAT assay of MYC mRNA (∼212 bp amplicon) with quantification. B and C, Tail Iso-seq profiling of MYC mRNA poly(A) length in patient samples (MYC-activated vs. MYC-unactivated, n = 3 each; B) and in TENT5A-overexpressing (OE TENT5A) vs. vector control cells (C). Median poly(A) length is indicated. P values are from Wilcoxon tests. D, Representative RNA-FISH images of MYC mRNA (green) in cells with OE TENT5A or siTENT5A knockdown. Significance by two-way ANOVA. n = 3 technical replicates for each strain. ns, not significant. E, MYC mRNA decay kinetics after actinomycin D treatment (0–4 hours) in OE TENT5A vs. vector and siTENT5A vs. siNC cells. Half-lives (t1/2) were calculated from linear regression. Data are presented as mean ± SEM. Statistical significance was assessed by two-way ANOVA. n = 3 technical replicates for each strain. F, Subcellular fractionation in OE TENT5A and vector control cells treated with vehicle or ActD (2 hours). Top, Western blot (WB) for lamin A/C (nuclear), GAPDH (cytoplasmic), and MYC protein. Bottom, PAT assay on nuclear and cytoplasmic RNA showing MYC mRNA poly(A) tail length with quantification analysis. Statistical significance was assessed by two-way ANOVA. n = 3 technical replicates for each strain. G, RNA-FISH and IF showing colocalization of TENT5A-3xFlag (red) and MYC mRNA (green). Scale bars, 10 μm. Fluorescence intensity profiles are shown. n = 3 biological replicates for each strain. H, RIP-PCR detecting TENT5A–MYC mRNA interaction in 143B and HOS cells expressing TENT5A-3xFlag. n = 3 technical replicates for each strain. I, Western blot of TENT5A, MYC, and RUNX2 after OE TENT5A and MYC knockdown. Quantification is shown as mean ± SEM. Statistical significance was assessed by one-way ANOVA. n = 3 technical replicates for each strain. J, RIP-PCR assays assessing MYC mRNA binding specificity to exogenous TENT5A mutants with 3xFlag tag (TENT5ADEL37-111, TENT5ADEL308-392, and TENT5AV367S) compared with WT TENT5A (OE TENT5A-3xFlag, TENT5AWT) in osteosarcoma cells. n = 3 technical replicates for each strain. K, RNA-FISH/IF showing colocalization of MYC mRNA with TENT5A mutants (DEL37-111, DEL308-392) or point mutant (V367S), compared with WT TENT5A (OE TENT5A-3xFlag). Scale bars, 50 μm. Corresponding fluorescence intensity profiles are shown. n = 3 technical replicates for each strain.
Figure 3. TENT5A-mediated mRNA polyadenylation promotes MYC mRNA stability in osteosarcoma cells. A, Western blot of MYC and GAPDH in six osteosarcoma cell lines (U2OS, SJSA, Saos-2, HOS, MG63, and 143B). Corresponding MYC DNA copy number (log2-transformed), mRNA expression (FPKM), and enrichment scores for HALLMARK_MYC_TARGETS_V1/V2 retrieved from the CCLE database. Bottom, PAT assay of MYC mRNA (∼212 bp amplicon) with quantification. B and C, Tail Iso-seq profiling of MYC mRNA poly(A) length in patient samples (MYC-activated vs. MYC-unactivated, n = 3 each; B) and in TENT5A-overexpressing (OE TENT5A) vs. vector control cells (C). Median poly(A) length is indicated. P values are from Wilcoxon tests. D, Representative RNA-FISH images of MYC mRNA (green) in cells with OE TENT5A or siTENT5A knockdown. Significance by two-way ANOVA. n = 3 technical replicates for each strain. ns, not significant. E, MYC mRNA decay kinetics after actinomycin D treatment (0–4 hours) in OE TENT5A vs. vector and siTENT5A vs. siNC cells. Half-lives (t1/2) were calculated from linear regression. Data are presented as mean ± SEM. Statistical significance was assessed by two-way ANOVA. n = 3 technical replicates for each strain. F, Subcellular fractionation in OE TENT5A and vector control cells treated with vehicle or ActD (2 hours). Top, Western blot (WB) for lamin A/C (nuclear), GAPDH (cytoplasmic), and MYC protein. Bottom, PAT assay on nuclear and cytoplasmic RNA showing MYC mRNA poly(A) tail length with quantification analysis. Statistical significance was assessed by two-way ANOVA. n = 3 technical replicates for each strain. G, RNA-FISH and IF showing colocalization of TENT5A-3xFlag (red) and MYC mRNA (green). Scale bars, 10 μm. Fluorescence intensity profiles are shown. n = 3 biological replicates for each strain. H, RIP-PCR detecting TENT5A–MYC mRNA interaction in 143B and HOS cells expressing TENT5A-3xFlag. n = 3 technical replicates for each strain. I, Western blot of TENT5A, MYC, and RUNX2 after OE TENT5A and MYC knockdown. Quantification is shown as mean ± SEM. Statistical significance was assessed by one-way ANOVA. n = 3 technical replicates for each strain. J, RIP-PCR assays assessing MYC mRNA binding specificity to exogenous TENT5A mutants with 3xFlag tag (TENT5ADEL37-111, TENT5ADEL308-392, and TENT5AV367S) compared with WT TENT5A (OE TENT5A-3xFlag, TENT5AWT) in osteosarcoma cells. n = 3 technical replicates for each strain. K, RNA-FISH/IF showing colocalization of MYC mRNA with TENT5A mutants (DEL37-111, DEL308-392) or point mutant (V367S), compared with WT TENT5A (OE TENT5A-3xFlag). Scale bars, 50 μm. Corresponding fluorescence intensity profiles are shown. n = 3 technical replicates for each strain.CC BY-NC-ND · PubMed Central
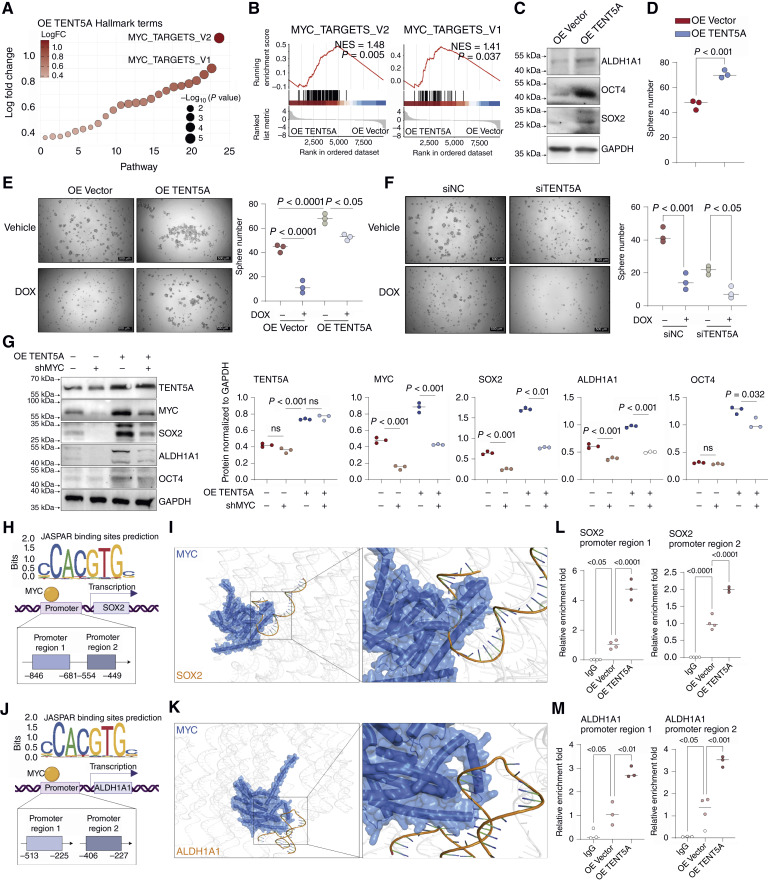
Figure 4. TENT5A facilitates MYC binding to SOX2 and ALDH1A1 promoters to promote osteosarcoma cell stemness. A, GSVA analysis identifying Hallmark gene sets significantly upregulated in osteosarcoma cells upon OE TENT5A (OE TENT5A). B, GSEA plots demonstrating enrichment of MYC target signatures (MYC_TARGETS_V1/V2) in TENT5A-overexpressing cells. C, Western blot analysis of stemness markers (ALDH1A1, OCT4, SOX2) upon OE TENT5A. n = 3 biological replicates for each strain. D, Tumorsphere assay showing increased sphere formation after OE TENT5A. Data are presented as mean ± SEM; significance by Student t test. E and F, Sphere formation assays under DOX treatment following OE TENT5A (E) or knockdown (F), with quantification. Data are presented as mean ± SEM; significance was determined by one-way ANOVA. n = 3 biological replicates for each strain. G, Protein expression of TENT5A, MYC, SOX2, ALDH1A1, and OCT4 in osteosarcoma cells upon OE TENT5A and MYC knockdown. Quantification data are shown as mean ± SEM. Statistical significance was assessed by one-way ANOVA. n = 3 technical replicates for each strain. H and J, Predicted MYC binding sites on SOX2 (H) and ALDH1A1 (J) promoters, identified by JASPAR. I and K, AlphaFold3-based structural models illustrating interactions between MYC protein and promoter DNA sequences of SOX2 (I) and ALDH1A1 (K). L and M, CUT&Tag assays showing MYC enrichment at SOX2 (L) and ALDH1A1 (M) promoter regions upon OE TENT5A in osteosarcoma cells. Data presented as mean ± SEM. Statistical significance was assessed by one-way ANOVA. n = 3 technical replicates for each strain.
Figure 4. TENT5A facilitates MYC binding to SOX2 and ALDH1A1 promoters to promote osteosarcoma cell stemness. A, GSVA analysis identifying Hallmark gene sets significantly upregulated in osteosarcoma cells upon OE TENT5A (OE TENT5A). B, GSEA plots demonstrating enrichment of MYC target signatures (MYC_TARGETS_V1/V2) in TENT5A-overexpressing cells. C, Western blot analysis of stemness markers (ALDH1A1, OCT4, SOX2) upon OE TENT5A. n = 3 biological replicates for each strain. D, Tumorsphere assay showing increased sphere formation after OE TENT5A. Data are presented as mean ± SEM; significance by Student t test. E and F, Sphere formation assays under DOX treatment following OE TENT5A (E) or knockdown (F), with quantification. Data are presented as mean ± SEM; significance was determined by one-way ANOVA. n = 3 biological replicates for each strain. G, Protein expression of TENT5A, MYC, SOX2, ALDH1A1, and OCT4 in osteosarcoma cells upon OE TENT5A and MYC knockdown. Quantification data are shown as mean ± SEM. Statistical significance was assessed by one-way ANOVA. n = 3 technical replicates for each strain. H and J, Predicted MYC binding sites on SOX2 (H) and ALDH1A1 (J) promoters, identified by JASPAR. I and K, AlphaFold3-based structural models illustrating interactions between MYC protein and promoter DNA sequences of SOX2 (I) and ALDH1A1 (K). L and M, CUT&Tag assays showing MYC enrichment at SOX2 (L) and ALDH1A1 (M) promoter regions upon OE TENT5A in osteosarcoma cells. Data presented as mean ± SEM. Statistical significance was assessed by one-way ANOVA. n = 3 technical replicates for each strain.CC BY-NC-ND · PubMed Central
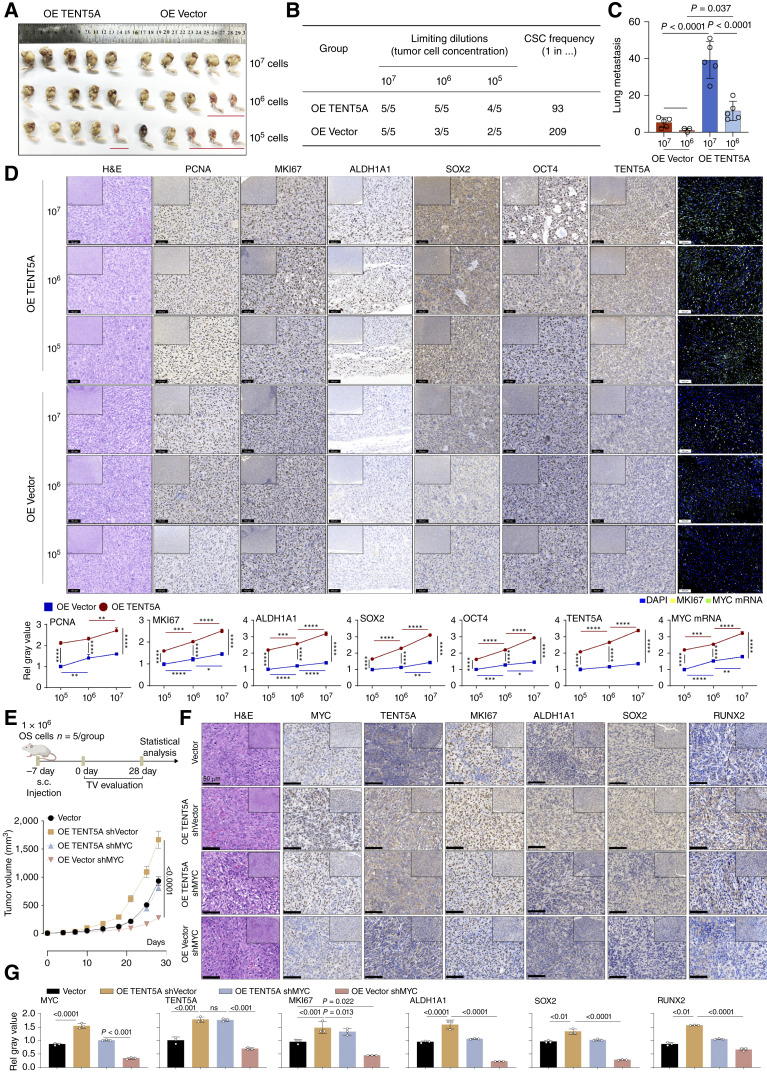
Figure 5. TENT5A enhances the tumor-initiating capacity of osteosarcoma cells in vivo. A, Limiting-dilution orthotopic tibial xenograft assays (107, 106, 105 cells) comparing tumor initiation after OE TENT5A vs. vector control (OE Vector). n = 5 for each group. B, Summary of tumor formation frequency and estimated CSC frequency from limiting-dilution analyses. C, Quantification of lung metastasis frequency in orthotopic xenografts injected with OE TENT5A or OE Vector cells (107 and 106 cells). Data are presented as mean ± SEM. D, Histopathologic analysis and IHC (PCNA, MKI67, ALDH1A1, SOX2, OCT4, and TENT5A) and RNA-FISH for MYC mRNA of orthotopic tibia models (OE TENT5A and OE Vector). Quantifications (mean ± SEM) are shown to the right. E, Experimental design and tumor growth curves of subcutaneous xenografts with OE TENT5A (OE TENT5A) and/or shMYC. Data are presented as mean ± SEM. n = 5 for each group. TV, tumor volume. F, Histopathologic analysis and IHC (MYC, TENT5A, MKI67, ALDH1A1, SOX2, and RUNX2) of subcutaneous osteosarcoma models (OE TENT5A and MYC knockdown). Scale bar, 100 μm. G, Quantification of IHC staining (mean ± SEM; MYC, TENT5A, MKI67, ALDH1A1, SOX2, and RUNX2) of subcutaneous osteosarcoma models (OE TENT5A and MYC knockdown). n = 3 technical replicates for each strain. C, Significance was assessed by one-way ANOVA; D and G, statistical significance was assessed by two-way ANOVA. ns, not significant; *, P < 0.05; **, P < 0.01; ***, P < 0.001; ****, P < 0.0001. H&E, hematoxylin and eosin.
Figure 5. TENT5A enhances the tumor-initiating capacity of osteosarcoma cells in vivo. A, Limiting-dilution orthotopic tibial xenograft assays (107, 106, 105 cells) comparing tumor initiation after OE TENT5A vs. vector control (OE Vector). n = 5 for each group. B, Summary of tumor formation frequency and estimated CSC frequency from limiting-dilution analyses. C, Quantification of lung metastasis frequency in orthotopic xenografts injected with OE TENT5A or OE Vector cells (107 and 106 cells). Data are presented as mean ± SEM. D, Histopathologic analysis and IHC (PCNA, MKI67, ALDH1A1, SOX2, OCT4, and TENT5A) and RNA-FISH for MYC mRNA of orthotopic tibia models (OE TENT5A and OE Vector). Quantifications (mean ± SEM) are shown to the right. E, Experimental design and tumor growth curves of subcutaneous xenografts with OE TENT5A (OE TENT5A) and/or shMYC. Data are presented as mean ± SEM. n = 5 for each group. TV, tumor volume. F, Histopathologic analysis and IHC (MYC, TENT5A, MKI67, ALDH1A1, SOX2, and RUNX2) of subcutaneous osteosarcoma models (OE TENT5A and MYC knockdown). Scale bar, 100 μm. G, Quantification of IHC staining (mean ± SEM; MYC, TENT5A, MKI67, ALDH1A1, SOX2, and RUNX2) of subcutaneous osteosarcoma models (OE TENT5A and MYC knockdown). n = 3 technical replicates for each strain. C, Significance was assessed by one-way ANOVA; D and G, statistical significance was assessed by two-way ANOVA. ns, not significant; *, P < 0.05; **, P < 0.01; ***, P < 0.001; ****, P < 0.0001. H&E, hematoxylin and eosin.CC BY-NC-ND · PubMed Central
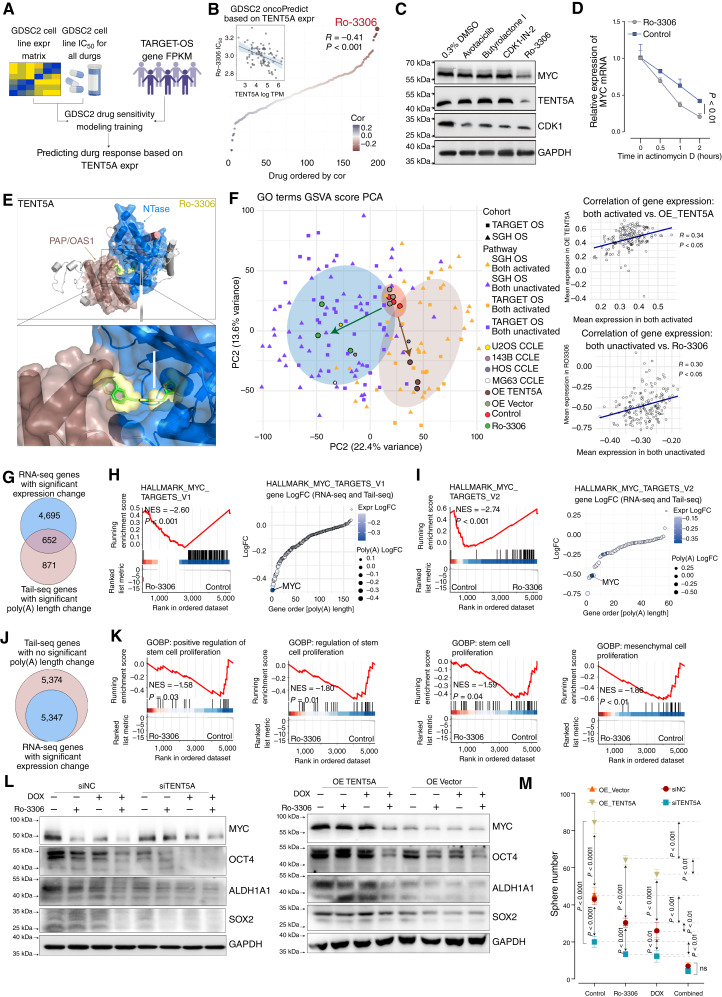
Figure 6. Pharmacologic inhibition of TENT5A-mediated MYC mRNA stability suppresses osteosarcoma stemness and enhances chemotherapy response. A, Schematic of drug sensitivity prediction workflow using the CCLE, GDSC2, and TARGET-OS databases based on TENT5A gene expression. B, Drug sensitivity analysis correlating TENT5A expression with drug IC50 values from the CCLE database, along with the Pearson correlation of Ro-3306 IC50 and TENT5A expression. TPM, transcripts per million. C, Western blot analysis of CDK1, MYC, and TENT5A expression following treatment with representative inhibitors. n = 3 technical replicates for each strain. D, qRT-PCR analysis of MYC mRNA decay dynamics after treatment. Data are shown as mean ± SEM. Statistical significance was assessed by two-way ANOVA. n = 3 technical replicates for each strain. E, AlphaFold3-predicted structure showing interactions between Ro-3306 and TENT5A, along with the specific domain of TENT5A. F, Principal component (PC) analysis (PCA) of GSVA scores based on GO terms across various osteosarcoma datasets, osteosarcoma cell lines, OE TENT5A osteosarcoma cells, and Ro-3306 (0.5 μmol/L)-treated osteosarcoma cells. Scatter plots show Pearson correlations comparing MYC-pathway activation with OE TENT5A and MYC pathway inactivation with Ro-3306 treatment. G and J, Venn diagrams showing overlapping genes significantly altered in poly(A) tail length (Tail Iso-seq) and gene expression (RNA-seq) following Ro-3306 treatment. H and I, Transcriptomic analysis of Ro-3306–treated (0.5 μmol/L) cells, using GSEA and GSVA analysis on Hallmark gene sets, along with changes in poly(A) tail length and gene expression. LogFC, log fold change. K, Transcriptomic pathway analysis of cells with Ro-3306 (0.5 μmol/L) treatment, using GSEA on GOBP gene sets. L, Western blot analysis of MYC, OCT4, ALDH1A1, and SOX2 expression in osteosarcoma cells with OE TENT5A or knockdown treated with Ro-3306 (0.5 μmol/L) and DOX (40 nmol/L). n = 3 technical replicates from 5 biological replicates for each strain. M, Sphere formation assay assessing osteosarcoma stemness in OE TENT5A or knockdown osteosarcoma cells combined with Ro-3306 (0.5 μmol/L) and DOX (40 nmol/L) treatment. Data are presented as mean ± SEM. Statistical significance was assessed by two-way ANOVA. n = 3 technical replicates from five biological replicates for each strain.
Figure 6. Pharmacologic inhibition of TENT5A-mediated MYC mRNA stability suppresses osteosarcoma stemness and enhances chemotherapy response. A, Schematic of drug sensitivity prediction workflow using the CCLE, GDSC2, and TARGET-OS databases based on TENT5A gene expression. B, Drug sensitivity analysis correlating TENT5A expression with drug IC50 values from the CCLE database, along with the Pearson correlation of Ro-3306 IC50 and TENT5A expression. TPM, transcripts per million. C, Western blot analysis of CDK1, MYC, and TENT5A expression following treatment with representative inhibitors. n = 3 technical replicates for each strain. D, qRT-PCR analysis of MYC mRNA decay dynamics after treatment. Data are shown as mean ± SEM. Statistical significance was assessed by two-way ANOVA. n = 3 technical replicates for each strain. E, AlphaFold3-predicted structure showing interactions between Ro-3306 and TENT5A, along with the specific domain of TENT5A. F, Principal component (PC) analysis (PCA) of GSVA scores based on GO terms across various osteosarcoma datasets, osteosarcoma cell lines, OE TENT5A osteosarcoma cells, and Ro-3306 (0.5 μmol/L)-treated osteosarcoma cells. Scatter plots show Pearson correlations comparing MYC-pathway activation with OE TENT5A and MYC pathway inactivation with Ro-3306 treatment. G and J, Venn diagrams showing overlapping genes significantly altered in poly(A) tail length (Tail Iso-seq) and gene expression (RNA-seq) following Ro-3306 treatment. H and I, Transcriptomic analysis of Ro-3306–treated (0.5 μmol/L) cells, using GSEA and GSVA analysis on Hallmark gene sets, along with changes in poly(A) tail length and gene expression. LogFC, log fold change. K, Transcriptomic pathway analysis of cells with Ro-3306 (0.5 μmol/L) treatment, using GSEA on GOBP gene sets. L, Western blot analysis of MYC, OCT4, ALDH1A1, and SOX2 expression in osteosarcoma cells with OE TENT5A or knockdown treated with Ro-3306 (0.5 μmol/L) and DOX (40 nmol/L). n = 3 technical replicates from 5 biological replicates for each strain. M, Sphere formation assay assessing osteosarcoma stemness in OE TENT5A or knockdown osteosarcoma cells combined with Ro-3306 (0.5 μmol/L) and DOX (40 nmol/L) treatment. Data are presented as mean ± SEM. Statistical significance was assessed by two-way ANOVA. n = 3 technical replicates from five biological replicates for each strain.CC BY-NC-ND · PubMed Central
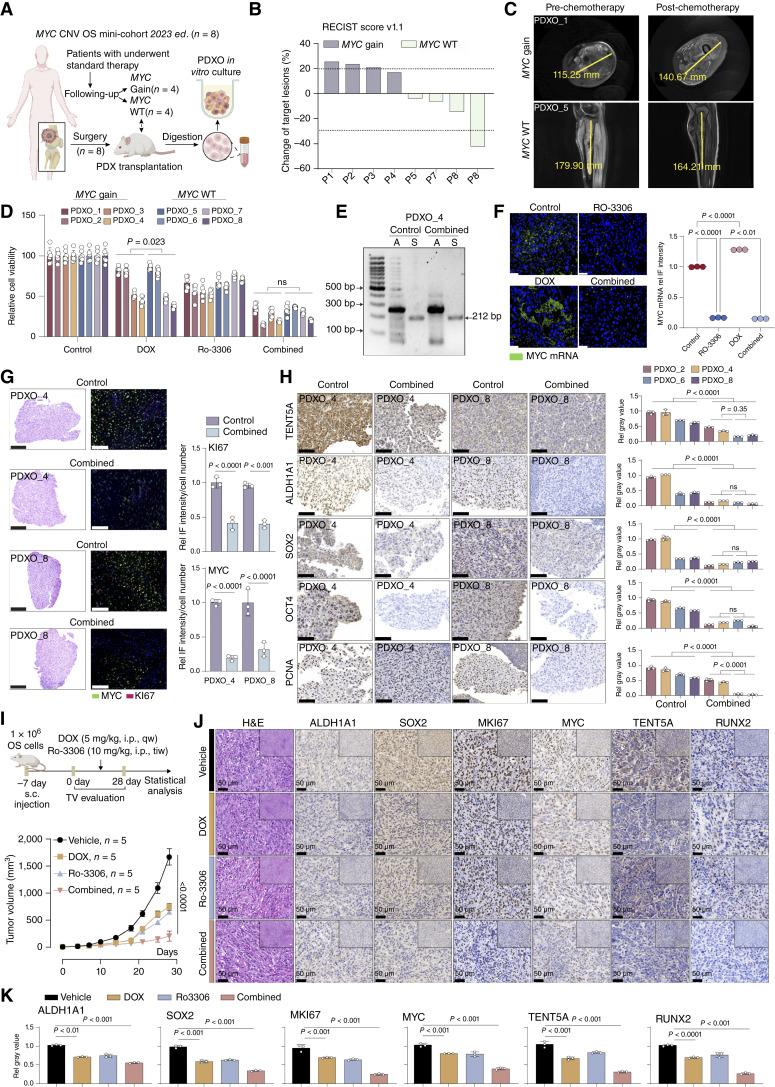
Figure 7. TENT5A inhibition reduces osteosarcoma stemness, enhancing chemotherapy response in MYC-gain PDOs. A, Schematic diagram of the establishment of osteosarcoma PDXs and subsequent PDXO models based on MYC gain or MYC WT. B, RECIST score version 1.1 analysis showing changes in tumor lesion sizes following chemotherapy in MYC gain vs. MYC WT groups. C, Representative MRI showing tumor size changes before and after chemotherapy in representative MYC gain (PDXO_1) and MYC WT (PDXO_5) patients. D, Cell viability assays assessing chemotherapy response in MYC gain and MYC WT PDXO models treated with DOX and Ro-3306. Data are presented as mean ± SEM. Statistical significance was assessed by one-way ANOVA. n = 3 technical replicates from five technical replicates for each strain. E, PAT assay quantifying MYC poly(A) tail length changes after TENT5A inhibition combined with DOX (40 nmol/L) treatment in osteosarcoma organoids (PDXO_4). n = 3 technical replicates from five biological replicates for each strain. F, RNA-FISH and quantitative analysis showing MYC mRNA expression in PDXO models after Ro-3306 (0.5 μmol/L) and DOX (40 nmol/L) combined treatment. Data are presented as mean ± SEM. Statistical significance was assessed by one-way ANOVA. G, Representative hematoxylin and eosin staining and IF with quantification of MYC and MKI67 expression treated with combined therapy. Data are presented as mean ± SEM. Statistical significance was assessed by one-way ANOVA. H, Immunohistochemical analyses and quantitative assessment of TENT5A, stemness-associated markers (ALDH1A1, SOX2, OCT4), and proliferation marker PCNA expression in osteosarcoma PDXO models treated with combined therapy. Quantifications are shown as mean ± SEM. Statistical significance was assessed by one-way ANOVA. I, Experimental scheme and tumor growth curves in a subcutaneous osteosarcoma model (n = 5/group) treated with Ro-3306 and DOX. Data are presented as mean ± SEM. TV, tumor volume. J, Histopathologic analysis and IHC (MYC, TENT5A, MKI67, ALDH1A1, SOX2, and RUNX2) of subcutaneous osteosarcoma models treated with Ro-3306 and DOX. Scale bar, 100 μm. H&E, hematoxylin and eosin. K, Quantification of IHC staining (mean ± SEM; MYC, TENT5A, MKI67, ALDH1A1, SOX2, and RUNX2) of subcutaneous osteosarcoma models treated with Ro-3306 and DOX. Statistical significance was assessed by two-way ANOVA.
Figure 7. TENT5A inhibition reduces osteosarcoma stemness, enhancing chemotherapy response in MYC-gain PDOs. A, Schematic diagram of the establishment of osteosarcoma PDXs and subsequent PDXO models based on MYC gain or MYC WT. B, RECIST score version 1.1 analysis showing changes in tumor lesion sizes following chemotherapy in MYC gain vs. MYC WT groups. C, Representative MRI showing tumor size changes before and after chemotherapy in representative MYC gain (PDXO_1) and MYC WT (PDXO_5) patients. D, Cell viability assays assessing chemotherapy response in MYC gain and MYC WT PDXO models treated with DOX and Ro-3306. Data are presented as mean ± SEM. Statistical significance was assessed by one-way ANOVA. n = 3 technical replicates from five technical replicates for each strain. E, PAT assay quantifying MYC poly(A) tail length changes after TENT5A inhibition combined with DOX (40 nmol/L) treatment in osteosarcoma organoids (PDXO_4). n = 3 technical replicates from five biological replicates for each strain. F, RNA-FISH and quantitative analysis showing MYC mRNA expression in PDXO models after Ro-3306 (0.5 μmol/L) and DOX (40 nmol/L) combined treatment. Data are presented as mean ± SEM. Statistical significance was assessed by one-way ANOVA. G, Representative hematoxylin and eosin staining and IF with quantification of MYC and MKI67 expression treated with combined therapy. Data are presented as mean ± SEM. Statistical significance was assessed by one-way ANOVA. H, Immunohistochemical analyses and quantitative assessment of TENT5A, stemness-associated markers (ALDH1A1, SOX2, OCT4), and proliferation marker PCNA expression in osteosarcoma PDXO models treated with combined therapy. Quantifications are shown as mean ± SEM. Statistical significance was assessed by one-way ANOVA. I, Experimental scheme and tumor growth curves in a subcutaneous osteosarcoma model (n = 5/group) treated with Ro-3306 and DOX. Data are presented as mean ± SEM. TV, tumor volume. J, Histopathologic analysis and IHC (MYC, TENT5A, MKI67, ALDH1A1, SOX2, and RUNX2) of subcutaneous osteosarcoma models treated with Ro-3306 and DOX. Scale bar, 100 μm. H&E, hematoxylin and eosin. K, Quantification of IHC staining (mean ± SEM; MYC, TENT5A, MKI67, ALDH1A1, SOX2, and RUNX2) of subcutaneous osteosarcoma models treated with Ro-3306 and DOX. Statistical significance was assessed by two-way ANOVA.CC BY-NC-ND · PubMed Central

Verification

Claims the paper makes

The claims and statistics of this paper haven’t been checked yet.

Run the check — free, no account needed. It reads the open-access text and checks the sources it cites.

A few free checks a day · papers already verified open instantly · results are public

Self-check

Percentages, sums and reported differences re-computed from the paper’s own numbers.

The self-check needs the paper’s full text.

Citations

Cites

Show all 6 references

Research works printed but not linked: 66

  1. Prudowsky, 2020, Recent insights into therapy resistance in osteosarcoma, Cancers (Basel), 13, 83, 10.3390/cancers13010083 · DOI
  2. Shen, 2020, CircECE1 activates energy metabolism in osteosarcoma by stabilizing c-Myc, Mol Cancer, 19, 151, 10.1186/s12943-020-01269-4 · DOI
  3. Kong, 2024, Cancer stem cells: advances in the glucose, lipid and amino acid metabolism, Mol Cell Biochem, 479, 2545, 10.1007/s11010-023-04861-6 · DOI
  4. Nassar, 2016, Cancer stem cells: basic concepts and therapeutic implications, Annu Rev Pathol, 11, 47, 10.1146/annurev-pathol-012615-044438 · DOI
  5. Bergfeld, 2010, Bone marrow-derived mesenchymal stem cells and the tumor microenvironment, Cancer Metastasis Rev, 29, 249, 10.1007/s10555-010-9222-7 · DOI
  6. Sole, 2021, Unraveling Ewing sarcoma tumorigenesis originating from patient-derived mesenchymal stem cells, Cancer Res, 81, 4994, 10.1158/0008-5472.CAN-20-3837 · DOI
  7. Todosenko, 2023, Signal pathways and microRNAs in osteosarcoma growth and the dual role of mesenchymal stem cells in oncogenesis, Int J Mol Sci, 24, 8993, 10.3390/ijms24108993 · DOI
  8. Lourenco, 2021, MYC protein interactors in gene transcription and cancer, Nat Rev Cancer, 21, 579, 10.1038/s41568-021-00367-9 · DOI
  9. Marinoff, 2023, Clinical targeted next-generation panel sequencing reveals MYC amplification is a poor prognostic factor in osteosarcoma, JCO Precis Oncol, 7, e2200334, 10.1200/PO.22.00334 · DOI
  10. Jiang, 2022, Multi-omics analysis identifies osteosarcoma subtypes with distinct prognosis indicating stratified treatment, Nat Commun, 13, 7207, 10.1038/s41467-022-34689-5 · DOI
  11. Nan, 2023, HCP5 prevents ubiquitination-mediated UTP3 degradation to inhibit apoptosis by activating c-Myc transcriptional activity, Mol Ther, 31, 552, 10.1016/j.ymthe.2022.10.006 · DOI
  12. Whitfield, 2025, MYC in cancer: from undruggable target to clinical trials, Nat Rev Drug Discov, 24, 445, 10.1038/s41573-025-01143-2 · DOI
  13. Meena, 2024, MYC induces oncogenic stress through RNA decay and ribonucleotide catabolism in breast cancer, Cancer Discov, 14, 1699, 10.1158/2159-8290.CD-22-0649 · DOI
  14. Sommerkamp, 2021, Alternative polyadenylation in stem cell self-renewal and differentiation, Trends Mol Med, 27, 660, 10.1016/j.molmed.2021.04.006 · DOI
  15. Cui, 2023, Elevated pre-mRNA 3′ end processing activity in cancer cells renders vulnerability to inhibition of cleavage and polyadenylation, Nat Commun, 14, 4480, 10.1038/s41467-023-39793-8 · DOI
  16. Liudkovska, 2022, TENT5 cytoplasmic noncanonical poly(A) polymerases regulate the innate immune response in animals, Sci Adv, 8, eadd9468, 10.1126/sciadv.add9468 · DOI
  17. Brouze, 2024, TENT5-mediated polyadenylation of mRNAs encoding secreted proteins is essential for gametogenesis in mice, Nat Commun, 15, 5331, 10.1038/s41467-024-49479-4 · DOI
  18. Liudkovska, 2021, Functions and mechanisms of RNA tailing by metazoan terminal nucleotidyltransferases, Wiley Interdiscip Rev RNA, 12, e1622, 10.1002/wrna.1622 · DOI
  19. Krawczyk, 2025, Re-adenylation by TENT5A enhances efficacy of SARS-CoV-2 mRNA vaccines, Nature, 641, 984, 10.1038/s41586-025-08842-1 · DOI
  20. Gewartowska, 2021, Cytoplasmic polyadenylation by TENT5A is required for proper bone formation, Cell Rep, 35, 109015, 10.1016/j.celrep.2021.109015 · DOI
  21. Hu, 2025, TENT5A increases glioma malignancy and promotes its progression, Recent Pat Anticancer Drug Discov, 20, 45, 10.2174/0115748928280901231206102637 · DOI
  22. Lee, 2017, MYC and MCL1 cooperatively promote chemotherapy-resistant breast cancer stem cells via regulation of mitochondrial oxidative phosphorylation, Cell Metab, 26, 633, 10.1016/j.cmet.2017.09.009 · DOI
  23. Amaya, 2022, The STAT3-MYC axis promotes survival of leukemia stem cells by regulating SLC1A5 and oxidative phosphorylation, Blood, 139, 584, 10.1182/blood.2021013201 · DOI
  24. Zhao, 2016, Cancer stem cells and chemoresistance: the smartest survives the raid, Pharmacol Ther, 160, 145, 10.1016/j.pharmthera.2016.02.008 · DOI
  25. Annett, 2018, Targeting cancer stem cells in the clinic: current status and perspectives, Pharmacol Ther, 187, 13, 10.1016/j.pharmthera.2018.02.001 · DOI
  26. Liu, 2023, MYC in liver cancer: mechanisms and targeted therapy opportunities, Oncogene, 42, 3303, 10.1038/s41388-023-02861-w · DOI
  27. Weber, 2023, Strategies to target the cancer driver MYC in tumor cells, Front Oncol, 13, 1142111, 10.3389/fonc.2023.1142111 · DOI
  28. Álvarez-Varela, 2022, Mex3a marks drug-tolerant persister colorectal cancer cells that mediate relapse after chemotherapy, Nat Cancer, 3, 1052, 10.1038/s43018-022-00402-0 · DOI
  29. van de Wetering, 2015, Prospective derivation of a living organoid biobank of colorectal cancer patients, Cell, 161, 933, 10.1016/j.cell.2015.03.053 · DOI · Paper page
  30. Yan, 2023, Organoid cultures for cancer modeling, Cell Stem Cell, 30, 917, 10.1016/j.stem.2023.05.012 · DOI
  31. Nguyen, 2025, Lactate controls cancer stemness and plasticity through epigenetic regulation, Cell Metab, 37, 903, 10.1016/j.cmet.2025.01.002 · DOI
  32. Mu, 2025, Methionine intervention induces PD-L1 expression to enhance the immune checkpoint therapy response in MTAP-deleted osteosarcoma, Cell Rep Med, 6, 101977, 10.1016/j.xcrm.2025.101977 · DOI
  33. Han, 2021, Her4 promotes cancer metabolic reprogramming via the c-Myc-dependent signaling axis, Cancer Lett, 496, 57, 10.1016/j.canlet.2020.10.008 · DOI
  34. Zhang, 2017, Toosendanin demonstrates promising antitumor efficacy in osteosarcoma by targeting STAT3, Oncogene, 36, 6627, 10.1038/onc.2017.270 · DOI · Paper page
  35. Yafei, 2021, Personalized medicine modality based on patient-derived xenografts from a malignant transformed GCTB harboring H3F3A G34W mutation, J Orthop Translat, 29, 106, 10.1016/j.jot.2021.04.004 · DOI
  36. Dobin, 2013, STAR: ultrafast universal RNA-seq aligner, Bioinformatics, 29, 15, 10.1093/bioinformatics/bts635 · DOI · Paper page
  37. Liao, 2014, featureCounts: an efficient general purpose program for assigning sequence reads to genomic features, Bioinformatics, 30, 923, 10.1093/bioinformatics/btt656 · DOI · Paper page
  38. Love, 2014, Moderated estimation of fold change and dispersion for RNA-seq data with DESeq2, Genome Biol, 15, 550, 10.1186/s13059-014-0550-8 · DOI · Paper page
  39. Yu, 2012, clusterProfiler: an R package for comparing biological themes among gene clusters, OMICS, 16, 284, 10.1089/omi.2011.0118 · DOI · Paper page
  40. Liberzon, 2011, Molecular signatures database (MSigDB) 3.0, Bioinformatics, 27, 1739, 10.1093/bioinformatics/btr260 · DOI · Paper page
  41. Liberzon, 2015, The Molecular Signatures Database (MSigDB) hallmark gene set collection, Cell Syst, 1, 417, 10.1016/j.cels.2015.12.004 · DOI · Paper page
  42. Workman, 2019, Nanopore native RNA sequencing of a human poly(A) transcriptome, Nat Methods, 16, 1297, 10.1038/s41592-019-0617-2 · DOI
  43. Krause, 2019, tailfindr: alignment-free poly(A) length measurement for Oxford nanopore RNA and DNA sequencing, RNA, 25, 1229, 10.1261/rna.071332.119 · DOI
  44. Jia, 2022, An atlas of plant full-length RNA reveals tissue-specific and monocots-dicots conserved regulation of poly(A) tail length, Nat Plants, 8, 1118, 10.1038/s41477-022-01224-9 · DOI
  45. Wu, 2025, Alternative polyadenylation and metabolic profiling in young panicle development of hybrid rice and its parents, Rice (N Y), 18, 80, 10.1186/s12284-025-00834-z · DOI
  46. Li, 2021, New strategies to improve minimap2 alignment accuracy, Bioinformatics, 37, 4572, 10.1093/bioinformatics/btab705 · DOI
  47. Tang, 2020, Full-length transcript characterization of SF3B1 mutation in chronic lymphocytic leukemia reveals downregulation of retained introns, Nat Commun, 11, 1438, 10.1038/s41467-020-15171-6 · DOI
  48. Sebestyén, 2015, Detection of recurrent alternative splicing switches in tumor samples reveals novel signatures of cancer, Nucleic Acids Res, 43, 1345, 10.1093/nar/gku1392 · DOI
  49. Liu, 2021, Single-cell transcriptomics reveals the complexity of the tumor microenvironment of treatment-naive osteosarcoma, Front Oncol, 11, 709210, 10.3389/fonc.2021.709210 · DOI
  50. Kuchta, 2016, FAM46 proteins are novel eukaryotic non-canonical poly(A) polymerases, Nucleic Acids Res, 44, 3534, 10.1093/nar/gkw222 · DOI
  51. van de Donk, 2021, Multiple myeloma, Lancet, 397, 410, 10.1016/S0140-6736(21)00135-5 · DOI
  52. Kim, 2023, SOX9 is a key component of RUNX2-regulated transcriptional circuitry in osteosarcoma, Cell Biosci, 13, 136, 10.1186/s13578-023-01088-2 · DOI
  53. Kubota, 2019, Lineage-specific RUNX2 super-enhancer activates MYC and promotes the development of blastic plasmacytoid dendritic cell neoplasm, Nat Commun, 10, 1653, 10.1038/s41467-019-09710-z · DOI
  54. Wu, 2018, Blocking CDK1/PDK1/β-Catenin signaling by CDK1 inhibitor RO3306 increased the efficacy of sorafenib treatment by targeting cancer stem cells in a preclinical model of hepatocellular carcinoma, Theranostics, 8, 3737, 10.7150/thno.25487 · DOI
  55. Truong, 2024, Mapping the single-cell differentiation landscape of osteosarcoma, Clin Cancer Res, 30, 3259, 10.1158/1078-0432.CCR-24-0563 · DOI
  56. Yan, 2024, Unraveling molecular aberrations and pioneering therapeutic strategies in osteosarcoma, Biochim Biophys Acta Rev Cancer, 1879, 189171, 10.1016/j.bbcan.2024.189171 · DOI
  57. Chang, 2014, TAIL-seq: genome-wide determination of poly(A) tail length and 3′ end modifications, Mol Cell, 53, 1044, 10.1016/j.molcel.2014.02.007 · DOI · Paper page
  58. Han, 2020, Cancer stem cell-targeted bio-imaging and chemotherapeutic perspective, Chem Soc Rev, 49, 7856, 10.1039/D0CS00379D · DOI
  59. Loh, 2024, Hallmarks of cancer stemness, Cell Stem Cell, 31, 617, 10.1016/j.stem.2024.04.004 · DOI
  60. Zhang, 2024, H3K18 lactylation potentiates immune escape of non-small cell lung cancer, Cancer Res, 84, 3589, 10.1158/0008-5472.CAN-23-3513 · DOI
  61. Lamoureux, 2014, Selective inhibition of BET bromodomain epigenetic signalling interferes with the bone-associated tumour vicious cycle, Nat Commun, 5, 3511, 10.1038/ncomms4511 · DOI
  62. Zhang, 2023, A novel molecular classification method for osteosarcoma based on tumor cell differentiation trajectories, Bone Res, 11, 1, 10.1038/s41413-022-00233-w · DOI
  63. Hu, 2024, Cell membrane-anchored and tumor-targeted IL-12 T-cell therapy destroys cancer-associated fibroblasts and disrupts extracellular matrix in heterogenous osteosarcoma xenograft models, J Immunother Cancer, 12, e006991, 10.1136/jitc-2023-006991 · DOI
  64. Cui, 2020, The role of extracelluar matrix in osteosarcoma progression and metastasis, J Exp Clin Cancer Res, 39, 178, 10.1186/s13046-020-01685-w · DOI
  65. Li, 2023, A circular RNA activated by TGFβ promotes tumor metastasis through enhancing IGF2BP3-mediated PDPN mRNA stability, Nat Commun, 14, 6876, 10.1038/s41467-023-42571-1 · DOI
  66. Kang, 2024, m(6)A-modified cenRNA stabilizes CENPA to ensure centromere integrity in cancer cells, Cell, 187, 6035, 10.1016/j.cell.2024.08.040 · DOI

Metadata

Authors
Tao, Y., Zhang, Q., Wang, H., Yang, B., Mu, H., Liu, K., Zhao, W., Yang, X., Zhao, B., Zuo, D., Yang, L., Cai, Z., Wang, Z., Wang, H., Hua, Y., & Sun, W.
Affiliations
  • Shanghai Jiao Tong University (CN)
  • Shanghai General Hospital 1 Department of Orthopedics, , Shanghai Jiao Tong University School of Medicine, Shanghai, China.
Corresponding author
Tao, Yining
Venue
Cancer Research
Published
2026-01-30
Volume
86
Issue
9
Pages
2161-2183
ISSN
  • 0008-5472 (ISSN-L)
  • 1538-7445
OpenAlex
W7126215370
Cited by
1
References
6
Citations by year
2026: 1
FWCI
2.04
Type
journal article
Language
en
Open access
Locations
  • Cancer Research (publishedVersion, cc-by-nc-nd)
  • PubMed (publishedVersion)
  • PubMed Central (publishedVersion, cc-by-nc-nd)
Funders
National Natural Science Foundation of China (82303878, 82373177, 82473469, 82404064, 82404063, 82473491)
Topics
  • Life Sciences › Biochemistry, Genetics and Molecular Biology › Molecular Biology › RNA Research and Splicing
  • Health Sciences › Medicine › Oncology › Sarcoma Diagnosis and Treatment
  • Life Sciences › Biochemistry, Genetics and Molecular Biology › Molecular Biology › RNA modifications and cancer
Keywords
osteosarcoma, cancer stemness, poly(A) polymerase, post-transcriptional regulation, chemoresistance, RNA-binding proteins, patient-derived organoids
MeSH terms
Animals, Bone Neoplasms, Humans, RNA, Messenger, Osteosarcoma, Neoplastic Stem Cells, Gene Expression Regulation, Neoplastic, Proto-Oncogene Proteins c-myc, RNA-Binding Proteins, Drug Resistance, Neoplasm, RNA Stability, Cell Line, Tumor, Mice

About these checks

Registry, retraction, Cites and statistics results are computed, not judged, with one exception: a printed reference that no index lists is read once by a model before it counts as a citation error. Claims are extracted by a model and kept only when their quote appears verbatim in the text; each cited source is then checked, with a model’s help, for whether it says what the claim relies on. Those verdicts can be wrong — read the claim’s quote and the cited source before relying on one.

Statistics and arithmetic are recomputed, not judged.

Confidence bands are shown only for fields calibrated on our annotated test set. None is calibrated yet, so no band is shown.

What counts as a claim ›How we measure confidence ›How we check this ›

Are you an author, or do you see a problem with this page? Request a review

How to cite

Cite CoChat for the checks on this page, and the paper for its own findings.

This page
CoChat. (2026). Citation check: TENT5A Maintains MYC mRNA Stability to Enhance Osteosarcoma Stemness. https://app.cochat.ai/papers/10.1158/0008-5472.can-25-4635
The paper
Tao, Y., Zhang, Q., Wang, H., Yang, B., Mu, H., Liu, K., Zhao, W., Yang, X., Zhao, B., Zuo, D., Yang, L., Cai, Z., Wang, Z., Wang, H., Hua, Y., & Sun, W. (2026). TENT5A Maintains MYC mRNA Stability to Enhance Osteosarcoma Stemness. Cancer Research. https://doi.org/10.1158/0008-5472.can-25-4635