Cited by 151

The DOI matches its Crossref record; 10 of the 10 references it cites were found in a registry or an index.

Spatial Architecture of Myeloid and T Cells Orchestrates Immune Evasion and Clinical Outcome in Lung Cancer

Enfield, Katey S.S., Colliver, Emma, Lee, Claudia, Magness, Alastair, Moore, David A., Sivakumar, Monica, Grigoriadis, Kristiana, Pich, Oriol, Karasaki, Takahiro, Hobson, Philip S., Levi, Dina, Veeriah, Selvaraju, Puttick, Clare, Nye, Emma L., Green, Mary, Dijkstra, Krijn K., Shimato, Masako, Akarca, Ayse U., Marafioti, Teresa, Salgado, Roberto, Hackshaw, Allan, TRACERx consortium, Jamal-Hanjani, Mariam, van Maldegem, Febe, McGranahan, Nicholas, Glass, Benjamin, Pulaski, Hanna, Walk, Eric, Reading, James L., Quezada, Sergio A., Hiley, Crispin T., Downward, Julian, Sahai, Erik, Swanton, Charles, Angelova, Mihaela·2024·Cancer Discovery

Published version of a preprint

Abstract

Understanding the role of the tumor microenvironment (TME) in lung cancer is critical to improving patient outcomes. We identified four histology-independent archetype TMEs in treatment-naïve early-stage lung cancer using imaging mass cytometry in the TRACERx study (n = 81 patients/198 samples/2.3 million cells). In immune-hot adenocarcinomas, spatial niches of T cells and macrophages increased with clonal neoantigen burden, whereas such an increase was observed for niches of plasma and B cells in immune-excluded squamous cell carcinomas (LUSC). Immune-low TMEs were associated with fibroblast barriers to immune infiltration. The fourth archetype, characterized by sparse lymphocytes and high tumor-associated neutrophil (TAN) infiltration, had tumor cells spatially separated from vasculature and exhibited low spatial intratumor heterogeneity. TAN-high LUSC had frequent PIK3CA mutations. TAN-high tumors harbored recently expanded and metastasis-seeding subclones and had a shorter disease-free survival independent of stage. These findings delineate genomic, immune, and physical barriers to immune surveillance and implicate neutrophil-rich TMEs in metastasis. Significance: This study provides novel insights into the spatial organization of the lung cancer TME in the context of tumor immunogenicity, tumor heterogeneity, and cancer evolution. Pairing the tumor evolutionary history with the spatially resolved TME suggests mechanistic hypotheses for tumor progression and metastasis with implications for patient outcome and treatment. This article is featured in Selected Articles from This Issue, p. 897

Overview

The claims and statistics of this paper haven’t been checked yet.

Run the check — free, no account needed. It reads the open-access text and checks the sources it cites.

A few free checks a day · papers already verified open instantly · results are public

Integrity signals

Registry

Crossref · 10.1158/2159-8290.cd-23-1380

Cites

10 of 10 references verified0 citation errors · 0 not checkable

Statistics

Figures

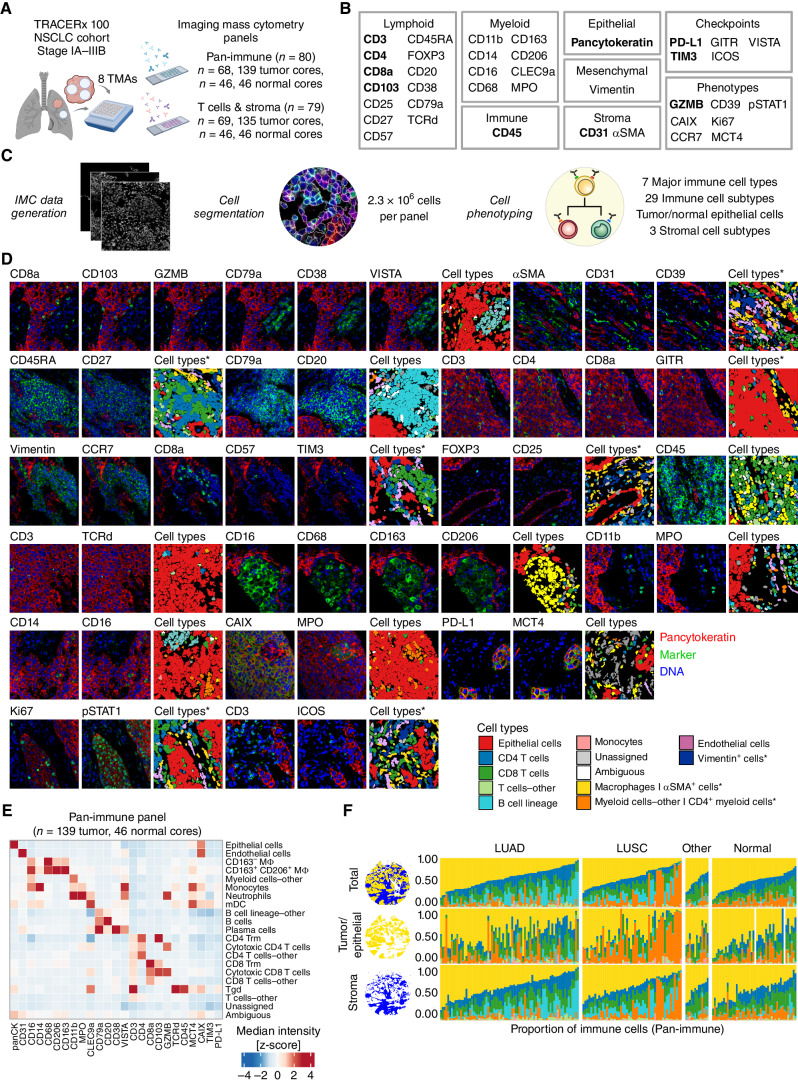
Figure 1. IMC workflow defines the single-cell spatial landscape of the NSCLC tumor microenvironment. A, TRACERx 100 IMC cohort. We developed and applied two IMC antibody panels, Pan-immune and T cells and stroma, to tissue microarrays (TMA) from clinical samples collected at surgical resection (created with BioRender.com). B, Targets of antibodies described in this study. Bold text indicates targets detected in both IMC panels. C, IMC data were acquired from stained TMAs and processed to identify single cells and their phenotypes. D, 40,000 μm2 crops of IMC images representing the markers from B with corresponding cell types from the pan-immune panel, unless annotated with an asterisk for the T cells and stroma panel only. E, A heat map of the z-score normalized median intensities of markers from the pan-immune panel across the identified cell subtypes. F, Proportion of major immune cell types identified in the pan-immune IMC data set per TMA core, calculated over the total tissue area (illustrated as blue and gold domains), tumor/epithelial compartment (gold domain), or the stromal compartment (blue domain). In two normal cores, the epithelial cell signal reflected very thin cells, which were not resolved into an epithelial compartment. All data from these cores are represented by the stroma compartment. Cell types color legend applies to D and F, where asterisks denote cell types identified in T cells and stroma panel only. LUAD, lung adenocarcinoma; LUSC, lung squamous cell carcinoma; NSCLC, non–small cell lung cancer; other, other non–small cell lung cancer histologies; IMC, imaging mass cytometry.
Figure 1. IMC workflow defines the single-cell spatial landscape of the NSCLC tumor microenvironment. A, TRACERx 100 IMC cohort. We developed and applied two IMC antibody panels, Pan-immune and T cells and stroma, to tissue microarrays (TMA) from clinical samples collected at surgical resection (created with BioRender.com). B, Targets of antibodies described in this study. Bold text indicates targets detected in both IMC panels. C, IMC data were acquired from stained TMAs and processed to identify single cells and their phenotypes. D, 40,000 μm2 crops of IMC images representing the markers from B with corresponding cell types from the pan-immune panel, unless annotated with an asterisk for the T cells and stroma panel only. E, A heat map of the z-score normalized median intensities of markers from the pan-immune panel across the identified cell subtypes. F, Proportion of major immune cell types identified in the pan-immune IMC data set per TMA core, calculated over the total tissue area (illustrated as blue and gold domains), tumor/epithelial compartment (gold domain), or the stromal compartment (blue domain). In two normal cores, the epithelial cell signal reflected very thin cells, which were not resolved into an epithelial compartment. All data from these cores are represented by the stroma compartment. Cell types color legend applies to D and F, where asterisks denote cell types identified in T cells and stroma panel only. LUAD, lung adenocarcinoma; LUSC, lung squamous cell carcinoma; NSCLC, non–small cell lung cancer; other, other non–small cell lung cancer histologies; IMC, imaging mass cytometry.CC BY · PubMed Central
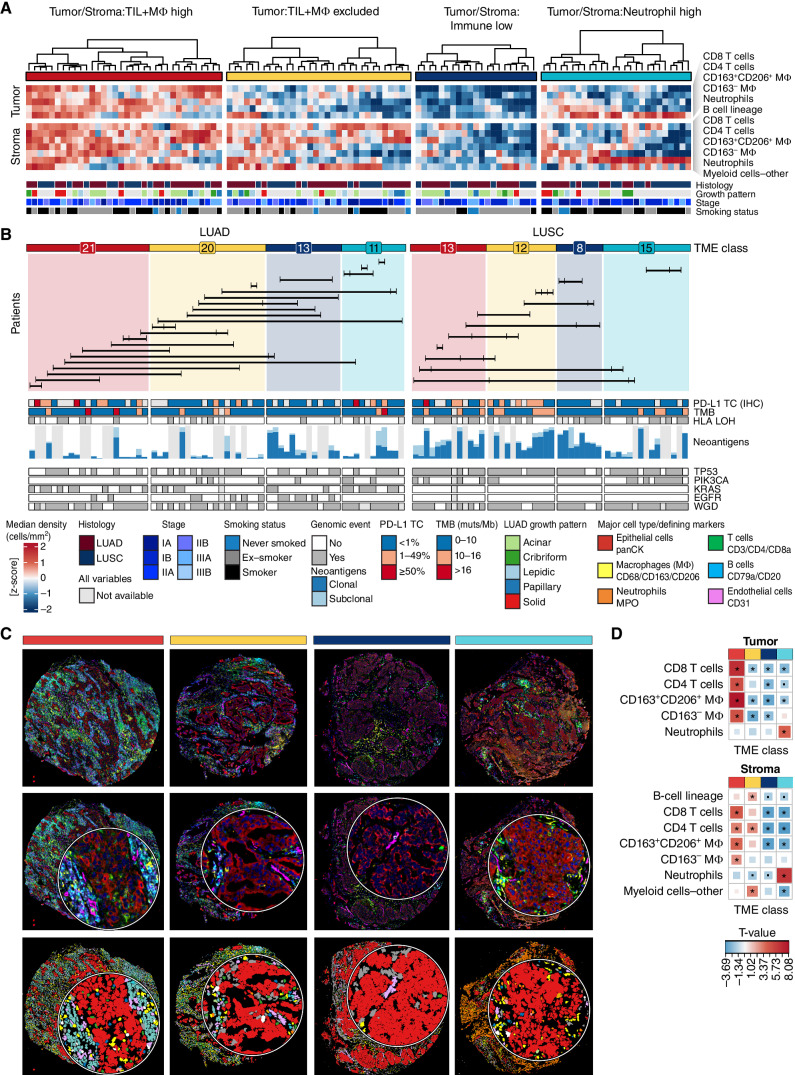
Figure 2. Four TME classes in NSCLC defined by immune composition in tumor nests and surrounding stroma. A, Tumor cores were classified into four TME classes, derived by clustering immune cell densities in the tumor nest and stroma. Only LUAD (n = 65 cores, 35 tumors) and LUSC (n = 48, 23 tumors) tumor cores are featured, and corresponding clinical annotations are displayed. Regional growth patterns are shown for LUAD: lepidic (low grade), acinar and papillary (mid-grade), solid and cribriform (high grade). B, TME classifications displayed separately for LUAD and LUSC. Numbers indicate the number of cores with a given TME class for each histology subtype. The barplot shows the total expressed neoantigen count for all predicted HLA alleles in the range 0–269 for LUAD and 23–160 for LUSC, colored by their clonal and subclonal status. Horizontal lines connect tumor cores from the same multiregion tumor (n = 33 tumors). The annotation bars display tumor genomic features and PD-L1 tumor cell (TC) staining (SP142 IHC) for the corresponding tumor cores. C, Composite images and cell type maps of representative examples for each TME class. Crop insets are 82 μm in diameter. D, A heat map of T values derived from an LMEM of the major cell type density across TME classes, adjusted for histology subtype as a fixed effect and patient as a random effect. Significant relationships are indicated with an asterisk for P ≤ 0.05. TIL, tumor-infiltrating lymphocyte; MΦ, macrophage; LUAD, lung adenocarcinoma; LUSC, lung squamous cell carcinoma; NSCLC, non–small cell lung cancer; TME, tumor microenvironment; TMB, tumor mutation burden; muts/Mb, mutations per megabase; panCK, pancytokeratin; LMEM, linear mixed effects model.
Figure 2. Four TME classes in NSCLC defined by immune composition in tumor nests and surrounding stroma. A, Tumor cores were classified into four TME classes, derived by clustering immune cell densities in the tumor nest and stroma. Only LUAD (n = 65 cores, 35 tumors) and LUSC (n = 48, 23 tumors) tumor cores are featured, and corresponding clinical annotations are displayed. Regional growth patterns are shown for LUAD: lepidic (low grade), acinar and papillary (mid-grade), solid and cribriform (high grade). B, TME classifications displayed separately for LUAD and LUSC. Numbers indicate the number of cores with a given TME class for each histology subtype. The barplot shows the total expressed neoantigen count for all predicted HLA alleles in the range 0–269 for LUAD and 23–160 for LUSC, colored by their clonal and subclonal status. Horizontal lines connect tumor cores from the same multiregion tumor (n = 33 tumors). The annotation bars display tumor genomic features and PD-L1 tumor cell (TC) staining (SP142 IHC) for the corresponding tumor cores. C, Composite images and cell type maps of representative examples for each TME class. Crop insets are 82 μm in diameter. D, A heat map of T values derived from an LMEM of the major cell type density across TME classes, adjusted for histology subtype as a fixed effect and patient as a random effect. Significant relationships are indicated with an asterisk for P ≤ 0.05. TIL, tumor-infiltrating lymphocyte; MΦ, macrophage; LUAD, lung adenocarcinoma; LUSC, lung squamous cell carcinoma; NSCLC, non–small cell lung cancer; TME, tumor microenvironment; TMB, tumor mutation burden; muts/Mb, mutations per megabase; panCK, pancytokeratin; LMEM, linear mixed effects model.CC BY · PubMed Central
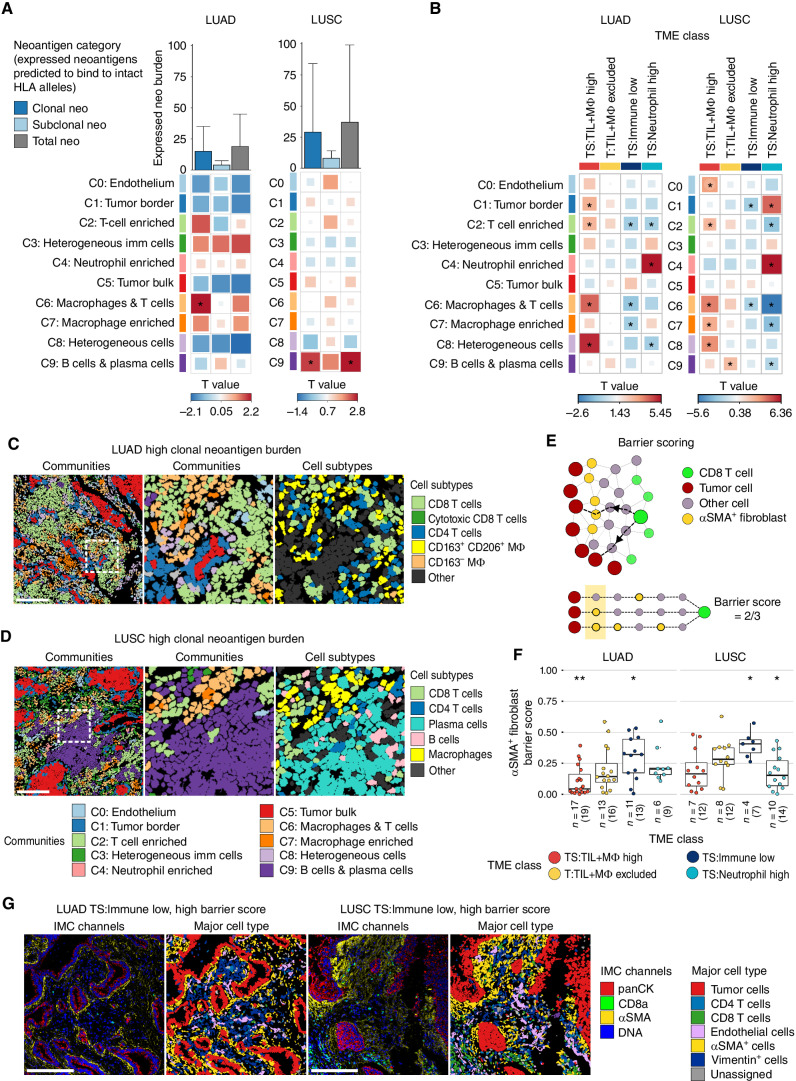
Figure 3. Spatial features associated with neoantigen burden and immune low TMEs. A, Correlation of densities of spatial cellular communities and the burden of expressed clonal, subclonal and total neoantigens predicted to bind intact HLA alleles, after accounting for HLA LOH, in LUAD (n = 31, 51 tumor cores) and LUSC (n = 17, 37 tumor cores). Bar plot shows the median neoantigen burden with whiskers extending to the 75th percentile. B, Comparison of the densities of spatial cellular communities in a given TME class compared with all other TME classes combined. LUAD: n = 21 TS:TIL+MΦ high cores, n = 20 T:TIL+MΦ excluded cores, n = 13 TS:Immune low cores, n = 11 TS:Neutrophil high cores. LUSC: n = 13 TS:TIL+MΦ high cores, n = 12 T:TIL+MΦ excluded cores, n = 8 TS:Immune low cores, n = 15 TS:Neutrophil high cores. Box sizes in A and B correspond to T values. C, Community and cell subtype maps from a LUAD tumor core with a high burden of expressed clonal neoantigens and high densities of C2:T-cell enriched and C6:macrophage and T cells communities. D, Community and cell subtype maps from a LUSC tumor core with a high burden of expressed clonal neoantigens and high densities of community C9:B cells and plasma cells. Single cells in C and D are colored by community according to the color legend below D or cell subtype as indicated. Scale bars, 200 μm. Middle, an enlargement of the area highlighted with a white box in the left plot with matched cell subtypes shown in the right plot. E, Schematic of αSMA+ fibroblast barrier score calculation. The barrier score measures the degree of spatial interpositioning of tumor cell–adjacent αSMA+ fibroblasts between CD8 T cells and their nearest tumor cell(s) in a tissue core. In the lower half of the schematic, three nearest tumor cells are defined for the green CD8 T cell, all six hops away. Tumor cell–adjacent αSMA+ fibroblasts are found on two of these three paths from CD8 T-cell to tumor cell, resulting in a barrier score of ⅔. F, Boxplot comparing the αSMA+ fibroblast barrier scores in a given TME class compared with all other TME classes combined in LUAD (n = 36, 57 tumor cores) and LUSC (n = 22, 45 tumor cores). Boxplots show median and lower and upper quartile values, and whiskers extend up to 1.5 × IQR above and below the quartiles. G, Representative IMC images and cell type maps from LUAD and LUSC tumor cores classified as TS:Immune low with a high barrier score. Scale bars, 200 μm. P values in A, B, and F and T values in A and B were calculated in a linear mixed-effects model with patient as a random effect, using smoking status as a fixed effect in A with a P value < 0.05 considered significant. LUAD, lung adenocarcinoma; LUSC, lung squamous cell carcinoma; panCK, pancytokeratin; TS, tumor/stroma; T, tumor; TIL, tumor-infiltrating lymphocytes; MΦ, macrophage; *, P < 0.05; **, P < 0.01.
Figure 3. Spatial features associated with neoantigen burden and immune low TMEs. A, Correlation of densities of spatial cellular communities and the burden of expressed clonal, subclonal and total neoantigens predicted to bind intact HLA alleles, after accounting for HLA LOH, in LUAD (n = 31, 51 tumor cores) and LUSC (n = 17, 37 tumor cores). Bar plot shows the median neoantigen burden with whiskers extending to the 75th percentile. B, Comparison of the densities of spatial cellular communities in a given TME class compared with all other TME classes combined. LUAD: n = 21 TS:TIL+MΦ high cores, n = 20 T:TIL+MΦ excluded cores, n = 13 TS:Immune low cores, n = 11 TS:Neutrophil high cores. LUSC: n = 13 TS:TIL+MΦ high cores, n = 12 T:TIL+MΦ excluded cores, n = 8 TS:Immune low cores, n = 15 TS:Neutrophil high cores. Box sizes in A and B correspond to T values. C, Community and cell subtype maps from a LUAD tumor core with a high burden of expressed clonal neoantigens and high densities of C2:T-cell enriched and C6:macrophage and T cells communities. D, Community and cell subtype maps from a LUSC tumor core with a high burden of expressed clonal neoantigens and high densities of community C9:B cells and plasma cells. Single cells in C and D are colored by community according to the color legend below D or cell subtype as indicated. Scale bars, 200 μm. Middle, an enlargement of the area highlighted with a white box in the left plot with matched cell subtypes shown in the right plot. E, Schematic of αSMA+ fibroblast barrier score calculation. The barrier score measures the degree of spatial interpositioning of tumor cell–adjacent αSMA+ fibroblasts between CD8 T cells and their nearest tumor cell(s) in a tissue core. In the lower half of the schematic, three nearest tumor cells are defined for the green CD8 T cell, all six hops away. Tumor cell–adjacent αSMA+ fibroblasts are found on two of these three paths from CD8 T-cell to tumor cell, resulting in a barrier score of ⅔. F, Boxplot comparing the αSMA+ fibroblast barrier scores in a given TME class compared with all other TME classes combined in LUAD (n = 36, 57 tumor cores) and LUSC (n = 22, 45 tumor cores). Boxplots show median and lower and upper quartile values, and whiskers extend up to 1.5 × IQR above and below the quartiles. G, Representative IMC images and cell type maps from LUAD and LUSC tumor cores classified as TS:Immune low with a high barrier score. Scale bars, 200 μm. P values in A, B, and F and T values in A and B were calculated in a linear mixed-effects model with patient as a random effect, using smoking status as a fixed effect in A with a P value < 0.05 considered significant. LUAD, lung adenocarcinoma; LUSC, lung squamous cell carcinoma; panCK, pancytokeratin; TS, tumor/stroma; T, tumor; TIL, tumor-infiltrating lymphocytes; MΦ, macrophage; *, P < 0.05; **, P < 0.01.CC BY · PubMed Central
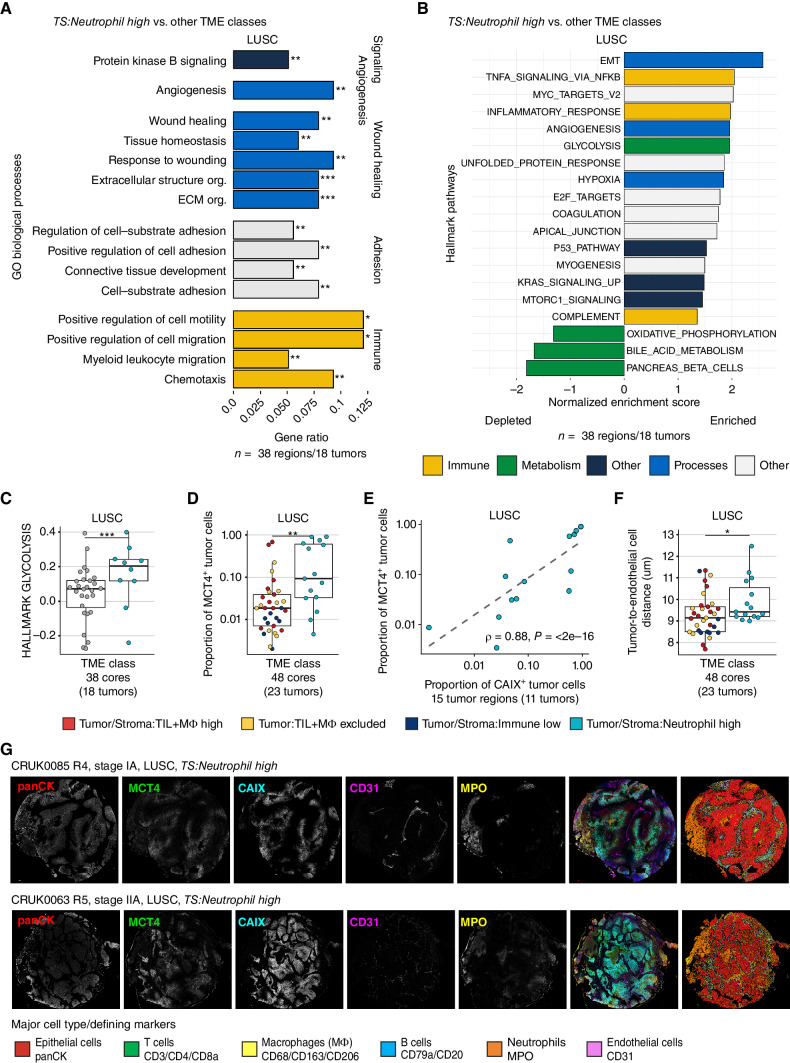
Figure 4. Neutrophil infiltration in LUSC is associated with distinct metabolic and immunosuppressive phenotypes. A, Gene Ontology (GO) biological processes enriched among upregulated genes in the TS:Neutrophil high TME class (n = 10 cores) compared with other TME classes combined (n = 28 cores) in LUSC (FDR < 0.01, gene ratio > 0.05). B, GSEA of hallmark gene sets compared between tumor cores from the Tumor/Stroma:Neutrophil high TME class and other TME classes combined, using the t-statistic derived from the limma–voom model on TMM-normalized gene expression. Significantly enriched pathways were colored by type of pathway (FDR < 0.05). C, Normalized enrichment score derived from single-sample GSEA visualized for TS:Neutrophil high and cores from other TME classes. The P value is derived from GSEA of LUSC as shown in A and adjusted for other hallmark pathways using the Benjamini–Hochberg method. D, Proportion of tumor cells assigned MCT4+ in TS:Neutrophil high tumor cores compared with tumor cores from other TME classes combined in LUSC. E, Spearman correlation coefficient and P value comparing the proportion of MCT4+ and CAIX+ tumor cells in TS:Neutrophil high LUSC TMEs. F, Median distance between LUSC tumor cells to their nearest endothelial cell per core in TS:Neutrophil high TME class compared with all other TME classes combined. G, Single-channel images and composite image alongside cell type map displaying tumor cells, neutrophils (MPO, yellow), endothelial cells (CD31, magenta), and regions of hypoxia (CAIX, cyan) and MCT4 (green) expression. Boxplots show median and lower and upper quartile values, and whiskers extend up to 1.5 × IQR above and below the quartiles. P values for D and F were calculated in a linear mixed-effects model with patient as the random-effect covariate. LUSC, lung squamous cell carcinoma; TS, tumor/stroma; FDR, false discovery rate; TMM, trimmed mean of M-values; panCK, pancytokeratin; *, P < 0.05; **, P < 0.01; ***, P < 0.001.
Figure 4. Neutrophil infiltration in LUSC is associated with distinct metabolic and immunosuppressive phenotypes. A, Gene Ontology (GO) biological processes enriched among upregulated genes in the TS:Neutrophil high TME class (n = 10 cores) compared with other TME classes combined (n = 28 cores) in LUSC (FDR < 0.01, gene ratio > 0.05). B, GSEA of hallmark gene sets compared between tumor cores from the Tumor/Stroma:Neutrophil high TME class and other TME classes combined, using the t-statistic derived from the limma–voom model on TMM-normalized gene expression. Significantly enriched pathways were colored by type of pathway (FDR < 0.05). C, Normalized enrichment score derived from single-sample GSEA visualized for TS:Neutrophil high and cores from other TME classes. The P value is derived from GSEA of LUSC as shown in A and adjusted for other hallmark pathways using the Benjamini–Hochberg method. D, Proportion of tumor cells assigned MCT4+ in TS:Neutrophil high tumor cores compared with tumor cores from other TME classes combined in LUSC. E, Spearman correlation coefficient and P value comparing the proportion of MCT4+ and CAIX+ tumor cells in TS:Neutrophil high LUSC TMEs. F, Median distance between LUSC tumor cells to their nearest endothelial cell per core in TS:Neutrophil high TME class compared with all other TME classes combined. G, Single-channel images and composite image alongside cell type map displaying tumor cells, neutrophils (MPO, yellow), endothelial cells (CD31, magenta), and regions of hypoxia (CAIX, cyan) and MCT4 (green) expression. Boxplots show median and lower and upper quartile values, and whiskers extend up to 1.5 × IQR above and below the quartiles. P values for D and F were calculated in a linear mixed-effects model with patient as the random-effect covariate. LUSC, lung squamous cell carcinoma; TS, tumor/stroma; FDR, false discovery rate; TMM, trimmed mean of M-values; panCK, pancytokeratin; *, P < 0.05; **, P < 0.01; ***, P < 0.001.CC BY · PubMed Central
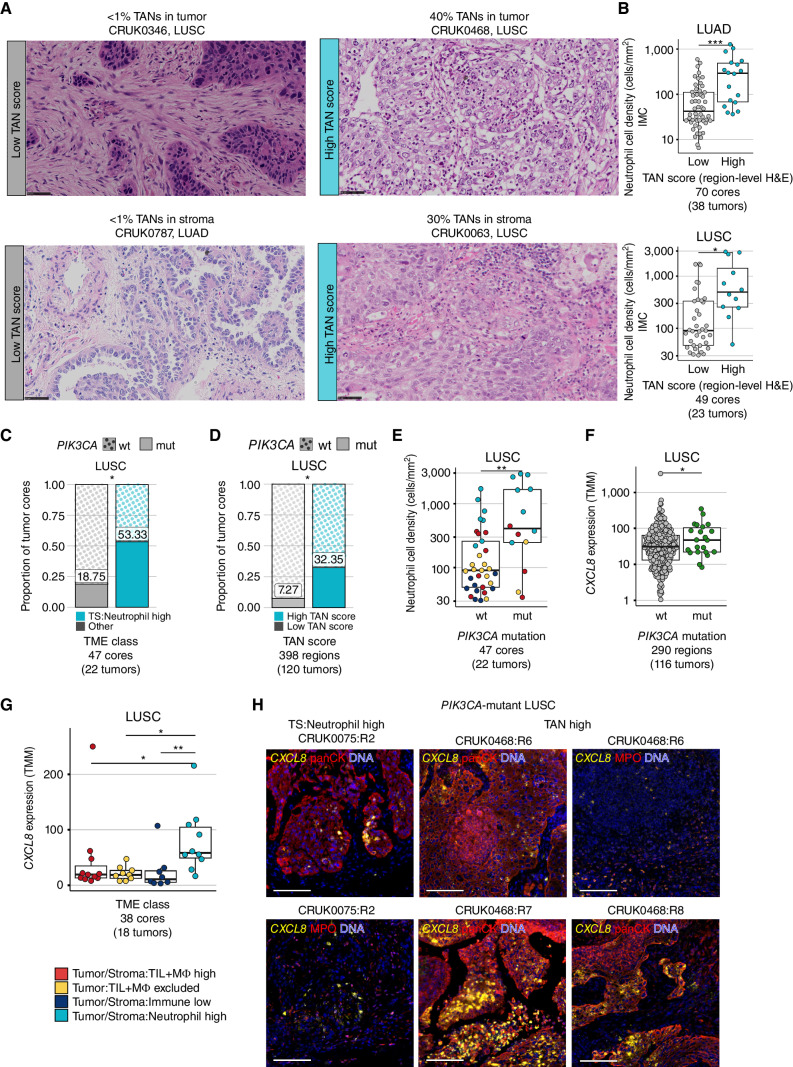
Figure 5. Neutrophil-rich TMEs are associated with activating mutations in PI3K and tumor-intrinsic CXCL8 upregulation. A, Representative crops of tumor-level H&E images with low TAN scores in the tumor nest and stroma (left) and high TAN scores in the tumor nest and stroma (right), inferred as the proportion of the neutrophil area in tumor/stroma from the total tumor/stroma tissue area. Scale bar, 50 μm; 400× magnification. B, Neutrophil cell density as defined by IMC compared between region-level TAN-low versus TAN-high tumor cores based on H&E scores in LUAD and LUSC. C and D, Proportion of tumor cores with (mut) and without (wt) PIK3CA driver mutations compared between TS:Neutrophil high versus other TME classes combined (C) and region-level TAN-High versus TAN-Low cores (D) in LUSC. P values were derived from a Chi-square test. E, Neutrophil cell density by PIK3CA mutation status, points colored by TME class assignment. F and G, TMM expression values for CXCL8 compared by PIK3CA mutation status (F) and between TME classes (G) in LUSC. H, Immunofluorescence images of CXCL8 RNAscope multiplexed with antibody staining of pancytokeratin (panCK) or MPO in an LUSC tumor region with a TS:Neutrophil high TME and subclonal PIK3CA mutation, and an LUSC patient with multiple TAN-high tumor regions and a clonal PIK3CA mutation. panCK and MPO examples for CRUK0075:R2 illustrate the same region of interest, whereas different regions of interest are shown for CRUK0468:R6. Scale bar, 100 μm. P values for B and E were calculated in a linear mixed-effects model with patient as the random-effect covariate. P values in F and G were derived from a limma–voom differential expression analysis correcting for multiple regions per tumor. ·, P < 0.1; *, P < 0.05; **, P < 0.01; ***, P < 0.001; LUAD, lung adenocarcinoma; LUSC, lung squamous cell carcinoma; TMM, trimmed mean of M-values; TS, tumor/stroma; TIL, tumor-infiltrating lymphocyte; MΦ, macrophage; TAN, tumor-associated neutrophils; H&E, hematoxylin and eosin; mt, mutant; wt, wild-type.
Figure 5. Neutrophil-rich TMEs are associated with activating mutations in PI3K and tumor-intrinsic CXCL8 upregulation. A, Representative crops of tumor-level H&E images with low TAN scores in the tumor nest and stroma (left) and high TAN scores in the tumor nest and stroma (right), inferred as the proportion of the neutrophil area in tumor/stroma from the total tumor/stroma tissue area. Scale bar, 50 μm; 400× magnification. B, Neutrophil cell density as defined by IMC compared between region-level TAN-low versus TAN-high tumor cores based on H&E scores in LUAD and LUSC. C and D, Proportion of tumor cores with (mut) and without (wt) PIK3CA driver mutations compared between TS:Neutrophil high versus other TME classes combined (C) and region-level TAN-High versus TAN-Low cores (D) in LUSC. P values were derived from a Chi-square test. E, Neutrophil cell density by PIK3CA mutation status, points colored by TME class assignment. F and G, TMM expression values for CXCL8 compared by PIK3CA mutation status (F) and between TME classes (G) in LUSC. H, Immunofluorescence images of CXCL8 RNAscope multiplexed with antibody staining of pancytokeratin (panCK) or MPO in an LUSC tumor region with a TS:Neutrophil high TME and subclonal PIK3CA mutation, and an LUSC patient with multiple TAN-high tumor regions and a clonal PIK3CA mutation. panCK and MPO examples for CRUK0075:R2 illustrate the same region of interest, whereas different regions of interest are shown for CRUK0468:R6. Scale bar, 100 μm. P values for B and E were calculated in a linear mixed-effects model with patient as the random-effect covariate. P values in F and G were derived from a limma–voom differential expression analysis correcting for multiple regions per tumor. ·, P < 0.1; *, P < 0.05; **, P < 0.01; ***, P < 0.001; LUAD, lung adenocarcinoma; LUSC, lung squamous cell carcinoma; TMM, trimmed mean of M-values; TS, tumor/stroma; TIL, tumor-infiltrating lymphocyte; MΦ, macrophage; TAN, tumor-associated neutrophils; H&E, hematoxylin and eosin; mt, mutant; wt, wild-type.CC BY · PubMed Central
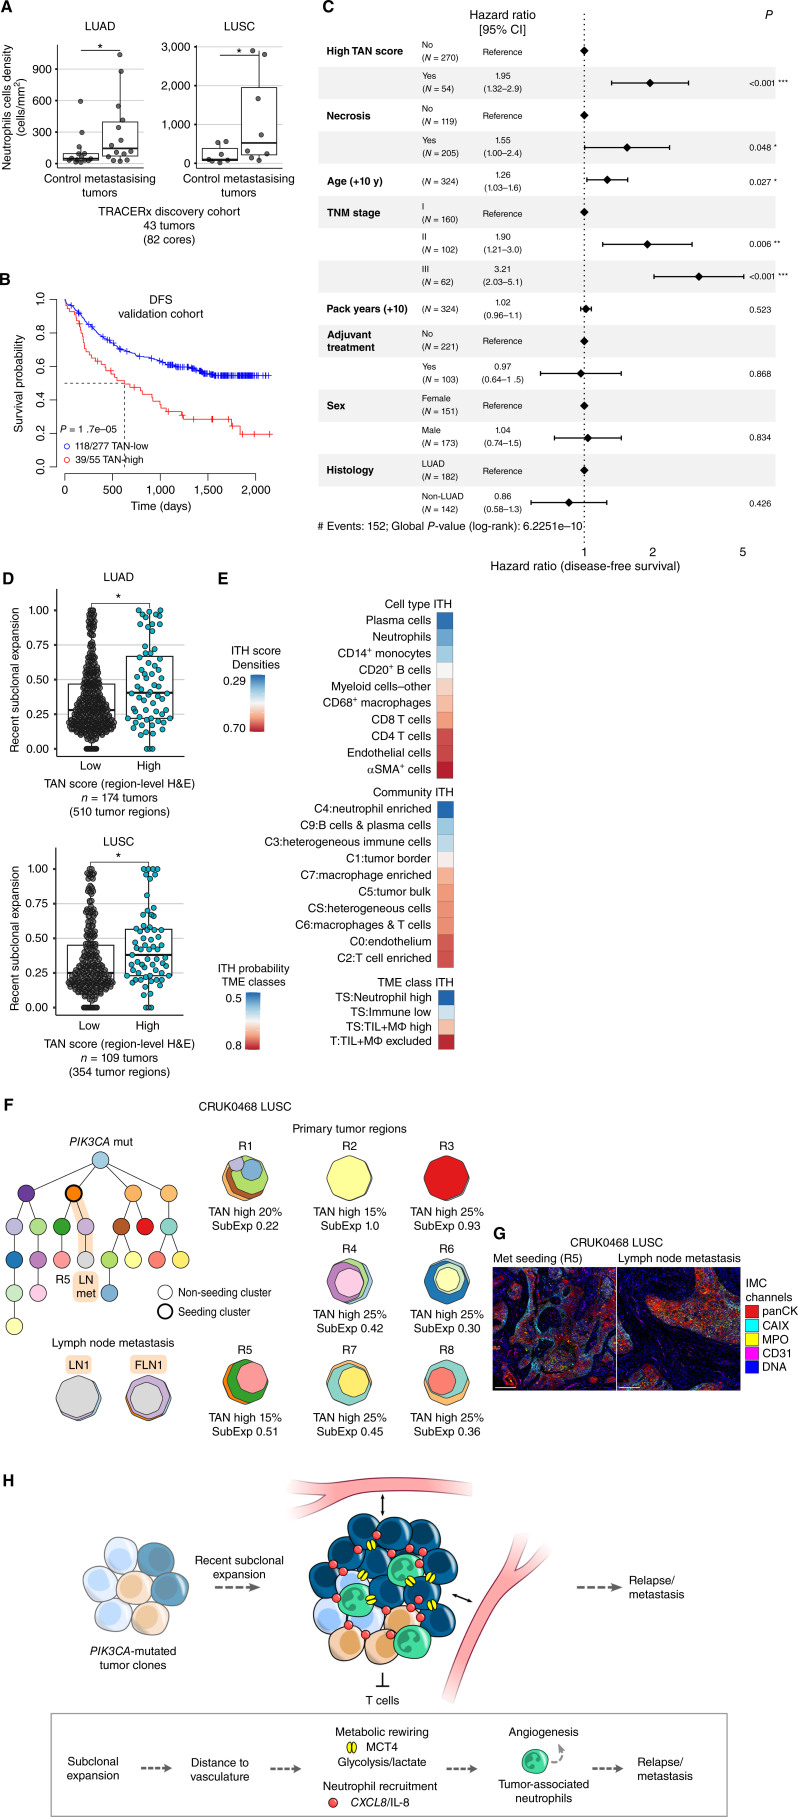
Figure 6. Neutrophil infiltration is associated with recent subclonal expansion and poorer disease-free survival. A, Comparison of neutrophil cell density in primary tumors with metastasis-seeding clones detectable at time of surgery or during follow-up (metastasizing tumors) to tumors from patients who were metastasis-free and recurrence-free for more than 3 years of follow-up time (control) in LUAD (n = 28) and LUSC (n = 15) within the TRACERx discovery cohort. Maximum neutrophil density taken for tumors with multiple tumor cores. P values derived from one-tailed Wilcoxon test. B, Kaplan–Meier curves for DFS according to tumor-level TAN score in the validation cohort (n = 332 patients). P value derived from univariate Cox model adjusted for histology. C, Multivariable Cox proportional hazard regression analysis of DFS using tumor-level TAN score and tumor-level necrosis evaluation from H&E images of diagnostic tumor blocks. D, Recent subclonal expansion score, measured as the maximum cancer cell fraction of subclones at the terminus of the phylogenetic tree, compared between TAN-high and TAN-low tumor regions in LUAD and LUSC patients from the TRACERx 421 cohort. P values were derived from a linear mixed effects model with patient as random effect. E, Spatial ITH score of cell types and communities and ITH probabilities of TME classes in multiregion analysis (pan-immune n = 41 tumors, 112 cores). ITH score was calculated as the average standard deviation of the cell/community density in multiple regions per tumor and z-score transformed. ITH score of αSMA+ cells was derived from T cells and stroma panel (n = 39 tumors, 105 cores). ITH probability was calculated as 1 − probability of all regions having the same indicated TME class. F, Example phylogenetic tree depicting a stage IIIA LUSC case with a clonal PIK3CA mutation, high TAN scores, and recent subclonal expansion, including in a region (R5) that seeded a lymph node (LN) metastasis (FLN, FFPE LN). The metastasis-seeding lineage is highlighted in orange. Tumor-level TAN scores and regional subclonal expansion (SubExp) scores are reported for primary tumor regions. The reported TAN score represents the maximum of the tumor nest and stroma scores. Each cluster in the phylogenetic tree is assigned a color that is also represented in the region clone maps. The clone maps illustrate the prevalence of each clone within a region. G, IMC images shown for R5 and the LN metastasis. Scale bar, 200 μm. H, Summary schematic of the link between tumors with a neutrophil enriched microenvironment with tumor progression. ·, P < 0.1; *, P < 0.05; **, P < 0.01; ***, P < 0.001; LUAD, lung adenocarcinoma; LUSC, lung squamous cell carcinoma; ITH, intratumor heterogeneity.
Figure 6. Neutrophil infiltration is associated with recent subclonal expansion and poorer disease-free survival. A, Comparison of neutrophil cell density in primary tumors with metastasis-seeding clones detectable at time of surgery or during follow-up (metastasizing tumors) to tumors from patients who were metastasis-free and recurrence-free for more than 3 years of follow-up time (control) in LUAD (n = 28) and LUSC (n = 15) within the TRACERx discovery cohort. Maximum neutrophil density taken for tumors with multiple tumor cores. P values derived from one-tailed Wilcoxon test. B, Kaplan–Meier curves for DFS according to tumor-level TAN score in the validation cohort (n = 332 patients). P value derived from univariate Cox model adjusted for histology. C, Multivariable Cox proportional hazard regression analysis of DFS using tumor-level TAN score and tumor-level necrosis evaluation from H&E images of diagnostic tumor blocks. D, Recent subclonal expansion score, measured as the maximum cancer cell fraction of subclones at the terminus of the phylogenetic tree, compared between TAN-high and TAN-low tumor regions in LUAD and LUSC patients from the TRACERx 421 cohort. P values were derived from a linear mixed effects model with patient as random effect. E, Spatial ITH score of cell types and communities and ITH probabilities of TME classes in multiregion analysis (pan-immune n = 41 tumors, 112 cores). ITH score was calculated as the average standard deviation of the cell/community density in multiple regions per tumor and z-score transformed. ITH score of αSMA+ cells was derived from T cells and stroma panel (n = 39 tumors, 105 cores). ITH probability was calculated as 1 − probability of all regions having the same indicated TME class. F, Example phylogenetic tree depicting a stage IIIA LUSC case with a clonal PIK3CA mutation, high TAN scores, and recent subclonal expansion, including in a region (R5) that seeded a lymph node (LN) metastasis (FLN, FFPE LN). The metastasis-seeding lineage is highlighted in orange. Tumor-level TAN scores and regional subclonal expansion (SubExp) scores are reported for primary tumor regions. The reported TAN score represents the maximum of the tumor nest and stroma scores. Each cluster in the phylogenetic tree is assigned a color that is also represented in the region clone maps. The clone maps illustrate the prevalence of each clone within a region. G, IMC images shown for R5 and the LN metastasis. Scale bar, 200 μm. H, Summary schematic of the link between tumors with a neutrophil enriched microenvironment with tumor progression. ·, P < 0.1; *, P < 0.05; **, P < 0.01; ***, P < 0.001; LUAD, lung adenocarcinoma; LUSC, lung squamous cell carcinoma; ITH, intratumor heterogeneity.CC BY · PubMed Central

Verification

Claims the paper makes

The claims and statistics of this paper haven’t been checked yet.

Run the check — free, no account needed. It reads the open-access text and checks the sources it cites.

A few free checks a day · papers already verified open instantly · results are public

Claims other papers make about this one

Each is checked against this paper’s own text: does it say what the citing paper says it does?

Self-check

Percentages, sums and reported differences re-computed from the paper’s own numbers.

The self-check needs the paper’s full text.

Citations

Cites

Show all 10 references

Research works printed but not linked: 86

  1. Sorin, 2023, Single-cell spatial landscapes of the lung tumour immune microenvironment, Nature, 614, 548, 10.1038/s41586-022-05672-3 · DOI
  2. Ali, 2020, Imaging mass cytometry and multiplatform genomics define the phenogenomic landscape of breast cancer, Nat Cancer, 1, 163, 10.1038/s43018-020-0026-6 · DOI
  3. Jackson, 2020, The single-cell pathology landscape of breast cancer, Nature, 578, 615, 10.1038/s41586-019-1876-x · DOI
  4. Danenberg, 2022, Breast tumor microenvironment structures are associated with genomic features and clinical outcome, Nat Genet, 54, 660, 10.1038/s41588-022-01041-y · DOI
  5. Wang, 2023, Spatial predictors of immunotherapy response in triple-negative breast cancer, Nature, 621, 868, 10.1038/s41586-023-06498-3 · DOI
  6. Li, 2021, Characterization of the tumor immune microenvironment in lung squamous cell carcinoma using imaging mass cytometry, Front Oncol, 11, 620989, 10.3389/fonc.2021.620989 · DOI
  7. Karimi, 2023, Single-cell spatial immune landscapes of primary and metastatic brain tumours, Nature, 614, 555, 10.1038/s41586-022-05680-3 · DOI
  8. Cords, 2024, Cancer-associated fibroblast phenotypes are associated with patient outcome in non-small cell lung cancer, Cancer Cell, 42, 396, 10.1016/j.ccell.2023.12.021 · DOI
  9. Rosenthal, 2019, Neoantigen-directed immune escape in lung cancer evolution, Nature, 567, 479, 10.1038/s41586-019-1032-7 · DOI · Paper page
  10. McGranahan, 2017, Allele-specific HLA loss and immune escape in lung cancer evolution, Cell, 171, 1259, 10.1016/j.cell.2017.10.001 · DOI · Paper page
  11. Martínez-Ruiz, 2023, Genomic-transcriptomic evolution in lung cancer and metastasis, Nature, 616, 543, 10.1038/s41586-023-05706-4 · DOI
  12. Frankell, 2023, The evolution of lung cancer and impact of subclonal selection in TRACERx, Nature, 616, 525, 10.1038/s41586-023-05783-5 · DOI
  13. Al Bakir, 2023, The evolution of non-small cell lung cancer metastases in TRACERx, Nature, 616, 534, 10.1038/s41586-023-05729-x · DOI
  14. Ghorani, 2020, The T cell differentiation landscape is shaped by tumour mutations in lung cancer, Nat Cancer, 1, 546, 10.1038/s43018-020-0066-y · DOI
  15. Ricciuti, 2022, Association of high tumor mutation burden in non-small cell lung cancers with increased immune infiltration and improved clinical outcomes of PD-L1 blockade across PD-L1 expression levels, JAMA Oncol, 8, 1160, 10.1001/jamaoncol.2022.1981 · DOI
  16. Salmon, 2012, Matrix architecture defines the preferential localization and migration of T cells into the stroma of human lung tumors, J Clin Invest, 122, 899, 10.1172/JCI45817 · DOI · Paper page
  17. Grout, 2022, Spatial positioning and matrix programs of cancer-associated fibroblasts promote T-cell exclusion in human lung tumors, Cancer Discov, 12, 2606, 10.1158/2159-8290.CD-21-1714 · DOI
  18. AbdulJabbar, 2020, Geospatial immune variability illuminates differential evolution of lung adenocarcinoma, Nat Med, 26, 1054, 10.1038/s41591-020-0900-x · DOI
  19. Gentles, 2015, The prognostic landscape of genes and infiltrating immune cells across human cancers, Nat Med, 21, 938, 10.1038/nm.3909 · DOI
  20. Kargl, 2017, Neutrophils dominate the immune cell composition in non-small cell lung cancer, Nat Commun, 8, 14381, 10.1038/ncomms14381 · DOI
  21. Lee, 2015, A lactate-induced response to hypoxia, Cell, 161, 595, 10.1016/j.cell.2015.03.011 · DOI
  22. DePeaux, 2021, Metabolic barriers to cancer immunothe­rapy, Nat Rev Immunol, 21, 785, 10.1038/s41577-021-00541-y · DOI
  23. Dimmer, 2000, The low-affinity monocarboxylate transporter MCT4 is adapted to the export of lactate in highly glycolytic cells, Biochem J, 350, 219, 10.1042/bj3500219 · DOI
  24. Spranger, 2018, Impact of oncogenic pathways on evasion of antitumour immune responses, Nat Rev Cancer, 18, 139, 10.1038/nrc.2017.117 · DOI
  25. Altorki, 2019, The lung microenvironment: an important regulator of tumour growth and metastasis, Nat Rev Cancer, 19, 9, 10.1038/s41568-018-0081-9 · DOI
  26. Salgado, 2015, The evaluation of tumor-infiltrating lymphocytes (TILs) in breast cancer: recommendations by an International TILs Working Group 2014, Ann Oncol, 26, 259, 10.1093/annonc/mdu450 · DOI
  27. Salcher, 2022, High-resolution single-cell atlas reveals diversity and plasticity of tissue-resident neutrophils in non-small cell lung cancer, Cancer Cell, 40, 1503, 10.1016/j.ccell.2022.10.008 · DOI
  28. Simoncello, 2022, CXCL5-mediated accumulation of mature neutrophils in lung cancer tissues impairs the differentiation program of anticancer CD8 T cells and limits the efficacy of checkpoint inhibitors, Oncoimmunology, 11, 2059876, 10.1080/2162402X.2022.2059876 · DOI
  29. Janiszewska, 2019, Subclonal cooperation drives metastasis by modulating local and systemic immune microenvironments, Nat Cell Biol, 21, 879, 10.1038/s41556-019-0346-x · DOI
  30. Giese, 2019, Neutrophil plasticity in the tumor microenvironment, Blood, 133, 2159, 10.1182/blood-2018-11-844548 · DOI
  31. Teijeira, 2021, IL8, neutrophils, and NETs in a collusion against cancer immunity and immunotherapy, Clin Cancer Res, 27, 2383, 10.1158/1078-0432.CCR-20-1319 · DOI
  32. Park, 2011, Tumor necrosis as a prognostic factor for stage IA non-small cell lung cancer, Ann Thorac Surg, 91, 1668, 10.1016/j.athoracsur.2010.12.028 · DOI
  33. Diao, 2021, Human-interpretable image features derived from densely mapped cancer pathology slides predict diverse molecular phenotypes, Nat Commun, 12, 1613, 10.1038/s41467-021-21896-9 · DOI
  34. Thorsson, 2018, The immune landscape of cancer, Immunity, 48, 812, 10.1016/j.immuni.2018.03.023 · DOI · Paper page
  35. Combes, 2022, Discovering dominant tumor immune archetypes in a pan-cancer census, Cell, 185, 184, 10.1016/j.cell.2021.12.004 · DOI
  36. Li, 2019, Infiltration of CD8+ T cells into tumor cell clusters in triple-negative breast cancer, Proc Natl Acad Sci U S A, 116, 3678, 10.1073/pnas.1817652116 · DOI
  37. Ravi, 2023, Genomic and transcriptomic analysis of checkpoint blockade response in advanced non-small cell lung cancer, Nat Genet, 55, 807, 10.1038/s41588-023-01355-5 · DOI
  38. Peranzoni, 2018, Macrophages impede CD8 T cells from reaching tumor cells and limit the efficacy of anti-PD-1 treatment, Proc Natl Acad Sci U S A, 115, E4041, 10.1073/pnas.1720948115 · DOI
  39. Kersten, 2022, Spatiotemporal co-dependency between macrophages and exhausted CD8+ T cells in cancer, Cancer Cell, 40, 624, 10.1016/j.ccell.2022.05.004 · DOI
  40. Mantovani, 2022, Macrophages as tools and targets in cancer therapy, Nat Rev Drug Discov, 21, 799, 10.1038/s41573-022-00520-5 · DOI · Paper page
  41. Litchfield, 2021, Meta-analysis of tumor- and T cell-intrinsic mechanisms of sensitization to checkpoint inhibition, Cell, 184, 596, 10.1016/j.cell.2021.01.002 · DOI · Paper page
  42. Patil, 2022, Intratumoral plasma cells predict outcomes to PD-L1 blockade in non-small cell lung cancer, Cancer Cell, 40, 289, 10.1016/j.ccell.2022.02.002 · DOI
  43. Vanhersecke, 2021, Mature tertiary lymphoid structures predict immune checkpoint inhibitor efficacy in solid tumors independently of PD-L1 expression, Nat Cancer, 2, 794, 10.1038/s43018-021-00232-6 · DOI
  44. Rizvi, 2015, Cancer immunology. mutational landscape determines sensiti­vity to PD-1 blockade in non-small cell lung cancer, Science, 348, 124, 10.1126/science.aaa1348 · DOI · Paper page
  45. Ng, 2023, Antibodies against endogenous retroviruses promote lung cancer immunotherapy, Nature, 616, 563, 10.1038/s41586-023-05771-9 · DOI
  46. Hao, 2022, The single-cell immunogenomic landscape of B and plasma cells in early-stage lung adenocarcinoma, Cancer Discov, 12, 2626, 10.1158/2159-8290.CD-21-1658 · DOI
  47. Leader, 2021, Single-cell analysis of human non-small cell lung cancer lesions refines tumor classification and patient stratification, Cancer Cell, 39, 1594, 10.1016/j.ccell.2021.10.009 · DOI
  48. Templeton, 2014, Prognostic role of neutrophil-to-lymphocyte ratio in solid tumors: a systematic review and meta-analysis, J Natl Cancer Inst, 106, dju124, 10.1093/jnci/dju124 · DOI
  49. Rakaee, 2016, Prognostic effect of intratumoral neutrophils across histological subtypes of non-small cell lung cancer, Oncotarget, 7, 72184, 10.18632/oncotarget.12360 · DOI
  50. Carus, 2013, Tumor-associated neutrophils and macrophages in non-small cell lung cancer: no immediate impact on patient outcome, Lung Cancer, 81, 130, 10.1016/j.lungcan.2013.03.003 · DOI
  51. Ballesteros, 2020, Co-option of neutrophil fates by tissue environments, Cell, 183, 1282, 10.1016/j.cell.2020.10.003 · DOI
  52. Szczerba, 2019, Neutrophils escort circulating tumour cells to enable cell cycle progression, Nature, 566, 553, 10.1038/s41586-019-0915-y · DOI
  53. Faget, 2017, Neutrophils and snail orchestrate the establishment of a pro-tumor microenvironment in lung cancer, Cell Rep, 21, 3190, 10.1016/j.celrep.2017.11.052 · DOI
  54. Varrone, 2024, CellCharter reveals spatial cell niches associated with tissue remodeling and cell plasticity, Nat Genet, 56, 74, 10.1038/s41588-023-01588-4 · DOI
  55. Schuurbiers, 2014, Glucose metabolism in NSCLC is histology-specific and diverges the prognostic potential of 18FDG-PET for adenocarcinoma and squamous cell carcinoma, J Thorac Oncol, 9, 1485, 10.1097/JTO.0000000000000286 · DOI
  56. Wculek, 2015, Neutrophils support lung colonization of metastasis-initiating breast cancer cells, Nature, 528, 413, 10.1038/nature16140 · DOI
  57. van Maldegem, 2021, Characterisation of tumour microenvironment remodelling following oncogene inhibition in preclinical studies with imaging mass cytometry, Nat Commun, 12, 5906, 10.1038/s41467-021-26214-x · DOI
  58. Sparmann, 2004, Ras-induced interleukin-8 expression plays a critical role in tumor growth and angiogenesis, Cancer Cell, 6, 447, 10.1016/j.ccr.2004.09.028 · DOI
  59. Lin, 2006, c-Src mediates thrombin-induced NF-kappaB activation and IL-8/CXCL8 expression in lung epithelial cells, J Immunol, 177, 3427, 10.4049/jimmunol.177.5.3427 · DOI
  60. Hao, 2016, Oncogenic PIK3CA mutations reprogram glutamine metabolism in colorectal cancer, Nat Commun, 7, 11971, 10.1038/ncomms11971 · DOI · Paper page
  61. Koundouros, 2020, Metabolic fingerprinting links oncogenic PIK3CA with enhanced arachidonic acid-derived eicosanoids, Cell, 181, 1596, 10.1016/j.cell.2020.05.053 · DOI
  62. Hutti, 2012, Oncogenic PI3K mutations lead to NF-κB-dependent cytokine expression following growth factor deprivation, Cancer Res, 72, 3260, 10.1158/0008-5472.CAN-11-4141 · DOI
  63. Lu, 2023, Perioperative toripalimab + platinum-doublet chemotherapy vs chemotherapy in resectable stage II/III non-small cell lung cancer (NSCLC): interim event-free survival (EFS) analysis of the phase III Neotorch study, J Clin Orthod, 41, 425126
  64. Heymach, 2023, Abstract CT005: AEGEAN: a phase 3 trial of neoadjuvant durvalumab + chemotherapy followed by adjuvant durvalumab in patients with resectable NSCLC, Cancer Res, 83, CT005, 10.1158/1538-7445.AM2023-CT005 · DOI
  65. Shim, 2020, HLA-corrected tumor mutation burden and homologous recombination deficiency for the prediction of response to PD-(L)1 blockade in advanced non-small-cell lung cancer patients, Ann Oncol, 31, 902, 10.1016/j.annonc.2020.04.004 · DOI
  66. Jenkins, 2022, Cancer-associated fibroblasts suppress CD8+ T-cell infiltration and confer resistance to immune-checkpoint blockade, Cancer Res, 82, 2904, 10.1158/0008-5472.CAN-21-4141 · DOI
  67. Hu, 2021, Three subtypes of lung cancer fibroblasts define distinct therapeutic paradigms, Cancer Cell, 39, 1531, 10.1016/j.ccell.2021.09.003 · DOI
  68. Schalper, 2020, Elevated serum interleukin-8 is associated with enhanced intratumor neutrophils and reduced clinical benefit of immune-checkpoint inhibitors, Nat Med, 26, 688, 10.1038/s41591-020-0856-x · DOI
  69. Yuen, 2020, High systemic and tumor-associated IL-8 correlates with reduced clinical benefit of PD-L1 blockade, Nat Med, 26, 693, 10.1038/s41591-020-0860-1 · DOI
  70. Teijeira, 2020, CXCR1 and CXCR2 chemokine receptor agonists produced by tumors induce neutrophil extracellular traps that interfere with immune cytotoxicity, Immunity, 52, 856, 10.1016/j.immuni.2020.03.001 · DOI
  71. Karasaki, 2023, Evolutionary characterization of lung adenocarcinoma morphology in TRACERx, Nat Med, 29, 833, 10.1038/s41591-023-02230-w · DOI
  72. Catena, 2018, Ruthenium counterstaining for imaging mass cytometry, J Pathol, 244, 479, 10.1002/path.5049 · DOI
  73. Chevrier, 2018, Compensation of signal spillover in suspension and imaging mass cytometry, Cell Syst, 6, 612, 10.1016/j.cels.2018.02.010 · DOI
  74. McQuin, 2018, CellProfiler 3.0: Next-generation image processing for biology, PLoS Biol, 16, e2005970, 10.1371/journal.pbio.2005970 · DOI
  75. Zhang, 2019, Probabilistic cell-type assignment of single-cell RNA-seq for tumor microenvironment profiling, Nat Methods, 16, 1007, 10.1038/s41592-019-0529-1 · DOI
  76. Berg, 2019, ilastik: interactive machine learning for (bio)image analysis, Nat Methods, 16, 1226, 10.1038/s41592-019-0582-9 · DOI
  77. Schürch, 2020, Coordinated cellular neighborhoods orchestrate antitumoral immunity at the colorectal cancer invasive front, Cell, 182, 1341, 10.1016/j.cell.2020.07.005 · DOI
  78. Eling, 2020, Cytomapper: an R/bioconductor package for visualisation of highly multiplexed imaging data, Bioinformatics, 36, 5706, 10.1093/bioinformatics/btaa1061 · DOI
  79. Failmezger, 2020, Topological tumor graphs: a graph-based spatial model to infer stromal recruitment for immunosuppression in melanoma histology, Cancer Res, 80, 1199, 10.1158/0008-5472.CAN-19-2268 · DOI
  80. Marafioti, 2003, Phenotype and genotype of interfollicular large B cells, a subpopulation of lymphocytes often with dendritic morphology, Blood, 102, 2868, 10.1182/blood-2003-03-0692 · DOI
  81. Schapiro, 2017, histoCAT: analysis of cell phenotypes and interactions in multiplex image cytometry data, Nat Methods, 14, 873, 10.1038/nmeth.4391 · DOI
  82. Merino, 2020, Establishing guidelines to harmonize tumor mutational burden (TMB): in silico assessment of variation in TMB quantification across diagnostic platforms: phase I of the Friends of Cancer Research TMB Harmonization Project, J Immunother Cancer, 8, e000147, 10.1136/jitc-2019-000147 · DOI
  83. Mermel, 2011, GISTIC2.0 facilitates sensitive and confident localization of the targets of focal somatic copy-number alteration in human cancers, Genome Biol, 12, R41, 10.1186/gb-2011-12-4-r41 · DOI
  84. Reynisson, 2020, NetMHCpan-4.1 and NetMHCIIpan-4.0: improved predictions of MHC antigen presentation by concurrent motif deconvolution and integration of MS MHC eluted ligand data, Nucleic Acids Res, 48, W449, 10.1093/nar/gkaa379 · DOI · Paper page
  85. Kawaguchi, 2020, High-definition genomic analysis of HLA genes via comprehensive HLA allele genotyping, Methods Mol Biol, 2131, 31, 10.1007/978-1-0716-0389-5_3 · DOI
  86. Grigoriadis, 2024, CONIPHER: a computational framework for scalable phylogenetic reconstruction with error correction, Nat Protoc, 19, 159, 10.1038/s41596-023-00913-9 · DOI

Cited by

Sorted by citations

Metadata

Authors
Enfield, K. S. S., Colliver, E., Lee, C., Magness, A., Moore, D. A., Sivakumar, M., Grigoriadis, K., Pich, O., Karasaki, T., Hobson, P. S., Levi, D., Veeriah, S., Puttick, C., Nye, E. L., Green, M., Dijkstra, K. K., Shimato, M., Akarca, A. U., Marafioti, T., Salgado, R., Hackshaw, A., TRACERx consortium, Jamal-Hanjani, M., van Maldegem, F., McGranahan, N., Glass, B., Pulaski, H., Walk, E., Reading, J. L., Quezada, S. A., Hiley, C. T., Downward, J., Sahai, E., Swanton, C., & Angelova, M.
Venue
Cancer Discovery
Published
2024-04-12
Volume
14
Issue
6
Pages
1018-1047
ISSN
  • 2159-8274
  • 2159-8290
Cited by
151
References
10
Language
en
Funders
  • Royal Society (RP/EA/180007, RF\ERE\231118, 211179/Z/18/Z, RF\ERE\210216)
  • UCLH Biomedical Research Centre
  • CRUK Lung Cancer Centre of Excellence (C11496/A30025)
  • Breast Cancer Research Foundation (BCRF-22-157)
  • Cancer Research UK (Grant EDDPMA-Nov21/100034, C11496/A17786, C416/A21999, CRUK Cancer Immunotherapy Catalyst Network)
  • Mark Foundation For Cancer Research (Grant 21-029-ASP, 23-034-ASP, MFCR ASPIRE 2022- 0384)
  • Stand Up To Cancer (SU2C-AACR-DT23-17)
  • HORIZON EUROPE European Research Council (835297, 101079113)
  • European Research Council (101019366)
  • Francis Crick Institute (CC2040, CC2041)
  • Medical Research Council Centre for Neurodevelopmental Disorders (CC2040)
  • Wellcome Trust (CC2040, 211179/Z/18/Z, CC2041)
  • Amsterdam University Medical Centers (Amsterdam UMC Fellowship)
  • HORIZON EUROPE Marie Sklodowska-Curie Actions (101024529, 838540)
  • ZonMw (20-45200-98-20102)
  • Japan Society for the Promotion of Science London (202060447)
  • Rosetrees Trust
  • Novo Nordisk Foundation Center for Basic Metabolic Research (ID16584)
  • Medical Research Council (CC2041)

About these checks

Registry, retraction, Cites and statistics results are computed, not judged, with one exception: a printed reference that no index lists is read once by a model before it counts as a citation error. Claims are extracted by a model and kept only when their quote appears verbatim in the text; each cited source is then checked, with a model’s help, for whether it says what the claim relies on. Those verdicts can be wrong — read the claim’s quote and the cited source before relying on one.

Statistics and arithmetic are recomputed, not judged.

Confidence bands are shown only for fields calibrated on our annotated test set. None is calibrated yet, so no band is shown.

What counts as a claim ›How we measure confidence ›How we check this ›

Are you an author, or do you see a problem with this page? Request a review