

The DOI matches its Crossref record.
Atopy Is Inversely Related to Schistosome Infection Intensity: A Comparative Study in Zimbabwean Villages with Distinct Levels of Schistosoma haematobium Infection
Abstract
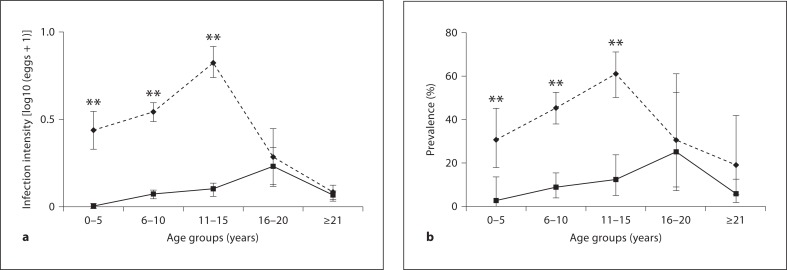
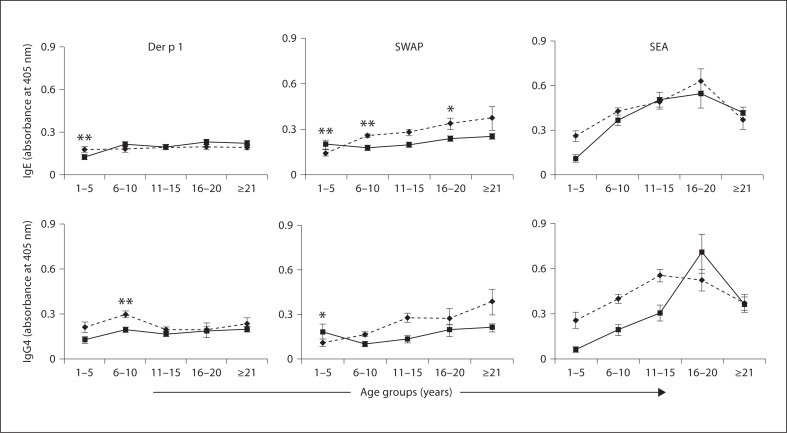
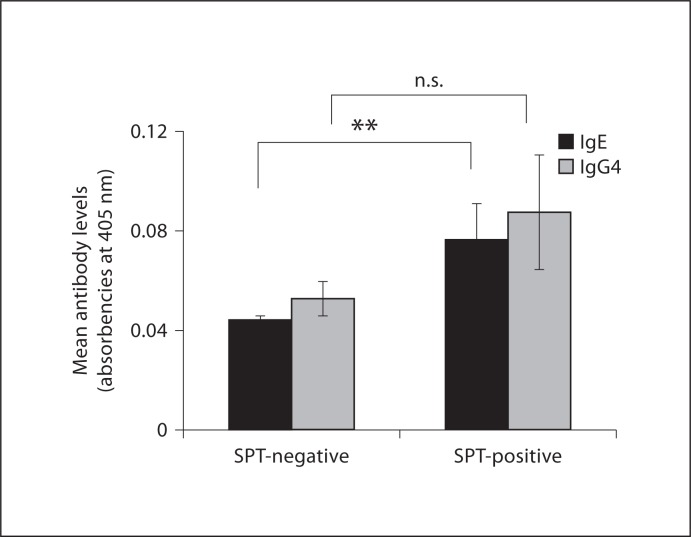
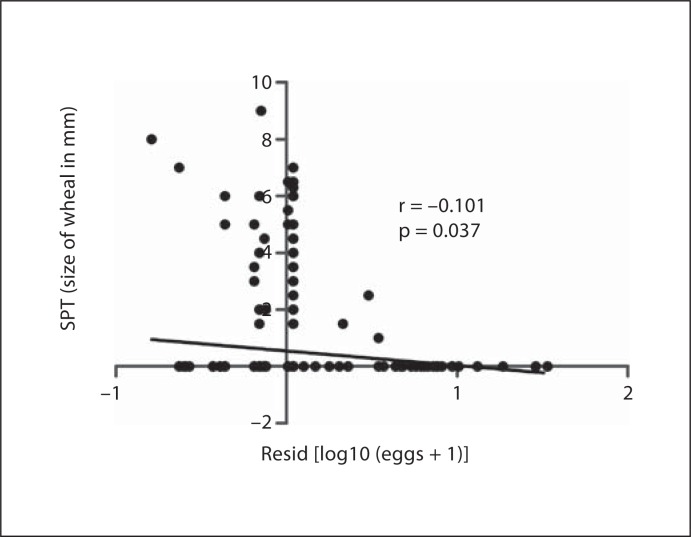
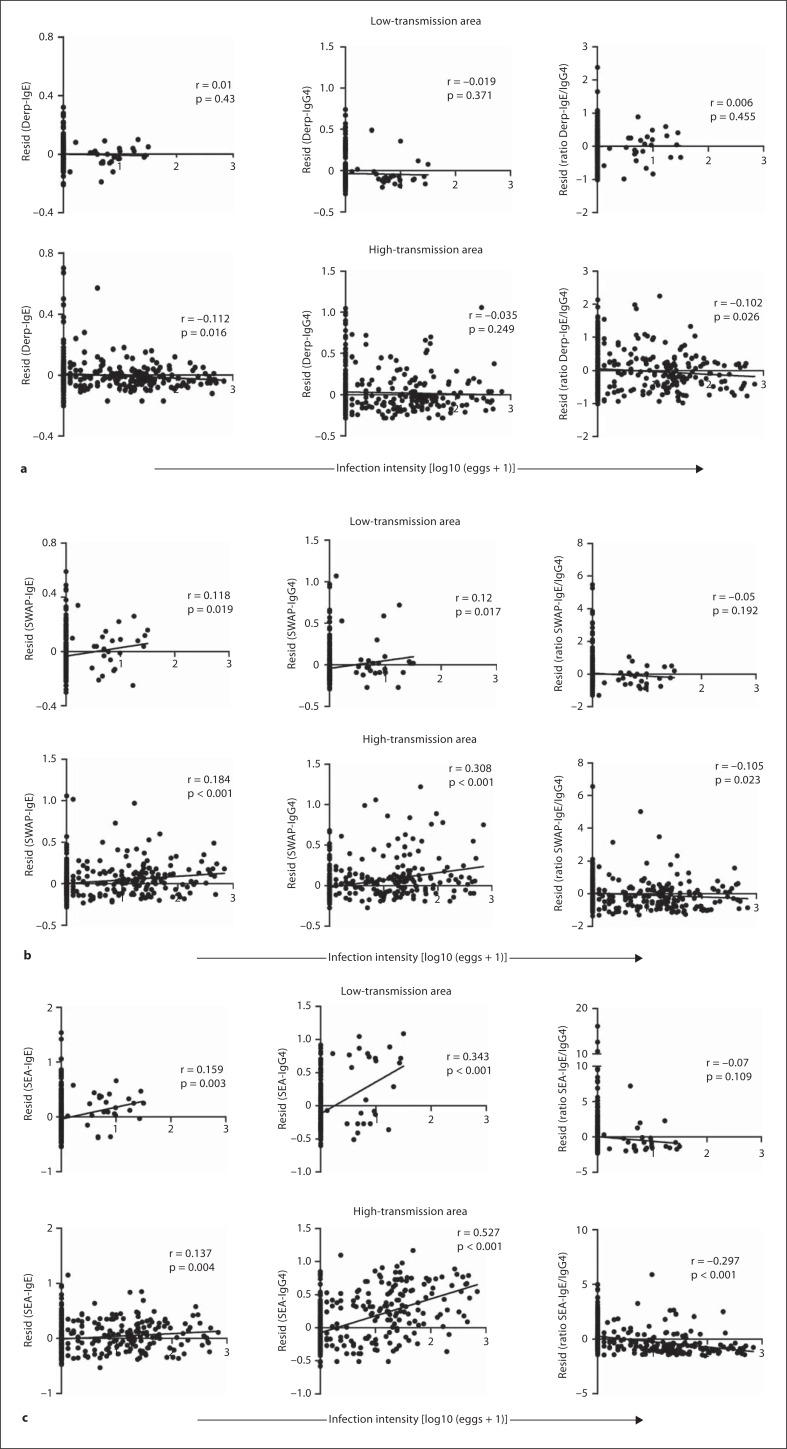
Background: The hygiene hypothesis suggests that parasitic infections protect against allergic diseases by modulating the host’s immune responses. Experimental studies indicate that this protection depends on the intensity of parasitic infection, but this observation has not been tested in human populations. The aim of this study is to investigate whether the intensity of Schistosoma haematobium infection is related to atopic responses and whether this relationship differs between populations with distinct parasite transmission dynamics. Methods: The study was conducted in two villages with different Schistosoma haematobium transmission dynamics, i.e. high (n = 365) and low (n = 307) transmission. Allergic reactivity to the common house dust mite (Dermatophagoides pteronyssinus) was measured by skin prick tests and allergen-specific IgE and IgG4 quantified by enzyme-linked immunosorbent assay. Atopic responses were related to current infection intensity and schistosome transmission levels. Results: Schistosome infection intensity was negatively associated with the skin prick reactivity, mite-specific IgE and the ratio IgE/IgG4 in the high-transmission village. However, when only low levels of infection were analyzed in the 2 villages, there was no correlation between mite-specific responses and infection intensity. Conclusion: The relationship between schistosome infection and atopic responses is dependent on the intensity of current schistosome infection. Thus, consistent with results from animal models, with an increasing parasite burden, the immunoregulation of immune responses to allergens appears to become more pronounced.
Overview
The claims and statistics of this paper haven’t been checked yet.
Run the check — free, no account needed. It reads the open-access text and checks the sources it cites.
Integrity signals
Registry
Cites
Statistics
Figures
Verification
Claims the paper makes
The claims and statistics of this paper haven’t been checked yet.
Run the check — free, no account needed. It reads the open-access text and checks the sources it cites.
Claims other papers make about this one
Each is checked against this paper’s own text: does it say what the citing paper says it does?
In the citing paper
“In areas where parasitic infections are endemic, exposure to parasites, particularly helminths (parasitic worms), is frequent and prolonged, leading to continuous modulation of the immune system”
From Parasites and allergies: a complex bidirectional relationship from evolutionary origins to modern therapeutics (2026) · cites this paper as Rujeni et al. 2012
Self-check
Percentages, sums and reported differences re-computed from the paper’s own numbers.
The self-check needs the paper’s full text.
Citations
Cites
No references could be resolved yet.
Research works printed but not linked: 32
- 10.1016%2Fj.jaci.2003.12.591 · DOI · Paper page
- 10.1016%2Fj.jaci.2007.08.066 · DOI
- 10.1046%2Fj.1365-2249.2002.01908.x · DOI
- 10.1038%2F35095579 · DOI
- 10.1016%2FS0140-6736%2897%2907302-9 · DOI
- 10.1038%2Fnri1183 · DOI
- 10.1164%2Frccm.2107020 · DOI
- 10.1016%2Fj.jaci.2007.06.009 · DOI
- 10.1016%2FS0140-6736%2800%2903206-2 · DOI
- 10.1084%2Fjem.20042572 · DOI
- 10.1046%2Fj.1365-3024.1997.d01-206.x · DOI
- 10.1038%2F351757a0 · DOI
- 10.1159%2F000068377 · DOI
- 10.1017%2FS003118200007414X · DOI
- 10.1046%2Fj.1365-3024.1997.d01-206.x · DOI
- 10.1038%2F15169 · DOI
- 10.1371%2Fjournal.pntd.0001218 · DOI
- 10.1016%2Fj.actatropica.2010.02.010 · DOI
- 10.1186%2F1471-2334-8-158 · DOI
- 10.1111%2Fj.1365-3024.2010.01235.x · DOI
- 10.1159%2F000049519 · DOI
- 10.1016%2FS1473-3099%2802%2900240-2 · DOI
- 10.1016%2FS0169-4758%2898%2901318-0 · DOI
- 10.1038%2F349243a0 · DOI
- 10.1016%2FS0035-9203%2897%2990047-X · DOI
- 10.1016%2FS0091-6749%2899%2970536-1 · DOI · Paper page
- 10.1067%2Fmai.2003.158 · DOI
- 10.1111%2Fj.1365-2222.2009.03207.x · DOI
- 10.1157%2F13080927 · DOI
- 10.1111%2Fj.1398-9995.2010.02512.x · DOI · Paper page
- 10.1155%2F2010%2F743758 · DOI
- 10.1038%2Fnri2730 · DOI
Cited by
Sorted by citations
Packi, K., Świerczewski, D., Klimczak, S., Ochab, D., Gałęziewska, J., Gromek, P., Kruczkowska, W., Płuciennik, E., Kałuzińska-Kołat, Ż., & Kołat, D. (2026) · Antonie van Leeuwenhoek · doi:10.1007/s10482-026-02425-4
Metadata
- Authors
- Rujeni, N., Nausch, N., Bourke, C. D., Midzi, N., Mduluza, T., Taylor, D. W., & Mutapi, F.
- Venue
- International Archives of Allergy and Immunology
- Publisher
- S. Karger AG
- Published
- 2012
- Volume
- 158
- Issue
- 3
- Pages
- 288-298
- ISSN
- 1018-2438
- 1423-0097
- PMC
- PMC3398828
- Cited by
- 47
- References
- 0
- Language
- en
About these checks
Registry, retraction, Cites and statistics results are computed, not judged, with one exception: a printed reference that no index lists is read once by a model before it counts as a citation error. Claims are extracted by a model and kept only when their quote appears verbatim in the text; each cited source is then checked, with a model’s help, for whether it says what the claim relies on. Those verdicts can be wrong — read the claim’s quote and the cited source before relying on one.
Statistics and arithmetic are recomputed, not judged.
Confidence bands are shown only for fields calibrated on our annotated test set. None is calibrated yet, so no band is shown.
What counts as a claim ›How we measure confidence ›How we check this ›
Are you an author, or do you see a problem with this page? Request a review
