

The DOI matches its Crossref record.
Power-law Behaviour and Inequality in the Upper Tail of Wealth, Income and Consumption: Evidence from India
Published version of a preprint
Abstract
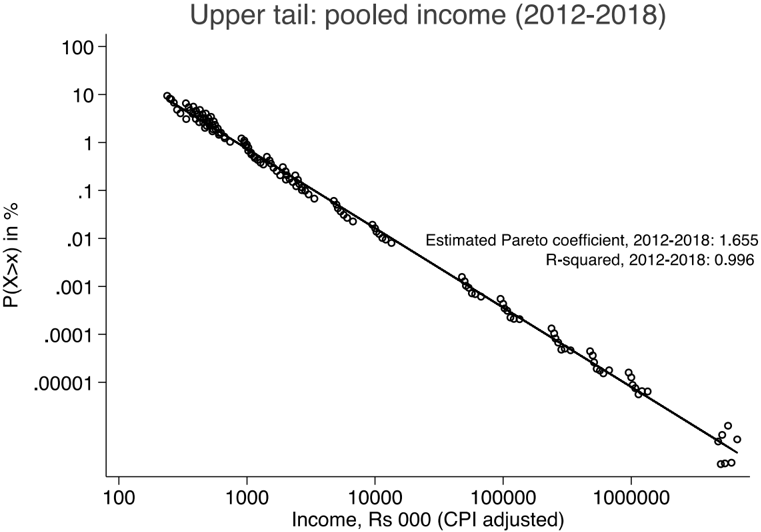
This article analyses the upper tails of wealth, income and consumption in India over the period 2012–2018 using rich lists, wealth surveys, income tax returns and consumer expenditure surveys. We find the upper tail to obey a power-law in all three economic resources. Comparing our estimates in 2012—where we possess data on wealth, income and consumption simultaneously—we find that the upper tail of wealth is most concentrated, income slightly less, and consumption is much less concentrated. Unlike wealth and income, the Pareto coefficients for consumption are estimated to have a well-defined mean and variance. Our findings are suggestive of convex saving functions in the income distribution. JEL Codes: D31, O16, O53
Overview
The claims and statistics of this paper haven’t been checked yet.
Run the check — free, no account needed. It reads the open-access text and checks the sources it cites.
Integrity signals
Registry
Cites
Statistics
Figures
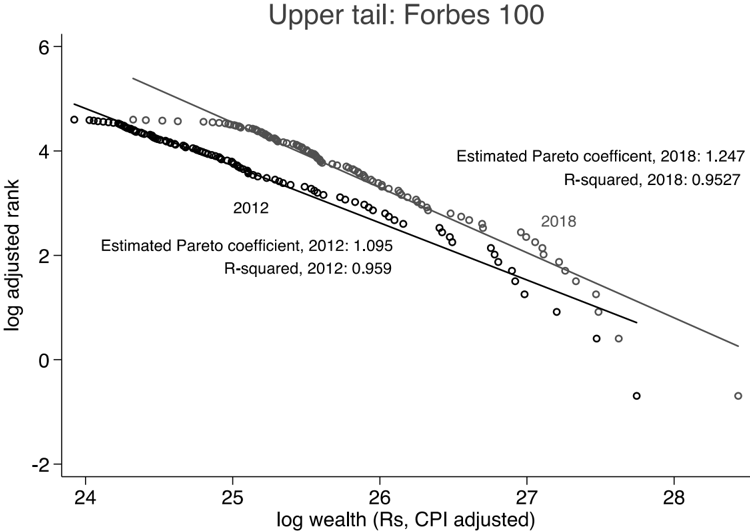
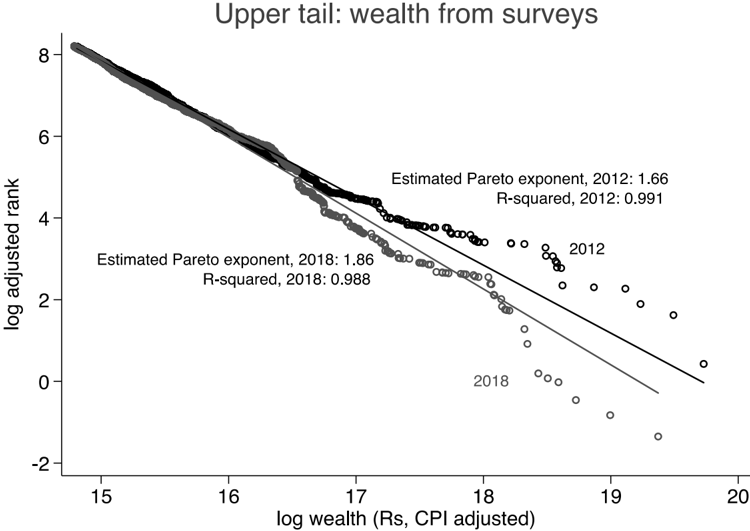
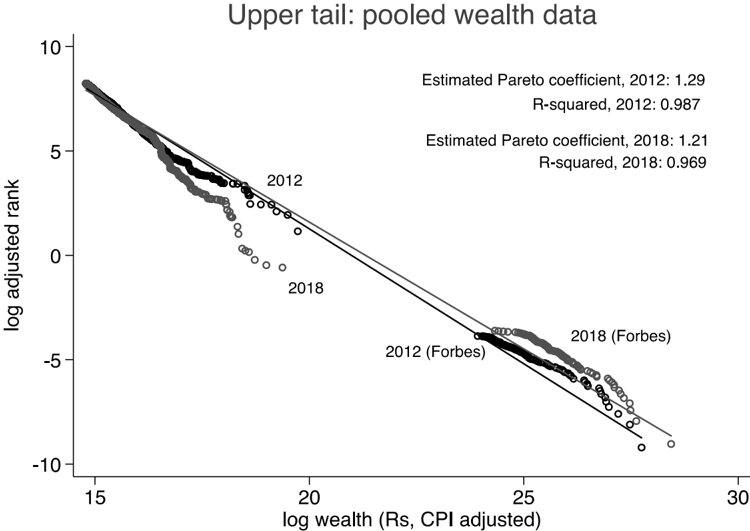
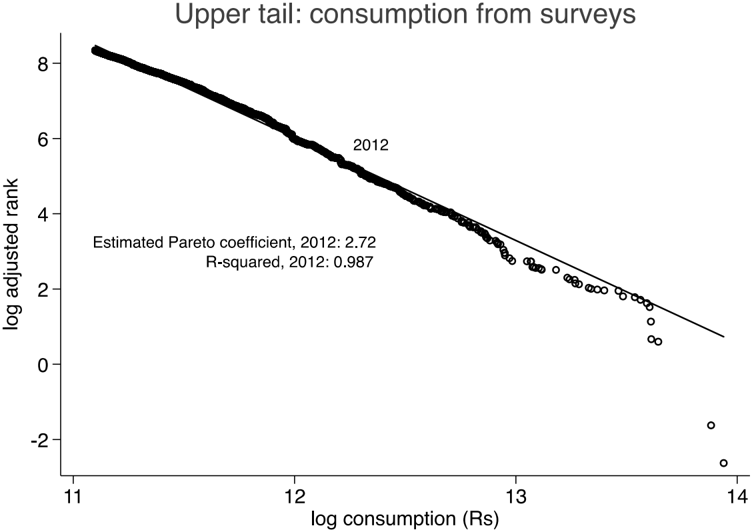
Verification
Claims the paper makes
The claims and statistics of this paper haven’t been checked yet.
Run the check — free, no account needed. It reads the open-access text and checks the sources it cites.
Claims other papers make about this one
Each is checked against this paper’s own text: does it say what the citing paper says it does?
In the citing paper
“This places creator earnings closer to concentrated capital income ( α ≈ 1 . 5) (Gabaix 2009; Rishabh Kumar 2024) than to labor income, suggesting multiplicative and compounding effects drive online creator earnings (Strauss et al. 2024).”
From "Rich-Get-Richer"? Platform Attention and Earnings Inequality using Patreon Earnings Data (2025) · cites this paper as Rishabh Kumar 2024
Self-check
Percentages, sums and reported differences re-computed from the paper’s own numbers.
The self-check needs the paper’s full text.
Citations
Cites
No references could be resolved yet.
Research works printed but not linked: 18
- 10.2307/1911412 · DOI
- 10.1016/j.physa.2014.03.052 · DOI
- 10.1016/j.jebo.2005.06.008 · DOI
- 10.1137/070710111 · DOI · Paper page
- 10.1016/S1574-0056(00)80014-7 · DOI
- 10.1016/S0378-4371(01)00298-9 · DOI · Paper page
- 10.1146/annurev.economics.050708.142940 · DOI · Paper page
- 10.1257/jep.30.1.185 · DOI
- 10.1198/jbes.2009.06157 · DOI
- 10.1016/j.physa.2007.08.049 · DOI
- 10.1016/j.econlet.2005.08.020 · DOI · Paper page
- 10.1016/j.physa.2012.10.026 · DOI
- 10.1080/09538259.2016.1205295 · DOI
- 10.1016/j.physa.2005.02.092 · DOI
- 10.2307/1912788 · DOI
- Tao Y. Wu X. Zhou T. Yan W. Huang Y. Yu H. Mondal B. & Yakovenko V. M. (2019). Exponential structure of income inequality: Evidence from 67 countries. Journal of Economic Interaction and Coordination 14 345–376. https://doi.org/10.1007/s11403-017-0211-6 · DOI
- 10.1111/roiw.12279 · DOI
- 10.1007/88-470-0389-X_2 · DOI
Cited by
Sorted by citations
"Rich-Get-Richer"? Platform Attention and Earnings Inequality using Patreon Earnings Data
Strauss, I., Yang, J., & Mazzucato, M. (2025) · arXiv
Metadata
- Authors
- Kumar, R.
- Affiliations
- Department of Economics, University of Massachusetts Boston, MA, United States
- ORCID
- Kumar, Rishabh
- Venue
- The Indian Economic Journal
- Publisher
- SAGE Publications
- Published
- 2024-03-22
- Volume
- 73
- Issue
- 5
- Pages
- 843-853
- ISSN
- 0019-4662
- 2631-617X
- Cited by
- 1
- References
- 0
- Language
- en
About these checks
Registry, retraction, Cites and statistics results are computed, not judged, with one exception: a printed reference that no index lists is read once by a model before it counts as a citation error. Claims are extracted by a model and kept only when their quote appears verbatim in the text; each cited source is then checked, with a model’s help, for whether it says what the claim relies on. Those verdicts can be wrong — read the claim’s quote and the cited source before relying on one.
Statistics and arithmetic are recomputed, not judged.
Confidence bands are shown only for fields calibrated on our annotated test set. None is calibrated yet, so no band is shown.
What counts as a claim ›How we measure confidence ›How we check this ›
Are you an author, or do you see a problem with this page? Request a review
