

The DOI matches its Crossref record; 26 of the 26 references it cites were found in a registry or an index.
Optimal experiment selection for parameter estimation in biological differential equation models
Open accessAbstract
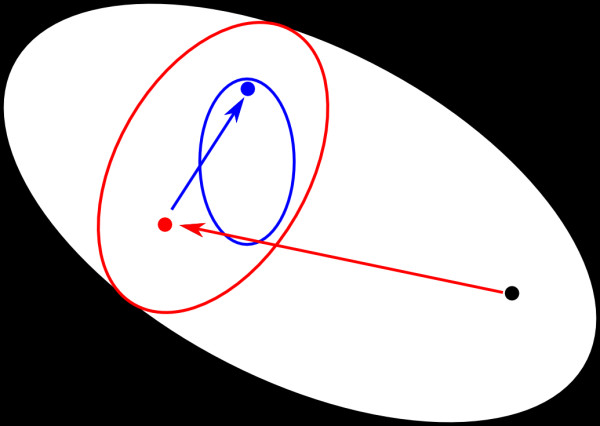
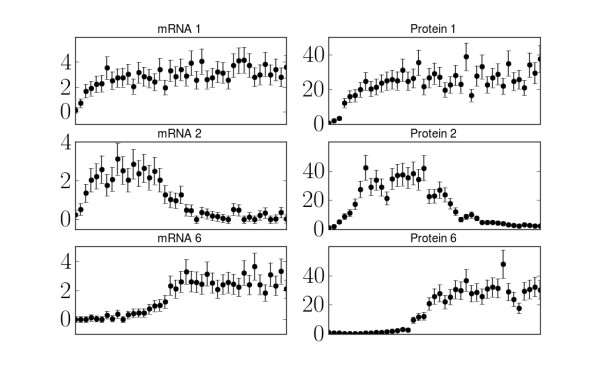
BACKGROUND: Parameter estimation in biological models is a common yet challenging problem. In this work we explore the problem for gene regulatory networks modeled by differential equations with unknown parameters, such as decay rates, reaction rates, Michaelis-Menten constants, and Hill coefficients. We explore the question to what extent parameters can be efficiently estimated by appropriate experimental selection. RESULTS: A minimization formulation is used to find the parameter values that best fit the experiment data. When the data is insufficient, the minimization problem often has many local minima that fit the data reasonably well. We show that selecting a new experiment based on the local Fisher Information of one local minimum generates additional data that allows one to successfully discriminate among the many local minima. The parameters can be estimated to high accuracy by iteratively performing minimization and experiment selection. We show that the experiment choices are roughly independent of which local minima is used to calculate the local Fisher Information. CONCLUSIONS: We show that by an appropriate choice of experiments, one can, in principle, efficiently and accurately estimate all the parameters of gene regulatory network. In addition, we demonstrate that appropriate experiment selection can also allow one to restrict model predictions without constraining the parameters using many fewer experiments. We suggest that predicting model behaviors and inferring parameters represent two different approaches to model calibration with different requirements on data and experimental cost.
Overview
The claims and statistics of this paper haven’t been checked yet.
Free: it reads the open-access text and checks the first 5 claims that cite a source we can check. Create a free account to check every claim.
Integrity signals
Registry
Cites
Statistics
Figures
Verification
Claims the paper makes
The claims and statistics of this paper haven’t been checked yet.
Free: it reads the open-access text and checks the first 5 claims that cite a source we can check. Create a free account to check every claim.
Claims other papers make about this one
Each is checked against this paper’s own text: does it say what the citing paper says it does?
The cited source says what the claim attributes to it.
In the citing paper
“Techniques for this exist in both a frequentist [13,36,91] as well as a Bayesian setting [87,90].”
From Parameter uncertainty in biochemical models described by ordinary differential equations (2013) · cites this paper as [91]
Self-check
Percentages, sums and reported differences re-computed from the paper’s own numbers.
The self-check needs the paper’s full text.
Citations
Cites
Universally Sloppy Parameter Sensitivities in Systems Biology Models
Gutenkunst, R. N., Waterfall, J. J., Casey, F. P., Brown, K. S., Myers, C. R., & Sethna, J. P. (2007) · PLoS Computational Biology · doi:10.1371/journal.pcbi.0030189 · Cited by 1,261
Numerical methods for computing angles between linear subspaces
Björck, Ȧ., & Golub, G. H. (1973) · Mathematics of Computation · doi:10.1090/s0025-5718-1973-0348991-3 · Cited by 865
Parameter estimation in biochemical pathways: a comparison of global optimization methods
Moles, C. G., Mendes, P., & Banga, J. R. (2003) · Genome Research · doi:10.1101/gr.1262503 · Cited by 858 · cited 2×
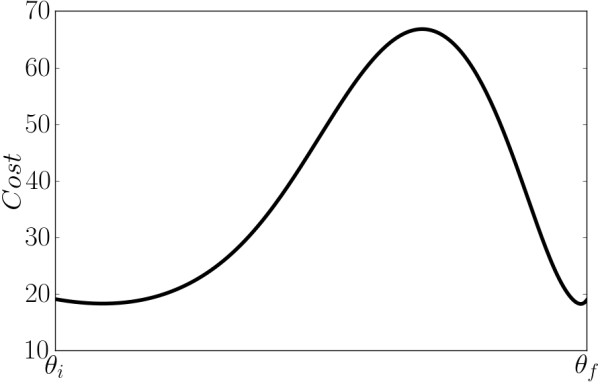
“Although our local search method produced many different parameter values suggestive of a rough cost surface [5,23-25], our subsequent analysis suggests that these local minima are separated by very small barriers.”
BackgroundMethodStructural identifiability of systems biology models: a critical comparison of methods
Chis, O.-T., Banga, J. R., & Balsa-Canto, E. (2011) · PLoS ONE · doi:10.1371/journal.pone.0027755 · Cited by 448 · cited 1×
“Models of this type often involve a large number of unknown parameters [1-8] which need to be inferred from experimental data, a process known as model calibration.”
BackgroundStatistical mechanical approaches to models with many poorly known parameters.
Brown, K. S., & Sethna, J. P. (2003) · Physical Review E · doi:10.1103/physreve.68.021904 · Cited by 398
Numerical Methods for Computing Angles Between Linear Subspaces
Björck, Å., & Golub, G. H. (1973) · Mathematics of Computation · doi:10.2307/2005662 · Cited by 390
Systems biology: parameter estimation for biochemical models
Ashyraliyev, M., Fomekong‐Nanfack, Y., Kaandorp, J. A., & Blom, J. G. (2009) · The FEBS Journal · doi:10.1111/j.1742-4658.2008.06844.x · Cited by 323
A hybrid approach for efficient and robust parameter estimation in biochemical pathways
Rodriguez-Fernandez, M., Mendes, P., & Banga, J. R. (2006) · Biosystems · doi:10.1016/j.biosystems.2005.06.016 · Cited by 304 · cited 2×
“Although our local search method produced many different parameter values suggestive of a rough cost surface [5,23-25], our subsequent analysis suggests that these local minima are separated by very small barriers.”
BackgroundMethodClassic and contemporary approaches to modeling biochemical reactions
Chen, W. W., Niepel, M., & Sorger, P. K. (2010) · Genes & Development · doi:10.1101/gad.1945410 · Cited by 286
The statistical mechanics of complex signaling networks: Nerve growth factor signaling.
Brown, K. S., Hill, C. C., Calero, G. A., Myers, C. R., Lee, K. H., Sethna, J. P., & Cerione, R. A. (2004) · Physical Biology · doi:10.1088/1478-3967/1/3/006 · Cited by 265
Research works printed but not linked: 1
- Brown KS: Signal Transduction, Sloppy Models, and Statistical Mechanics. PhD thesis. Cornell University 2003-
Cited by
Perspective: Sloppiness and emergent theories in physics, biology, and beyond
Transtrum, M. K., Machta, B. B., Brown, K. S., Daniels, B. C., Myers, C. R., & Sethna, J. P. (2015) · The Journal of Chemical Physics · doi:10.1063/1.4923066 · Cited by 311
Self-citationRaja, M. A. Z., Umar, M., Sabir, Z., Khan, J. A., & Bǎleanu, D. (2018) · The European Physical Journal Plus · doi:10.1140/epjp/i2018-12153-4 · Cited by 155
Parameter uncertainty in biochemical models described by ordinary differential equations
Vanlier, J., Tiemann, C. A., Hilbers, P. A. J., & van Riel, N. A. W. (2013) · Mathematical Biosciences · doi:10.1016/j.mbs.2013.03.006 · Cited by 116
“Techniques for this exist in both a frequentist [13,36,91] as well as a Bayesian setting [87,90].”
BackgroundThe Limitations of Model-Based Experimental Design and Parameter Estimation in Sloppy Systems
White, A., Tolman, M., Thames, H. D., Withers, H. R., Mason, K. A., & Transtrum, M. K. (2016) · PLoS Computational Biology · doi:10.1371/journal.pcbi.1005227 · Cited by 124
Self-citationBridging Mechanistic and Phenomenological Models of Complex Biological Systems
Transtrum, M. K., & Qiu, P. (2016) · PLoS Computational Biology · doi:10.1371/journal.pcbi.1004915 · Cited by 95
Self-citation
Metadata
- Authors
- Transtrum, M. K., & Qiu, P.
- Affiliations
- The University of Texas MD Anderson Cancer Center (US)
- Corresponding author
- Qiu, Peng
- Venue
- BMC Bioinformatics
- Published
- 2012-07-27
- Volume
- 13
- Issue
- 1
- Pages
- 181-181
- ISSN
- 1471-2105 (ISSN-L)
- PMC
- PMC3536579
- OpenAlex
- W2100560953
- Cited by
- 34
- References
- 26
- Citations by year
- 2026: 3 · 2025: 2 · 2023: 2 · 2022: 5 · 2021: 1 · 2019: 1 · 2018: 6 · 2017: 2 · 2016: 4 · 2015: 4 · 2014: 2 · 2013: 2
- FWCI
- 1.03
- Type
- journal article
- Language
- en
- Open access
- gold
- doi.org
- Licence
- cc-by
- creativecommons.org/licenses/by/2.0 (tdm)
- Locations
- BMC Bioinformatics (publishedVersion, cc-by)
- PubMed Central (publishedVersion, cc-by)
- PubMed (publishedVersion)
- DOAJ (DOAJ: Directory of Open Access Journals) (submittedVersion, cc-by-sa)
- Funders
- University of Texas MD Anderson Cancer Center ((CA016672), P30-CA-016672)
- National Cancer Institute (U24 CA143883 02 S1, U24CA143883, P30CA016672)
- Topics
- Life Sciences › Biochemistry, Genetics and Molecular Biology › Molecular Biology › Gene Regulatory Network Analysis
- Physical Sciences › Engineering › Control and Systems Engineering › Control Systems and Identification
- Social Sciences › Decision Sciences › Management Science and Operations Research › Optimal Experimental Design Methods
- Keywords
- parameter estimation, gene regulatory networks, differential equation model, local minima, model calibration, Michaelis-Menten constant, Hill coefficient, model discrimination, model reduction
- MeSH terms
- Algorithms, Mathematical Computing, Models, Genetic, Research Design, Gene Regulatory Networks
About these checks
Registry, retraction, Cites and statistics results are computed, not judged, with one exception: a printed reference that no index lists is read once by a model before it counts as a citation error. Claims are extracted by a model and kept only when their quote appears verbatim in the text; each cited source is then checked, with a model’s help, for whether it says what the claim relies on. Those verdicts can be wrong — read the claim’s quote and the cited source before relying on one.
Statistics and arithmetic are recomputed, not judged.
Confidence bands are shown only for fields calibrated on our annotated test set. None is calibrated yet, so no band is shown.
What counts as a claim ›How we measure confidence ›How we check this ›
Are you an author, or do you see a problem with this page? Request a review
How to cite
Cite CoChat for the checks on this page, and the paper for its own findings.
- This page
- CoChat. (2026). Citation check: Optimal experiment selection for parameter estimation in biological differential equation models. https://app.cochat.ai/papers/10.1186/1471-2105-13-181
- The paper
- Transtrum, M. K., & Qiu, P. (2012). Optimal experiment selection for parameter estimation in biological differential equation models. BMC Bioinformatics. https://doi.org/10.1186/1471-2105-13-181
Data sources
Bibliographic data: Semantic Scholar, OpenAlex, Crossref.
Contains information from the Semantic Scholar Academic Graph Datasets, made available under the ODC Attribution License (ODC-BY 1.0).
Semantic Scholar’s data is described in: Kinney, R., et al. (2023). The Semantic Scholar Open Data Platform. arXiv:2301.10140.
