Student or educator? Sign up with your school email and get 6 months of Pro free.
CoChat

The DOI matches its Crossref record; 68 of the 69 references it cites were found in a registry or an index.

GSVA: gene set variation analysis for microarray and RNA-Seq data

Open access
Hänzelmann, Sonja, Castelo, Robert, Guinney, Justin · 2013 · BMC Bioinformatics

Abstract

Background: Gene set enrichment (GSE) analysis is a popular framework for condensing information from gene expression profiles into a pathway or signature summary. The strengths of this approach over single gene analysis include noise and dimension reduction, as well as greater biological interpretability. As molecular profiling experiments move beyond simple case-control studies, robust and flexible GSE methodologies are needed that can model pathway activity within highly heterogeneous data sets. Results: To address this challenge, we introduce Gene Set Variation Analysis (GSVA), a GSE method that estimates variation of pathway activity over a sample population in an unsupervised manner. We demonstrate the robustness of GSVA in a comparison with current state of the art sample-wise enrichment methods. Further, we provide examples of its utility in differential pathway activity and survival analysis. Lastly, we show how GSVA works analogously with data from both microarray and RNA-seq experiments. Conclusions: GSVA provides increased power to detect subtle pathway activity changes over a sample population in comparison to corresponding methods. While GSE methods are generally regarded as end points of a bioinformatic analysis, GSVA constitutes a starting point to build pathway-centric models of biology. Moreover, GSVA contributes to the current need of GSE methods for RNA-seq data. GSVA is an open source software package for R which forms part of the Bioconductor project and can be downloaded at http://www.bioconductor.org .

Overview

The claims and statistics of this paper haven’t been checked yet.

Free: it reads the open-access text and checks the first 5 claims that cite a source we can check. Create a free account to check every claim.

A few free checks a day · papers already verified open instantly · results are public

Integrity signals

Registry

Crossref · 10.1186/1471-2105-14-7

Cites

68 of 68 references verified0 citation errors · 0 not checkable

Statistics

Figures

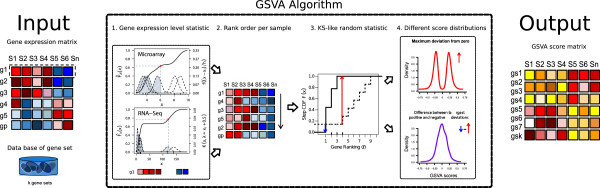
Figure 1 GSVA methods outline. The input for the GSVA algorithm are a gene expression matrix in the form of log2 microarray expression values or RNA-seq counts and a database of gene sets. 1. Kernel estimation of the cumulative density function (kcdf). The two plots show two simulated expression profiles mimicking 6 samples from microarray and RNA-seq data. The x-axis corresponds to expression values where each gene is lowly expressed in the four samples with lower values and highly expressed in the other two. The scale of the kcdf is on the left y-axis and the scale of the Gaussian and Poisson kernels is on the right y-axis. 2. The expression-level statistic is rank ordered for each sample. 3. For every gene set, the Kolmogorov-Smirnov-like rank statistic is calculated. The plot illustrates a gene set consisting of 3 genes out of a total number of 10 with the sample-wise calculation of genes inside and outside of the gene set. 4. The GSVA enrichment score is either the maximum deviation from zero (top) or the difference between the two sums (bottom). The two plots show two simulations of the resulting scores under the null hypothesis of no gene expression change (see main text). The output of the algorithm is a matrix containing pathway enrichment scores for each gene set and sample.
Figure 1 GSVA methods outline. The input for the GSVA algorithm are a gene expression matrix in the form of log2 microarray expression values or RNA-seq counts and a database of gene sets. 1. Kernel estimation of the cumulative density function (kcdf). The two plots show two simulated expression profiles mimicking 6 samples from microarray and RNA-seq data. The x-axis corresponds to expression values where each gene is lowly expressed in the four samples with lower values and highly expressed in the other two. The scale of the kcdf is on the left y-axis and the scale of the Gaussian and Poisson kernels is on the right y-axis. 2. The expression-level statistic is rank ordered for each sample. 3. For every gene set, the Kolmogorov-Smirnov-like rank statistic is calculated. The plot illustrates a gene set consisting of 3 genes out of a total number of 10 with the sample-wise calculation of genes inside and outside of the gene set. 4. The GSVA enrichment score is either the maximum deviation from zero (top) or the difference between the two sums (bottom). The two plots show two simulations of the resulting scores under the null hypothesis of no gene expression change (see main text). The output of the algorithm is a matrix containing pathway enrichment scores for each gene set and sample.CC BY · PubMed Central
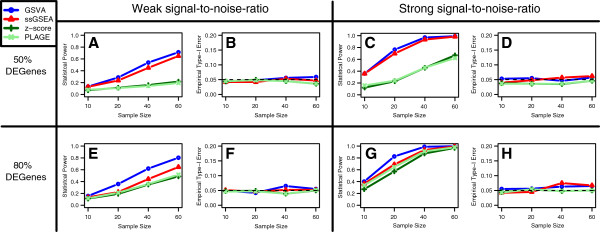
Figure 2 Comparison of statistical power and type-I error rate between GSVA, PLAGE, single sample GSEA (ssGSEA) and combined z-score (zscore). The averaged results of 1,000 simulations are depicted as function of the sample size on the x-axis, for each of the GSE methods. On the y-axis either the statistical power (A, C, E, G) or the empirical type-I error rate (B, D, F, H) is shown. Data were simulated from a linear additive model with sample and probe effects (see Methods) for p=1,000 genes. GSE scores were calculated with each method with respect to two gene sets, one of them differentially expressed (DE) and the other one not. Statistical power and empirical type-I error rates were estimated by performing a t-test on the DE and non-DE gene sets, respectively, at a significance level of α=0.05. These simulations were carried out under the following four different scenarios for the DE gene set: (A,B) weak signal-to-noise ratio, 50% of DE genes in the DE gene set; (C,D) strong signal-to-noise ratio, 50% of DE genes in the DE gene set; (E, F) weak signal-to-noise ratio, 80% of DE genes in the DE gene set; (G, H) strong signal-to-noise ratio, 80% of DE genes in the DE gene set.
Figure 2 Comparison of statistical power and type-I error rate between GSVA, PLAGE, single sample GSEA (ssGSEA) and combined z-score (zscore). The averaged results of 1,000 simulations are depicted as function of the sample size on the x-axis, for each of the GSE methods. On the y-axis either the statistical power (A, C, E, G) or the empirical type-I error rate (B, D, F, H) is shown. Data were simulated from a linear additive model with sample and probe effects (see Methods) for p=1,000 genes. GSE scores were calculated with each method with respect to two gene sets, one of them differentially expressed (DE) and the other one not. Statistical power and empirical type-I error rates were estimated by performing a t-test on the DE and non-DE gene sets, respectively, at a significance level of α=0.05. These simulations were carried out under the following four different scenarios for the DE gene set: (A,B) weak signal-to-noise ratio, 50% of DE genes in the DE gene set; (C,D) strong signal-to-noise ratio, 50% of DE genes in the DE gene set; (E, F) weak signal-to-noise ratio, 80% of DE genes in the DE gene set; (G, H) strong signal-to-noise ratio, 80% of DE genes in the DE gene set.CC BY · PubMed Central
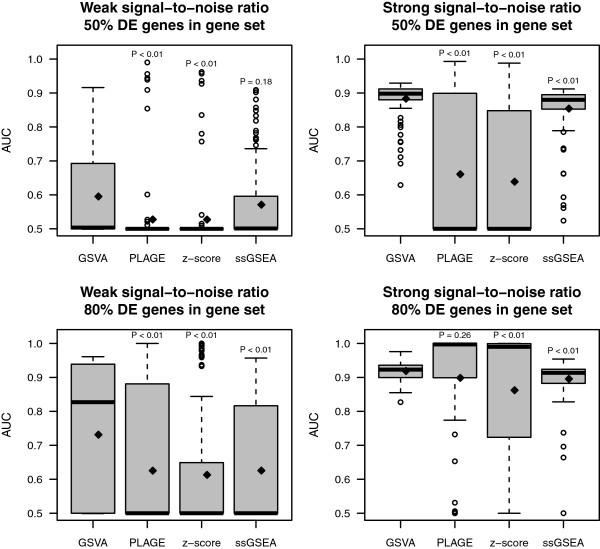
Figure 3 Comparison of differential pathway activity identification of GSVA, PLAGE, single sample GSEA (ssGSEA) and combined z-score (zscore). Each panel shows the area under the ROC curve (AUC) on the y-axis for differentially expressed genes predicted by each method at 5% FDR over 100 simulations (see Methods). On top of each boxplot the p-value of the t-test for no difference in means between GSVA and the corresponding method is reported. The two panels on top correspond to simulations where 50% of the genes in DE gene sets were DE while the two at the bottom contained 80% of DE genes on those DE gene sets. The two panels on the left correspond to a weak signal-to-noise ratio in the DE magnitude while the two on the right correspond to a strong one. Diamonds indicate mean values in boxplots.
Figure 3 Comparison of differential pathway activity identification of GSVA, PLAGE, single sample GSEA (ssGSEA) and combined z-score (zscore). Each panel shows the area under the ROC curve (AUC) on the y-axis for differentially expressed genes predicted by each method at 5% FDR over 100 simulations (see Methods). On top of each boxplot the p-value of the t-test for no difference in means between GSVA and the corresponding method is reported. The two panels on top correspond to simulations where 50% of the genes in DE gene sets were DE while the two at the bottom contained 80% of DE genes on those DE gene sets. The two panels on the left correspond to a weak signal-to-noise ratio in the DE magnitude while the two on the right correspond to a strong one. Diamonds indicate mean values in boxplots.CC BY · PubMed Central
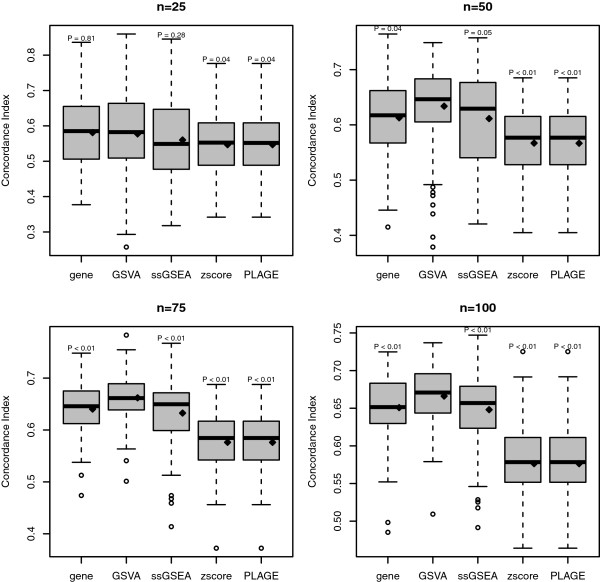
Figure 4 Comparison of the predictive power for survival analysis of gene-level, GSVA, PLAGE, single sample GSEA (ssGSEA) and combined z-score (zscore) on simulated data. Each panel corresponds to a different sample size of the simulated data. The y-axis shows the concordance index values of predicting survival risk on test data from 100 independent simulations. On top of each boxplot the p-value of the t-test for no difference in means between GSVA and the corresponding method is reported. The method gene refers to a simple gene-level survival model built from the top 10 genes with lowest p-values reported by the Wald test performed on the training data. Diamonds indicate mean values in boxplots.
Figure 4 Comparison of the predictive power for survival analysis of gene-level, GSVA, PLAGE, single sample GSEA (ssGSEA) and combined z-score (zscore) on simulated data. Each panel corresponds to a different sample size of the simulated data. The y-axis shows the concordance index values of predicting survival risk on test data from 100 independent simulations. On top of each boxplot the p-value of the t-test for no difference in means between GSVA and the corresponding method is reported. The method gene refers to a simple gene-level survival model built from the top 10 genes with lowest p-values reported by the Wald test performed on the training data. Diamonds indicate mean values in boxplots.CC BY · PubMed Central
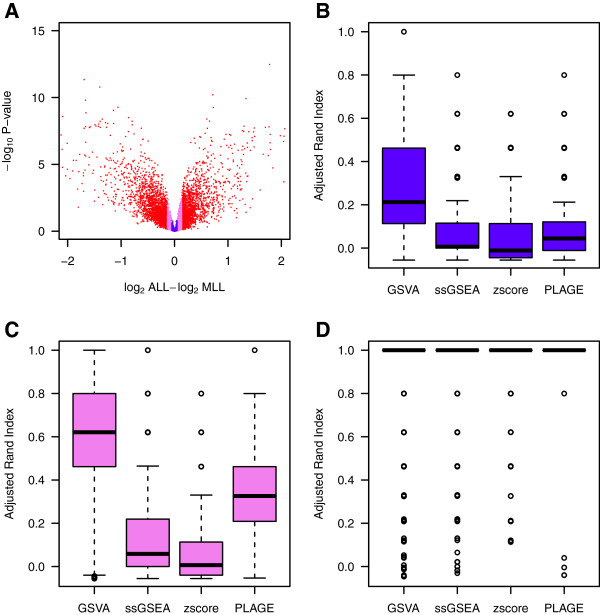
Figure 5 Comparison of differential pathway activity identification of GSVA, PLAGE, single sample GSEA (ssGSEA) and combined z-score (zscore) on a leukemia data set. (A) Volcano plot of gene expression changes in the Leukemia data set. Genes highlighted in red form the first tercile of largest absolute fold changes, violet indicates the second tercile and blue the third tercile. (B-D) Adjusted rand index (ARI) indicating the accuracy of classifying the two groups of samples by hierarchical clustering of the enrichment scores produced by each of the compared methods at the top-5 differentially activated gene sets. The distribution of ARI values is formed by bootstrapping 1,000 times 10 samples from each sample group. Colors match the key given for genes in the volcano plot of (A) and show that, as expected, genes with larger fold changes lead to larger ARI values. However, when fold changes are small (B-C) and the underlying signature becomes extremely subtle, GSVA produces enrichment scores that lead to differentially activated gene sets which classify the two sample groups substantially better than using ssGSEA, zscore or PLAGE.
Figure 5 Comparison of differential pathway activity identification of GSVA, PLAGE, single sample GSEA (ssGSEA) and combined z-score (zscore) on a leukemia data set. (A) Volcano plot of gene expression changes in the Leukemia data set. Genes highlighted in red form the first tercile of largest absolute fold changes, violet indicates the second tercile and blue the third tercile. (B-D) Adjusted rand index (ARI) indicating the accuracy of classifying the two groups of samples by hierarchical clustering of the enrichment scores produced by each of the compared methods at the top-5 differentially activated gene sets. The distribution of ARI values is formed by bootstrapping 1,000 times 10 samples from each sample group. Colors match the key given for genes in the volcano plot of (A) and show that, as expected, genes with larger fold changes lead to larger ARI values. However, when fold changes are small (B-C) and the underlying signature becomes extremely subtle, GSVA produces enrichment scores that lead to differentially activated gene sets which classify the two sample groups substantially better than using ssGSEA, zscore or PLAGE.CC BY · PubMed Central
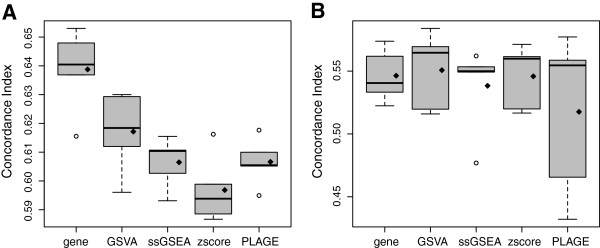
Figure 6 Survival analysis in a TCGA ovarian cancer data set. Predictive performance in the survival analysis of a TCGA ovarian cancer microarray data set of n=588 samples, measured by the concordance index obtained from a 5-fold cross-validation from (A) the training data and (B) the test data. Diamonds indicate means in boxplots. Except in the training data using the gene-level model, GSVA provides higher mean and median concordance index values than the other compared methods in both training and testing cross-validated data sets.
Figure 6 Survival analysis in a TCGA ovarian cancer data set. Predictive performance in the survival analysis of a TCGA ovarian cancer microarray data set of n=588 samples, measured by the concordance index obtained from a 5-fold cross-validation from (A) the training data and (B) the test data. Diamonds indicate means in boxplots. Except in the training data using the gene-level model, GSVA provides higher mean and median concordance index values than the other compared methods in both training and testing cross-validated data sets.CC BY · PubMed Central
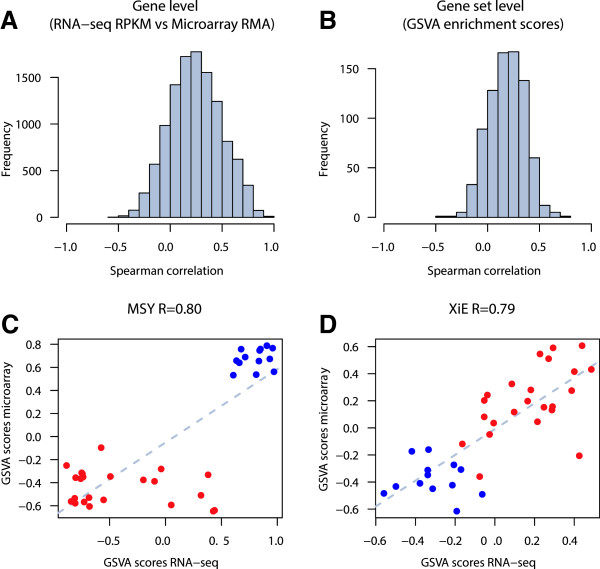
Figure 7 GSVA for RNA-seq (Argonne). A. Distribution of Spearman correlation values between gene expression profiles of RNA-seq and microarray data. B. Distribution of Spearman correlation values between GSVA enrichment scores of gene sets calculated from RNA-seq and microarray data. C and D. Comparison of GSVA enrichment scores obtained from microarray and RNA-seq data for two gene sets containing genes with sex-specific expression: MSY formed by genes of the male-specific region of the Y chromosome (male-specific), and XiE formed by genes that escape X-inactivation in females (female-specific). Red and blue points represent female and male samples, respectively. In both cases GSVA scores show very high correlation between the two profiling technologies where female samples show higher enrichment scores in the female-specific gene set and male samples show higher enrichment scores in the male-specific gene set.
Figure 7 GSVA for RNA-seq (Argonne). A. Distribution of Spearman correlation values between gene expression profiles of RNA-seq and microarray data. B. Distribution of Spearman correlation values between GSVA enrichment scores of gene sets calculated from RNA-seq and microarray data. C and D. Comparison of GSVA enrichment scores obtained from microarray and RNA-seq data for two gene sets containing genes with sex-specific expression: MSY formed by genes of the male-specific region of the Y chromosome (male-specific), and XiE formed by genes that escape X-inactivation in females (female-specific). Red and blue points represent female and male samples, respectively. In both cases GSVA scores show very high correlation between the two profiling technologies where female samples show higher enrichment scores in the female-specific gene set and male samples show higher enrichment scores in the male-specific gene set.CC BY · PubMed Central

Verification

Claims the paper makes

The claims and statistics of this paper haven’t been checked yet.

Free: it reads the open-access text and checks the first 5 claims that cite a source we can check. Create a free account to check every claim.

A few free checks a day · papers already verified open instantly · results are public

Self-check

Percentages, sums and reported differences re-computed from the paper’s own numbers.

The self-check needs the paper’s full text.

Citations

Cites

Show all 69 references

Research works printed but not linked: 3

  1. Tamayo P, Steinhardt G, Liberzon A, Mesirov JP: Gene set enrichment analysis made right. arXiv:1110.4128. 2011, [http://arxiv.org/abs/1110.4128] · arXiv
  2. Wu D, Lim E, Vaillant F, Asselin-Labat ML, Visvader JE, Smyth GK: ROAST: rotation gene set tests for complex microarray experiments. Bioinformatics (Oxford, England). 2010, 26 (17): 2176-2182. [http://www.ncbi.nlm.nih.gov/pubmed/20610611]. [PMID: 20610611] · DOI · Paper page
  3. Bolstad BM: Low-level analysis of high-density oligonucleotide array data: background, normalization and summarization. PhD thesis,. University of Waikato 2004. [http://bmbolstad.com/Dissertation/Bolstad_2004_Dissertation.pdf]

Cited by

See all 15,440

Metadata

Authors
Hänzelmann, S., Castelo, R., & Guinney, J.
Affiliations
  • Hospital Del Mar (ES)
  • Universitat Pompeu Fabra (ES)
  • Sage Bionetworks (US)
Corresponding author
  • Castelo, Robert
  • Guinney, Justin
Venue
BMC Bioinformatics
Published
2013-01-16
Volume
14
Issue
1
Pages
7-7
ISSN
1471-2105 (ISSN-L)
OpenAlex
W2159707944
Cited by
15,440
References
69
Citations by year
2026: 1912 · 2025: 2459 · 2024: 2961 · 2023: 2686 · 2022: 2580 · 2021: 1518 · 2020: 676 · 2019: 295 · 2018: 142 · 2017: 99 · 2016: 44 · 2015: 30 · 2014: 17 · 2013: 15
FWCI
15.84
Type
journal article
Language
en
Open access
Licence
cc-by
Locations
  • BMC Bioinformatics (publishedVersion, cc-by)
  • Europe PMC (PubMed Central) (publishedVersion, cc-by)
  • PubMed Central (publishedVersion, cc-by)
  • PubMed (publishedVersion)
  • Repositori digital de la UPF (Universitat Pompeu Fabra) (publishedVersion, cc-by)
  • RECERCAT (Consorci de Serveis Universitaris de Catalunya) (submittedVersion, cc-by)
Funders
  • Instituto de Salud Carlos III
  • National Cancer Institute (U54CA149237)
Topics
  • Life Sciences › Biochemistry, Genetics and Molecular Biology › Molecular Biology › Bioinformatics and Genomic Networks
  • Life Sciences › Biochemistry, Genetics and Molecular Biology › Molecular Biology › Gene expression and cancer classification
  • Life Sciences › Biochemistry, Genetics and Molecular Biology › Molecular Biology › Genomics and Phylogenetic Studies
Keywords
gene set variation analysis, gene set enrichment analysis, survival analysis, microarray data, RNA-seq data
MeSH terms
Analysis of Variance, Female, Humans, Ovarian Neoplasms, Software, Genetic Variation, Leukemia, Biphenotypic, Acute, Survival Analysis, Sequence Analysis, RNA, Statistics, Nonparametric, Oligonucleotide Array Sequence Analysis, Gene Expression Profiling, Precursor Cell Lymphoblastic Leukemia-Lymphoma

About these checks

Registry, retraction, Cites and statistics results are computed, not judged, with one exception: a printed reference that no index lists is read once by a model before it counts as a citation error. Claims are extracted by a model and kept only when their quote appears verbatim in the text; each cited source is then checked, with a model’s help, for whether it says what the claim relies on. Those verdicts can be wrong — read the claim’s quote and the cited source before relying on one.

Statistics and arithmetic are recomputed, not judged.

Confidence bands are shown only for fields calibrated on our annotated test set. None is calibrated yet, so no band is shown.

What counts as a claim ›How we measure confidence ›How we check this ›

Are you an author, or do you see a problem with this page? Request a review

How to cite

Cite CoChat for the checks on this page, and the paper for its own findings.

This page
CoChat. (2026). Citation check: GSVA: gene set variation analysis for microarray and RNA-Seq data. https://app.cochat.ai/papers/10.1186/1471-2105-14-7
The paper
Hänzelmann, S., Castelo, R., & Guinney, J. (2013). GSVA: gene set variation analysis for microarray and RNA-Seq data. BMC Bioinformatics. https://doi.org/10.1186/1471-2105-14-7

Data sources

Bibliographic data: Semantic Scholar, OpenAlex, Crossref.

Contains information from the Semantic Scholar Academic Graph Datasets, made available under the ODC Attribution License (ODC-BY 1.0).

Semantic Scholar’s data is described in: Kinney, R., et al. (2023). The Semantic Scholar Open Data Platform. arXiv:2301.10140.