

The DOI matches its Crossref record; 34 of the 35 references it cites were found in a registry or an index, and 1 are not checked yet.
Effects of dependence in high-dimensional multiple testing problems
Open accessAbstract
BACKGROUND: We consider effects of dependence among variables of high-dimensional data in multiple hypothesis testing problems, in particular the False Discovery Rate (FDR) control procedures. Recent simulation studies consider only simple correlation structures among variables, which is hardly inspired by real data features. Our aim is to systematically study effects of several network features like sparsity and correlation strength by imposing dependence structures among variables using random correlation matrices. RESULTS: We study the robustness against dependence of several FDR procedures that are popular in microarray studies, such as Benjamin-Hochberg FDR, Storey's q-value, SAM and resampling based FDR procedures. False Non-discovery Rates and estimates of the number of null hypotheses are computed from those methods and compared. Our simulation study shows that methods such as SAM and the q-value do not adequately control the FDR to the level claimed under dependence conditions. On the other hand, the adaptive Benjamini-Hochberg procedure seems to be most robust while remaining conservative. Finally, the estimates of the number of true null hypotheses under various dependence conditions are variable. CONCLUSION: We discuss a new method for efficient guided simulation of dependent data, which satisfy imposed network constraints as conditional independence structures. Our simulation set-up allows for a structural study of the effect of dependencies on multiple testing criterions and is useful for testing a potentially new method on pi0 or FDR estimation in a dependency context.
Overview
The claims and statistics of this paper haven’t been checked yet.
Run the check — free, no account needed. It reads the open-access text and checks the sources it cites.
Integrity signals
Registry
Cites
Statistics
Figures
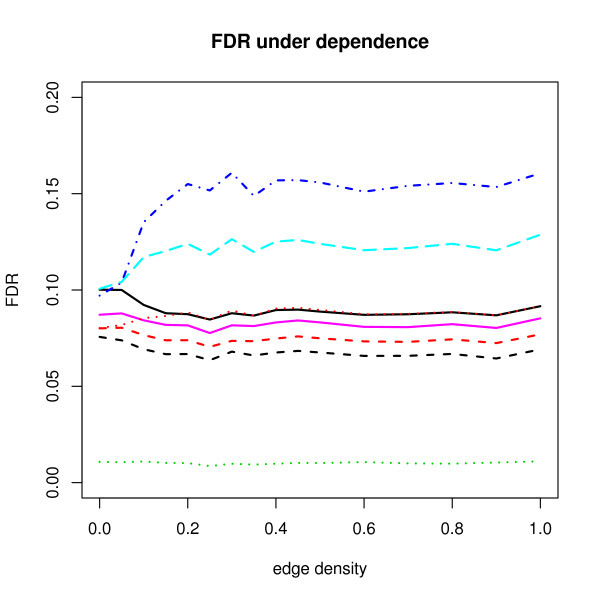
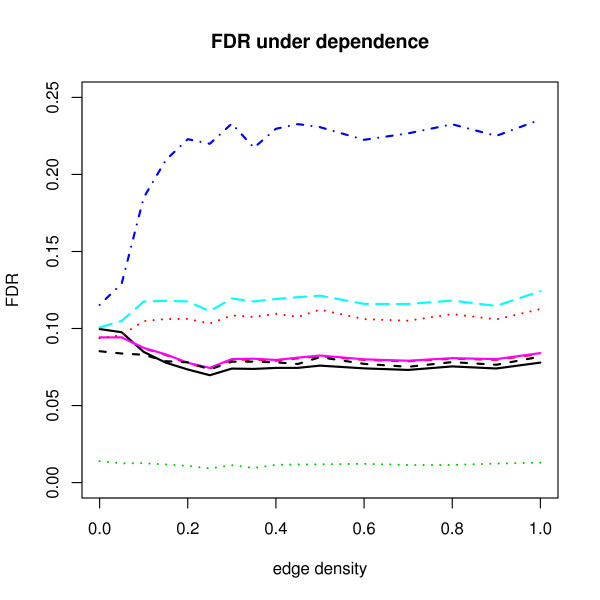
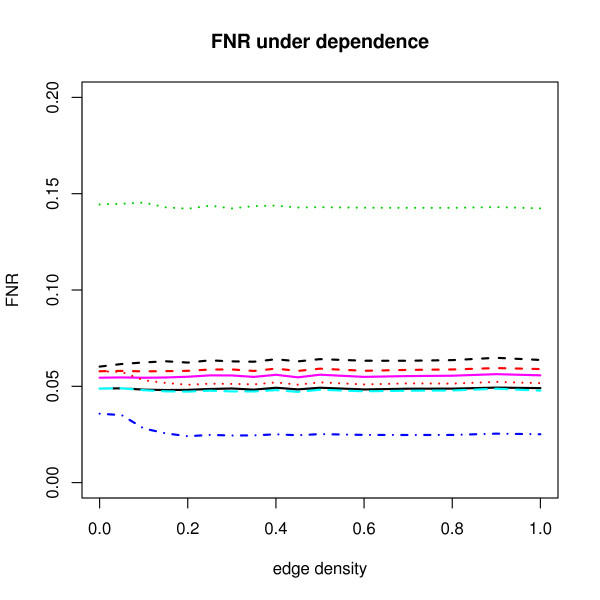
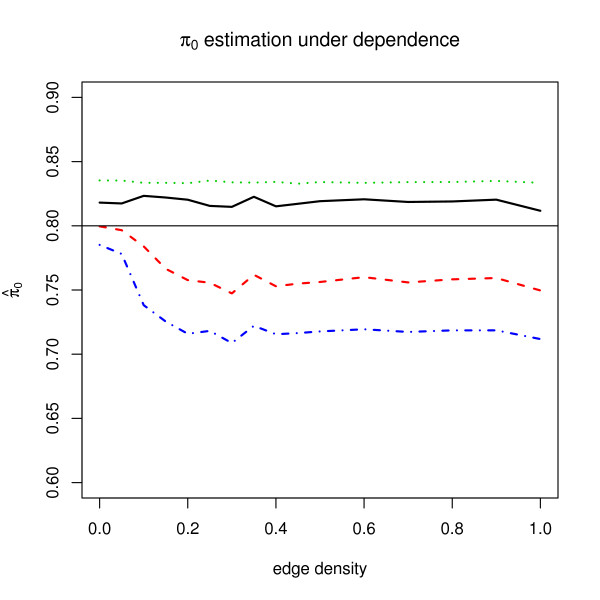
Verification
Claims the paper makes
The claims and statistics of this paper haven’t been checked yet.
Run the check — free, no account needed. It reads the open-access text and checks the sources it cites.
Claims other papers make about this one
Each is checked against this paper’s own text: does it say what the citing paper says it does?
The source backs part of the claim, not all of it — or backs it for a different population, condition or comparison.
In the citing paper
“FDR correction was chosen as it has been shown to be appropriate and robust for biological data that inherently show dependencies, such as those in the present study [60, 61, 62].”
From Interpersonal Synchronization of Autonomic Physiology via Mere Visual Contact (2026) · cites this paper as [60]
Experimental — accuracy not yet measured
Self-check
Percentages, sums and reported differences re-computed from the paper’s own numbers.
The self-check needs the paper’s full text.
Citations
Cites
Controlling the False Discovery Rate: A Practical and Powerful Approach to Multiple Testing
Benjamini, Y., & Hochberg, Y. (1995) · Journal of the Royal Statistical Society Series B: Statistical Methodology · doi:10.1111/j.2517-6161.1995.tb02031.x · Cited by 109,482 · cited 3×
“[2] first suggest an implementation of FDR by a linear step up approach.”
InfluentialSubramanian, A., Tamayo, P., Mootha, V. K., Mukherjee, S., Ebert, B. L., Gillette, M. A., Paulovich, A., Pomeroy, S. L., Golub, T. R., Lander, E. S., et al. (2005) · Proceedings of the National Academy of Sciences · doi:10.1073/pnas.0506580102 · Cited by 53,625 · cited 3×
“As a data-guided simulation using known gene sets [21,25], we introduce an algorithm for using real data in the Results section.”
Gentleman R: R: A language for data analysis and graphics
Ihaka, R., & Gentleman, R. (1996) · Journal of Computational and Graphical Statistics · doi:10.1080/10618600.1996.10474713 · Cited by 11,747 · cited 2×
“Simulation program We developed R code [32] for this simulation studies.”
In silico prediction of protein-protein interactions in human macrophages
Souiai, O., Guerfali, F. Z., Miled, S. B., Brun, C., & Benkahla, A. (2014) · BMC Research Notes · doi:10.1186/1756-0500-7-157 · Cited by 10,785
Significance analysis of microarrays applied to the ionizing radiation response
Tusher, V. G., Tibshirani, R., & Chu, G. (2001) · Proceedings of the National Academy of Sciences · doi:10.1073/pnas.091062498 · Cited by 10,568
The control of the false discovery rate in multiple testing under dependency
Benjamini, Y., & Yekutieli, D. (2001) · The Annals of Statistics · doi:10.1214/aos/1013699998 · Cited by 10,490 · cited 6×
“The reason behind these phenomena is hard to explain because the implementation of FDR-AME is modified from the algorithms of Yekutieli et al. [12].”
InfluentialStatistical significance for genomewide studies
Storey, J. D., & Tibshirani, R. (2003) · Proceedings of the National Academy of Sciences · doi:10.1073/pnas.1530509100 · Cited by 9,692 · cited 1×
“[19], respectively.”
A Direct Approach to False Discovery Rates
Storey, J. D. (2002) · Journal of the Royal Statistical Society Series B: Statistical Methodology · doi:10.1111/1467-9868.00346 · Cited by 5,603 · cited 6×
“Storey [4] introduces the positive false discovery rate (pFDR) and the q -value. pFDR is known to control error rate under the clumpy dependency condition [5].”
InfluentialR: A Language for Data Analysis and Graphics
Ihaka, R., & Gentleman, R. C. (1996) · Journal of Computational and Graphical Statistics · doi:10.2307/1390807 · Cited by 4,245
Adaptive linear step-up procedures that control the false discovery rate
Benjamini, Y., Krieger, A. M., & Yekutieli, D. (2006) · Biometrika · doi:10.1093/biomet/93.3.491 · Cited by 3,228 · cited 3×
“We found that in all our simulations, the simple adaptive Benjamini-Hochberg procedure [8] is most optimal under dependence, since it achieves relatively high power while remaining conservative.”
InfluentialLauritzen, S. L. (1996) · doi:10.1093/oso/9780198522195.001.0001 · Cited by 2,976
The positive false discovery rate: a Bayesian interpretation and the q-value
Storey, J. D. (2003) · The Annals of Statistics · doi:10.1214/aos/1074290335 · Cited by 2,204 · cited 1×
“Storey [4] introduces the positive false discovery rate (pFDR) and the q-value.”
Graphical Models in Applied Multivariate Statistics
Goodall, C. R., & Whittaker, J. (1991) · Technometrics · doi:10.2307/1269424 · Cited by 1,842
Identifying differentially expressed genes using false discovery rate controlling procedures
Reiner, A., Yekutieli, D., & Benjamini, Y. (2003) · Bioinformatics · doi:10.1093/bioinformatics/btf877 · Cited by 1,765
Resampling-Based Multiple Testing: Examples and Methods for p-Value Adjustment.
Martin, M. A., Westfall, P. H., & Young, S. S. (1994) · Biometrics · doi:10.2307/2533464 · Cited by 1,713 · cited 1×
“Resampling based approaches are immediate in utilizing sample correlation structure [11].”
Multiple Hypothesis Testing in Microarray Experiments
Dudoit, S., Shaffer, J. P., & Boldrick, J. C. (2003) · Statistical Science · doi:10.1214/ss/1056397487 · Cited by 1,054 · cited 2×
“SAM FDR is known to estimate the expected number of false discoveries over the observed number of total rejections under the complete null hypothesis [7].”
Resampling-Based Multiple Testing: Examples and Methods for p-Value Adjustment
Chaubey, Y. P., Westfall, P. H., & Young, S. S. (1993) · Technometrics · doi:10.2307/1270279 · Cited by 971
An empirical Bayes approach to inferring large-scale gene association networks
Schäfer, J., & Strimmer, K. (2004) · Bioinformatics · doi:10.1093/bioinformatics/bti062 · Cited by 801 · cited 1×
“Nowadays, explaining high-dimensional data with conditional independence structures is quite active especially in microarray data analysis [1, 22-24 ].”
On testing the significance of sets of genes
Efron, B., & Tibshirani, R. J. (2007) · The Annals of Applied Statistics · doi:10.1214/07-aoas101 · Cited by 785 · cited 1×
“As a data-guided simulation using known gene sets [21,25], we introduce an algorithm for using real data in the Results section.”
Yekutieli, D., & Benjamini, Y. (1999) · Journal of Statistical Planning and Inference · doi:10.1016/s0378-3758(99)00041-5 · Cited by 738
Wright, G. W. J., & Simon, R. M. (2003) · Bioinformatics · doi:10.1093/bioinformatics/btg345 · Cited by 662 · cited 1×
“As an alternative to the fudge factor, the random variance model (RVM) by [26] can be used and simple replacement of the pooled variance of t-statistic by the RVM variance results in close control of the FDR to the nominal level under dependence in moderate to large sample size conditions.”
Operating Characteristics and Extensions of the False Discovery Rate Procedure
Genovese, C. R., & Wasserman, L. (2002) · Journal of the Royal Statistical Society Series B (Statistical Methodology) · doi:10.1111/1467-9868.00347 · Cited by 545 · cited 1×
“The FNR is introduced by Genovese et al. [17].”
Sparse graphical models for exploring gene expression data
Dobra, A., Hans, C., Jones, B., et al. (2004) · Journal of Multivariate Analysis · doi:10.1016/j.jmva.2004.02.009 · Cited by 462 · cited 1×
“Nowadays, explaining high-dimensional data with conditional independence structures is quite active especially in microarray data analysis [1,22-24].”
Correlation and Large-Scale Simultaneous Significance Testing
Efron, B. (2007) · Journal of the American Statistical Association · doi:10.1198/016214506000001211 · Cited by 405 · cited 3×
“The variance of pairwise correlations was previously described as an important parameter in FDR estimation [20].”
InfluentialSparse graphical Gaussian modeling of the isoprenoid gene network in Arabidopsis thaliana
Wille, A., Zimmermann, P., Vranová, E., Fürholz, A., Laule, O., Bleuler, S., Hennig, L., Prelić, A., von Rohr, P., Thiele, L., et al. (2004) · Genome biology · doi:10.1186/gb-2004-5-11-r92 · Cited by 382
Estimating the Proportion of True Null Hypotheses, with application to DNA Microarray Data
Langaas, M., Lindqvist, B. H., & Ferkingstad, E. (2005) · Journal of the Royal Statistical Society Series B (Statistical Methodology) · doi:10.1111/j.1467-9868.2005.00515.x · Cited by 310 · cited 4×
“Careful simulation studies on the comparison of performance of π 0 estimation methods are done by Black [9] and Langaas et al. [10].”
InfluentialWagner, G. P. (1984) · Journal of Mathematical Biology · doi:10.1007/bf00275224 · Cited by 269 · cited 1×
“A family of covariance matrices as a Gaussian ensemble can also be considered as described in [28].”
Controlling the number of false discoveries: application to high-dimensional genomic data
Korn, E. L., Troendle, J. F., McShane, L. M., & Simon, R. M. (2003) · Journal of Statistical Planning and Inference · doi:10.1016/s0378-3758(03)00211-8 · Cited by 248 · cited 2×
“Typically in microarray data analysis, equicorrelated normal structures such as single pairwise correlation matrices or block diagonal matrices with a single pairwise correlation in each block are considered [14,15].”
Variance of the Number of False Discoveries
Owen, A. B. (2005) · Journal of the Royal Statistical Society Series B (Statistical Methodology) · doi:10.1111/j.1467-9868.2005.00509.x · Cited by 142 · cited 2×
“Other interesting works on the effects of dependence on the number of false discoveries rather than FDR are Owen [27] and Korn et al.”
Generating Correlation Matrices
Marsaglia, G., & Olkin, I. (1984) · SIAM Journal on Scientific and Statistical Computing · doi:10.1137/0905034 · Cited by 115 · cited 1×
“Generating constrained random correlation matrices Unconstrained random correlation matrices are generated simply by products of matrix transposes and its standardizations [31].”
Qiu, X., Klebanov, L. B., & Yakovlev, A. (2005) · Statistical Applications in Genetics and Molecular Biology · doi:10.2202/1544-6115.1157 · Cited by 109 · cited 2×
“[14] investigate the vulnerability of application of empirical Bayes theory under strong correlations.”
Covariance decomposition in undirected Gaussian graphical models
Jones, B., & West, M. (2005) · Biometrika · doi:10.1093/biomet/92.4.779 · Cited by 79 · cited 1×
“Nowadays, explaining high-dimensional data with conditional independence structures is quite active especially in microarray data analysis [1,22-24].”
A Note on the Adaptive Control of False Discovery Rates
Black, M. A. (2004) · Journal of the Royal Statistical Society Series B (Statistical Methodology) · doi:10.1111/j.1369-7412.2003.05527.x · Cited by 69 · cited 4×
“Careful simulation studies on the comparison of performance of π 0 estimation methods are done by Black [9] and Langaas et al. [10].”
InfluentialHow accurately can we control the FDR in analyzing microarray data?
Jung, S., & Jang, W. (2006) · Bioinformatics · doi:10.1093/bioinformatics/btl161 · Cited by 30 · cited 1×
“[16] who simulate multivariate normal test staFDR ≤ = ≤ m m 0 0 γ π γ γ .”
Statistical Applications in Genetics and Molecular Biology
Qiu, X., Klebanov, L. B., & Yakovlev, A. (2005) · Cited by 4
Cited by
Sorted by citations
Overexpression of lncRNA H19 enhances carcinogenesis and metastasis of gastric cancer
Li, H., Yu, B., Li, J., Su, L., Yan, M., Zhu, Z., & Liu, B. (2014) · Oncotarget · doi:10.18632/oncotarget.1913 · Cited by 509
“01) in the functional annotation categories based on genes identified in the microarray [21-22].”
BackgroundLarge-scale GWAS reveals insights into the genetic architecture of same-sex sexual behavior
Ganna, A., Verweij, K. J. H., Nivard, M. G., Maier, R., Wedow, R., Busch, A. S., Abdellaoui, A., Guo, S., Sathirapongsasuti, J. F., 23andMe Research Team, et al. (2019) · Science · doi:10.1126/science.aat7693 · Cited by 406
Cytokine signature associated with disease severity in chronic fatigue syndrome patients
Montoya, J. G., Holmes, T. H., Anderson, J. N., Maecker, H. T., Rosenberg‐Hasson, Y., Valencia, I. J., Chu, L., Younger, J., Tato, C. M., & Davis, M. M. (2017) · Proceedings of the National Academy of Sciences · doi:10.1073/pnas.1710519114 · Cited by 397
“Therefore, nonspecific binding was included as a covariate to prevent introduction of bias (60).”
BackgroundMethodMultiple hypothesis testing in genomics
Goeman, J. J., & Solari, A. (2014) · Statistics in Medicine · doi:10.1002/sim.6082 · Cited by 393
“FDR control for the adaptive Benjamini, Krieger and Yekutieli procedure has only yet been proven under independence, although simulations suggest FDR control under positive dependence as well [31, 57, 58].”
BackgroundMethodInfluentialAcoustic Enhancement of Sleep Slow Oscillations and Concomitant Memory Improvement in Older Adults
Papalambros, N. A., Santostasi, G., Malkani, R. G., Braun, R., Weintraub, S., Paller, K. A., & Zee, P. C. (2017) · Frontiers in Human Neuroscience · doi:10.3389/fnhum.2017.00109 · Cited by 259
Metadata
- Authors
- Kim, K. I., & van de Wiel, M. A.
- Affiliations
- Eindhoven University of Technology (NL)
- Corresponding author
- Kim, Kyung In
- Venue
- BMC Bioinformatics
- Published
- 2008-02-25
- Volume
- 9
- Issue
- 1
- Pages
- 114-114
- ISSN
- 1471-2105 (ISSN-L)
- PMC
- PMC2375137
- OpenAlex
- W2116319049
- Cited by
- 220
- References
- 34
- Citations by year
- 2026: 3 · 2025: 5 · 2024: 6 · 2023: 15 · 2022: 11 · 2021: 13 · 2020: 29 · 2019: 33 · 2018: 15 · 2017: 19 · 2016: 14 · 2015: 10 · 2014: 14 · 2013: 5 · 2012: 5
- FWCI
- 7.24
- Type
- journal article
- Language
- en
- Open access
- gold
- doi.org
- Licence
- Locations
- BMC Bioinformatics (publishedVersion, cc-by)
- PubMed Central (publishedVersion, cc-by)
- PubMed (publishedVersion)
- Amsterdam UMC (VU Amsterdam) - Institutional Repository (publishedVersion, other-oa)
- TU/e Research Portal (publishedVersion, other-oa)
- Pure Amsterdam UMC (submittedVersion, other-oa)
- TU/e Research Portal (submittedVersion, other-oa)
- TU/e Research Portal (submittedVersion)
- DOAJ (DOAJ: Directory of Open Access Journals) (submittedVersion)
- VU Research Portal (submittedVersion, other-oa)
- Data Archiving and Networked Services (DANS) (submittedVersion, other-oa)
- Topics
- Physical Sciences › Mathematics › Statistics and Probability › Statistical Methods in Clinical Trials
- Life Sciences › Biochemistry, Genetics and Molecular Biology › Molecular Biology › Gene expression and cancer classification
- Physical Sciences › Mathematics › Statistics and Probability › Statistical Methods and Inference
- Keywords
- multiple comparisons, false discovery rate, high-dimensional data, microarray data, conditional independence structure, sparsity
- MeSH terms
- Algorithms, Sensitivity and Specificity, Statistics as Topic, Reproducibility of Results, Artifacts, Oligonucleotide Array Sequence Analysis, Gene Expression Profiling
About these checks
Registry, retraction, Cites and statistics results are computed, not judged, with one exception: a printed reference that no index lists is read once by a model before it counts as a citation error. Claims are extracted by a model and kept only when their quote appears verbatim in the text; each cited source is then checked, with a model’s help, for whether it says what the claim relies on. Those verdicts can be wrong — read the claim’s quote and the cited source before relying on one.
Statistics and arithmetic are recomputed, not judged.
Confidence bands are shown only for fields calibrated on our annotated test set. None is calibrated yet, so no band is shown.
What counts as a claim ›How we measure confidence ›How we check this ›
Are you an author, or do you see a problem with this page? Request a review
