Student or educator? Sign up with your school email and get 6 months of Pro free.
CoChat

The DOI matches its Crossref record; the references it cites are not checked yet.

RNA-seq: technical variability and sampling

Open access

Abstract

BACKGROUND: RNA-seq is revolutionizing the way we study transcriptomes. mRNA can be surveyed without prior knowledge of gene transcripts. Alternative splicing of transcript isoforms and the identification of previously unknown exons are being reported. Initial reports of differences in exon usage, and splicing between samples as well as quantitative differences among samples are beginning to surface. Biological variation has been reported to be larger than technical variation. In addition, technical variation has been reported to be in line with expectations due to random sampling. However, strategies for dealing with technical variation will differ depending on the magnitude. The size of technical variance, and the role of sampling are examined in this manuscript. RESULTS: In this study three independent Solexa/Illumina experiments containing technical replicates are analyzed. When coverage is low, large disagreements between technical replicates are apparent. Exon detection between technical replicates is highly variable when the coverage is less than 5 reads per nucleotide and estimates of gene expression are more likely to disagree when coverage is low. Although large disagreements in the estimates of expression are observed at all levels of coverage. CONCLUSIONS: Technical variability is too high to ignore. Technical variability results in inconsistent detection of exons at low levels of coverage. Further, the estimate of the relative abundance of a transcript can substantially disagree, even when coverage levels are high. This may be due to the low sampling fraction and if so, it will persist as an issue needing to be addressed in experimental design even as the next wave of technology produces larger numbers of reads. We provide practical recommendations for dealing with the technical variability, without dramatic cost increases.

Overview

The claims and statistics of this paper haven’t been checked yet.

Free: it reads the open-access text and checks the first 5 claims that cite a source we can check. Create a free account to check every claim.

A few free checks a day · papers already verified open instantly · results are public

Integrity signals

Registry

Crossref · 10.1186/1471-2164-12-293

Cites

Statistics

Figures

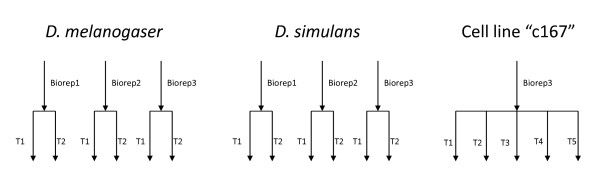
Figure 1 Experimental Design. A figure showing the design of the three experiments evaluated here. Biological replicates are separate individuals used for library construction. Technical replicates for the D. melanogaster female heads and D. simulans male heads data are a single library run on multiple lanes. For D. melanogaster c167 cell lines the exact nature of the technical replication is uncertain.
Figure 1 Experimental Design. A figure showing the design of the three experiments evaluated here. Biological replicates are separate individuals used for library construction. Technical replicates for the D. melanogaster female heads and D. simulans male heads data are a single library run on multiple lanes. For D. melanogaster c167 cell lines the exact nature of the technical replication is uncertain.CC BY · PubMed Central
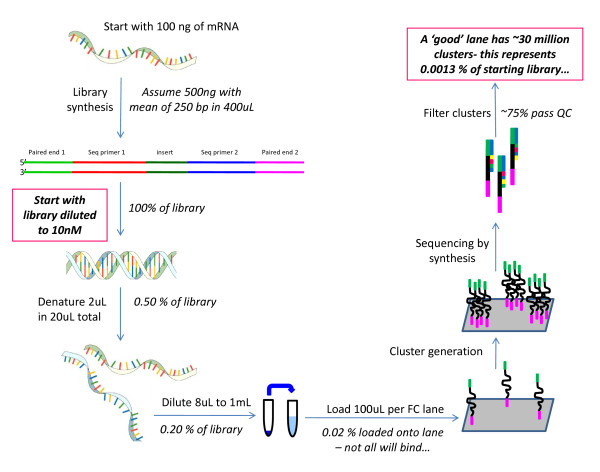
Figure 2 Library construction and sequencing. Beginning with 100 ng of mRNA the manufacturer's protocol is used to estimate a sampling fraction.
Figure 2 Library construction and sequencing. Beginning with 100 ng of mRNA the manufacturer's protocol is used to estimate a sampling fraction.CC BY · PubMed Central
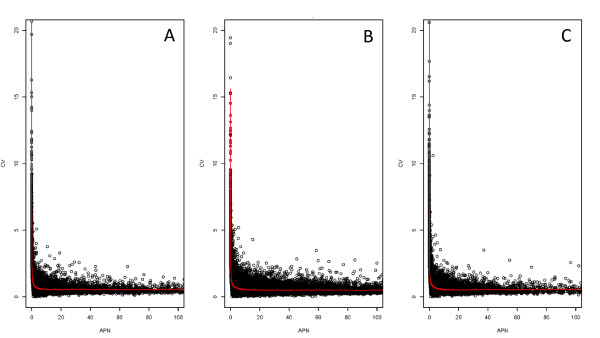
Figure 3 Coefficient of variation (CV) plotted on Y axis and average depth per nucleotide (APN) on X axis. Points with average depth of greater than 1000 are not displayed. Panel A is D. simulans BR2 TR2. Panel B is D. melanogaster female heads BR2 TR1. Panel C is TR1 for cell line c 167. Note that despite the difference in the number of mappable reads, the pattern of CV against the mean remains the same. CVs are very large when the average expression is low. Individual points represent exonic regions (Flybase 5.4) cubic smoothing line fit using R's smooth.spline function.
Figure 3 Coefficient of variation (CV) plotted on Y axis and average depth per nucleotide (APN) on X axis. Points with average depth of greater than 1000 are not displayed. Panel A is D. simulans BR2 TR2. Panel B is D. melanogaster female heads BR2 TR1. Panel C is TR1 for cell line c 167. Note that despite the difference in the number of mappable reads, the pattern of CV against the mean remains the same. CVs are very large when the average expression is low. Individual points represent exonic regions (Flybase 5.4) cubic smoothing line fit using R's smooth.spline function.CC BY · PubMed Central
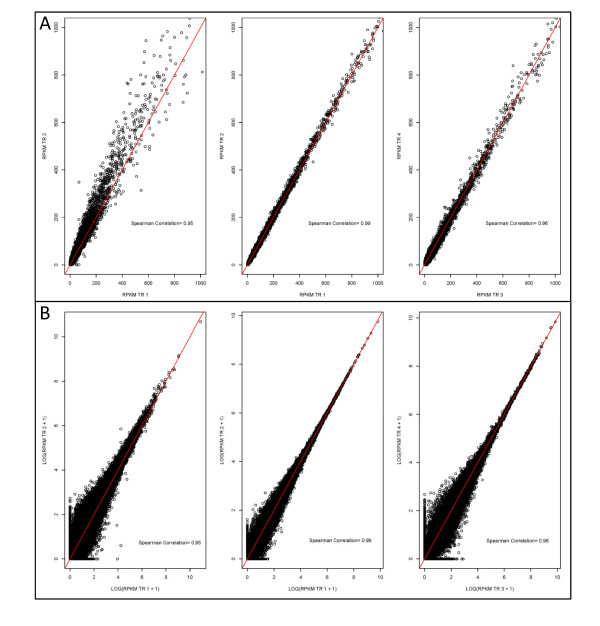
Figure 4 Scatterplot of technical replicates. Points where RPKM is 1000 or less are displayed (A). The red line is the 45 degree line. Left panel is D. simulans male heads BR2, middle panel is D. melanogaster female heads BR2 and right panel is D. melanogaster cell line c167 Tr3 vs TR4. Spearman correlation values are (0.95, 0.99, 0.96), respectively. Scatterplot of technical replicates on the log scale (log(RPKM+1)) for RPKM values of less than 1000) (B). The red line is the 45 degree line. Left panel is D. simulans male heads BR2, middle panel is D. melanogaster female heads BR2 and right panel is D. melanogaster cell line c167 Tr3 vs TR4. Spearman correlation values are (0.95, 0.99, 0.96), respectively.
Figure 4 Scatterplot of technical replicates. Points where RPKM is 1000 or less are displayed (A). The red line is the 45 degree line. Left panel is D. simulans male heads BR2, middle panel is D. melanogaster female heads BR2 and right panel is D. melanogaster cell line c167 Tr3 vs TR4. Spearman correlation values are (0.95, 0.99, 0.96), respectively. Scatterplot of technical replicates on the log scale (log(RPKM+1)) for RPKM values of less than 1000) (B). The red line is the 45 degree line. Left panel is D. simulans male heads BR2, middle panel is D. melanogaster female heads BR2 and right panel is D. melanogaster cell line c167 Tr3 vs TR4. Spearman correlation values are (0.95, 0.99, 0.96), respectively.CC BY · PubMed Central
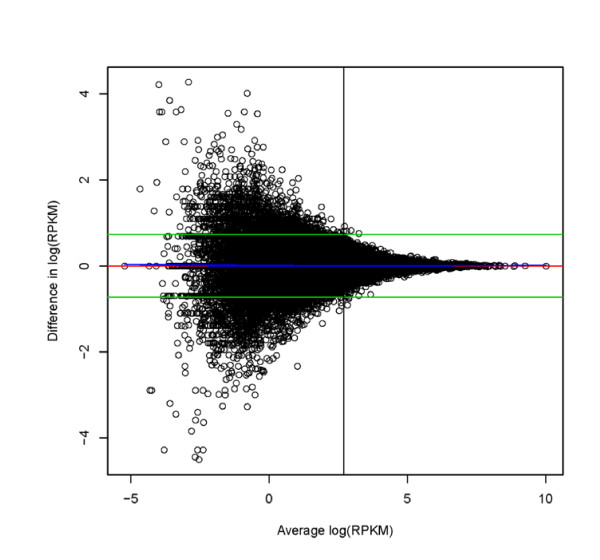
Figure 5 Bland-Altman plot showing level of agreement between technical replicates for natural log transformed RPKM D. simulans biological replicate 3. On the Y axis is the difference between technical replicates and on the X axis is the average between technical replicates. Green lines are the average of all differences +/- 1.96 (standard deviation of the differences). The red line is drawn at zero. The blue line is a loess fit. The discrepancy between technical replicates is a function of the estimated expression level. The horizontal line is drawn at an average coverage per nucleotide of 5. Bland-Altman plots for all the remaining comparisons among technical replicates are in Additional file 11.
Figure 5 Bland-Altman plot showing level of agreement between technical replicates for natural log transformed RPKM D. simulans biological replicate 3. On the Y axis is the difference between technical replicates and on the X axis is the average between technical replicates. Green lines are the average of all differences +/- 1.96 (standard deviation of the differences). The red line is drawn at zero. The blue line is a loess fit. The discrepancy between technical replicates is a function of the estimated expression level. The horizontal line is drawn at an average coverage per nucleotide of 5. Bland-Altman plots for all the remaining comparisons among technical replicates are in Additional file 11.CC BY · PubMed Central
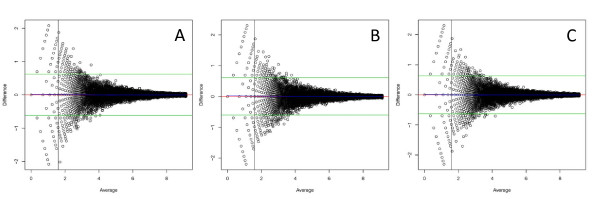
Figure 6 Bland-Altman plot for simulated data. The data were log transformed and the average of the two technical replicates is on the X axis and the difference between technical replicates is on the Y axis. (A) Simulated replicates 1 versus 2. (B) Simulated replicates 1 versus 3. (C) Simulated replicates 2 versus 3. Green lines are the average of all differences +/- 1.96 (standard deviation of the differences). The red line is drawn at zero. The blue line is a lowess fit.
Figure 6 Bland-Altman plot for simulated data. The data were log transformed and the average of the two technical replicates is on the X axis and the difference between technical replicates is on the Y axis. (A) Simulated replicates 1 versus 2. (B) Simulated replicates 1 versus 3. (C) Simulated replicates 2 versus 3. Green lines are the average of all differences +/- 1.96 (standard deviation of the differences). The red line is drawn at zero. The blue line is a lowess fit.CC BY · PubMed Central

Verification

Claims the paper makes

The claims and statistics of this paper haven’t been checked yet.

Free: it reads the open-access text and checks the first 5 claims that cite a source we can check. Create a free account to check every claim.

A few free checks a day · papers already verified open instantly · results are public

Self-check

Percentages, sums and reported differences re-computed from the paper’s own numbers.

The self-check needs the paper’s full text.

Citations

The citation lists are queued

They are fetched later and appear here then.

References 53 · Cited by 285

Metadata

Authors
McIntyre, L. M., Lopiano, K. K., Morse, A. M., Amin, V., Oberg, A. L., Young, L. J., & Nuzhdin, S. V.
Affiliations
  • University of Florida (US)
  • Mayo Clinic (US)
  • University of Southern California (US)
Corresponding author
McIntyre, Lauren M
Venue
BMC Genomics
Published
2011-06-06
Volume
12
Issue
1
Pages
293-293
ISSN
1471-2164 (ISSN-L)
OpenAlex
W2055027171
Cited by
285
References
53
Citations by year
2026: 6 · 2025: 12 · 2024: 10 · 2023: 8 · 2022: 14 · 2021: 27 · 2020: 13 · 2019: 20 · 2018: 26 · 2017: 30 · 2016: 22 · 2015: 16 · 2014: 31 · 2013: 26 · 2012: 18
FWCI
10.51
Type
journal article
Language
en
Open access
Licence
  • cc-by
  • creativecommons.org/licenses/by/2.0 (tdm)
Locations
  • BMC Genomics (publishedVersion, cc-by)
  • PubMed Central (publishedVersion, cc-by)
  • PubMed (publishedVersion)
  • DOAJ (DOAJ: Directory of Open Access Journals) (submittedVersion)
Funders
  • National Science Foundation (0821954, 0821622)
  • National Institutes of Health (5r01gm077618-04, n01ai40065-5-0-0)
  • National Institute of General Medical Sciences (R01-GM077618, R01-GM077618-S1, R01GM076643)
  • National Institute of Allergy and Infectious Diseases (N01AI40065)
Topics
  • Life Sciences › Biochemistry, Genetics and Molecular Biology › Molecular Biology › Genomics and Phylogenetic Studies
  • Life Sciences › Biochemistry, Genetics and Molecular Biology › Molecular Biology › Gene expression and cancer classification
  • Life Sciences › Biochemistry, Genetics and Molecular Biology › Molecular Biology › Single-cell and spatial transcriptomics
Keywords
RNA-seq, technical variability, sampling variability, technical replicates, gene expression estimation, sequencing depth, transcriptome, alternative splicing, exon usage, experimental design
MeSH terms
Animals, Drosophila, Exons, Female, Male, Sequence Analysis, RNA, Gene Expression Profiling

About these checks

Registry, retraction, Cites and statistics results are computed, not judged, with one exception: a printed reference that no index lists is read once by a model before it counts as a citation error. Claims are extracted by a model and kept only when their quote appears verbatim in the text; each cited source is then checked, with a model’s help, for whether it says what the claim relies on. Those verdicts can be wrong — read the claim’s quote and the cited source before relying on one.

Statistics and arithmetic are recomputed, not judged.

Confidence bands are shown only for fields calibrated on our annotated test set. None is calibrated yet, so no band is shown.

What counts as a claim ›How we measure confidence ›How we check this ›

Are you an author, or do you see a problem with this page? Request a review

How to cite

Cite CoChat for the checks on this page, and the paper for its own findings.

This page
CoChat. (2026). Citation check: RNA-seq: technical variability and sampling. https://app.cochat.ai/papers/10.1186/1471-2164-12-293
The paper
McIntyre, L. M., Lopiano, K. K., Morse, A. M., Amin, V., Oberg, A. L., Young, L. J., & Nuzhdin, S. V. (2011). RNA-seq: technical variability and sampling. BMC Genomics. https://doi.org/10.1186/1471-2164-12-293

Data sources

Bibliographic data: Semantic Scholar, OpenAlex, Crossref.

Contains information from the Semantic Scholar Academic Graph Datasets, made available under the ODC Attribution License (ODC-BY 1.0).

Semantic Scholar’s data is described in: Kinney, R., et al. (2023). The Semantic Scholar Open Data Platform. arXiv:2301.10140.