

The DOI matches its Crossref record; 35 of the 35 references it cites were found in a registry or an index.
GC content around splice sites affects splicing through pre-mRNA secondary structures
Open accessAbstract
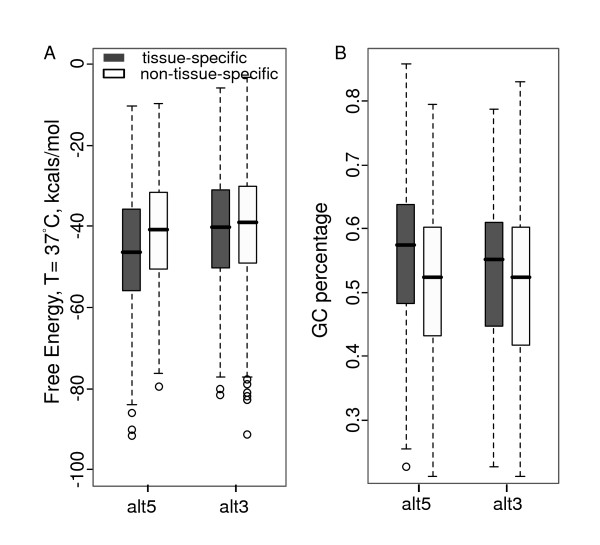
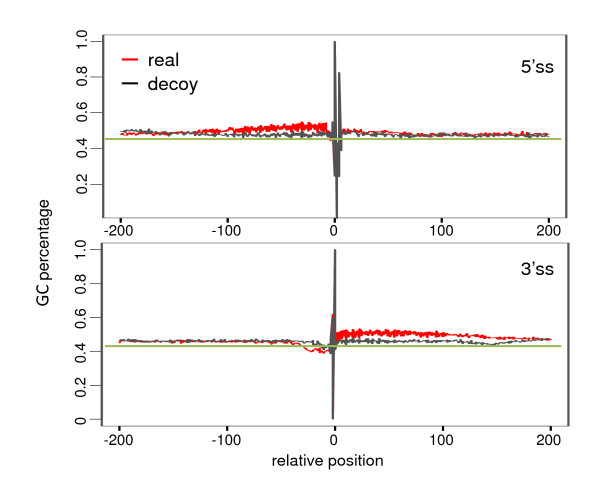
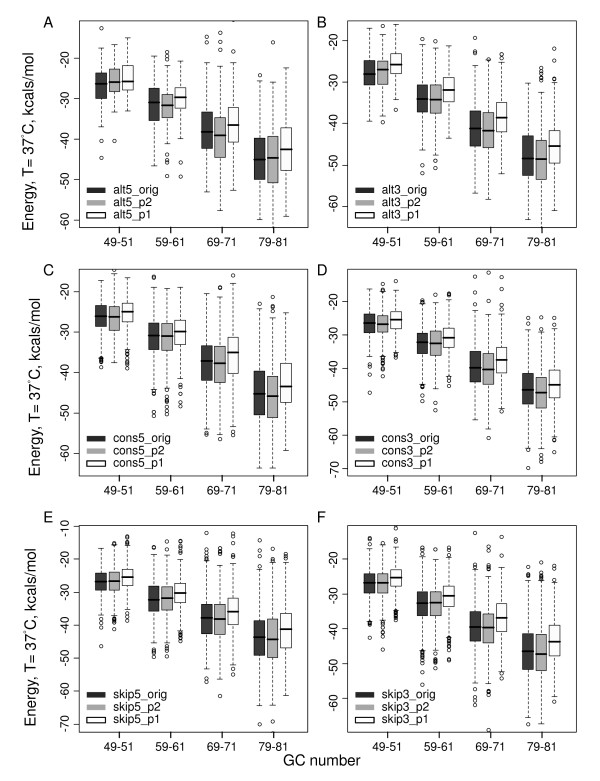
BACKGROUND: Alternative splicing increases protein diversity by generating multiple transcript isoforms from a single gene through different combinations of exons or through different selections of splice sites. It has been reported that RNA secondary structures are involved in alternative splicing. Here we perform a genomic study of RNA secondary structures around splice sites in humans (Homo sapiens), mice (Mus musculus), fruit flies (Drosophila melanogaster), and nematodes (Caenorhabditis elegans) to further investigate this phenomenon. RESULTS: We observe that GC content around splice sites is closely associated with the splice site usage in multiple species. RNA secondary structure is the possible explanation, because the structural stability difference among alternative splice sites, constitutive splice sites, and skipped splice sites can be explained by the GC content difference. Alternative splice sites tend to be GC-enriched and exhibit more stable RNA secondary structures in all of the considered species. In humans and mice, splice sites of first exons and long exons tend to be GC-enriched and hence form more stable structures, indicating the special role of RNA secondary structures in promoter proximal splicing events and the splicing of long exons. In addition, GC-enriched exon-intron junctions tend to be overrepresented in tissue-specific alternative splice sites, indicating the functional consequence of the GC effect. Compared with regions far from splice sites and decoy splice sites, real splice sites are GC-enriched. We also found that the GC-content effect is much stronger than the nucleotide-order effect to form stable secondary structures. CONCLUSION: All of these results indicate that GC content is related to splice site usage and it may mediate the splicing process through RNA secondary structures.
Overview
The claims and statistics of this paper haven’t been checked yet.
Run the check — free, no account needed. It reads the open-access text and checks the sources it cites.
Integrity signals
Registry
Cites
Statistics
Figures
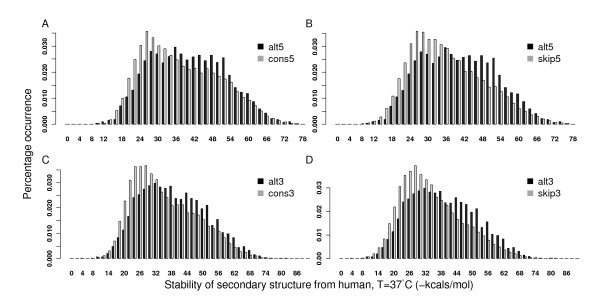
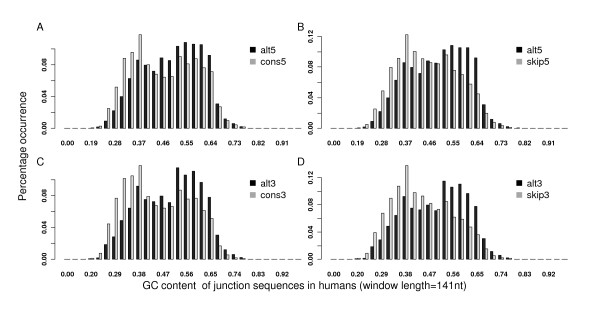
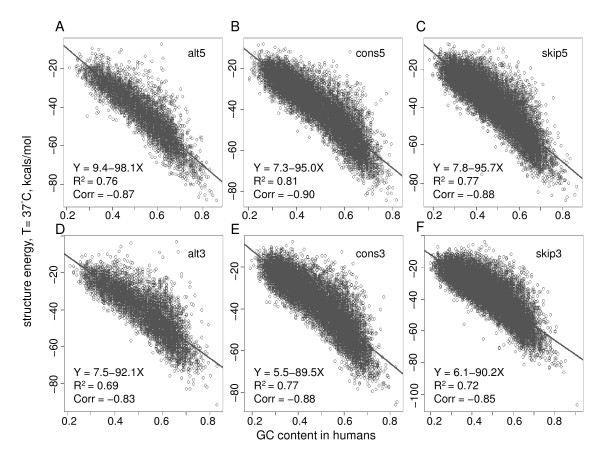
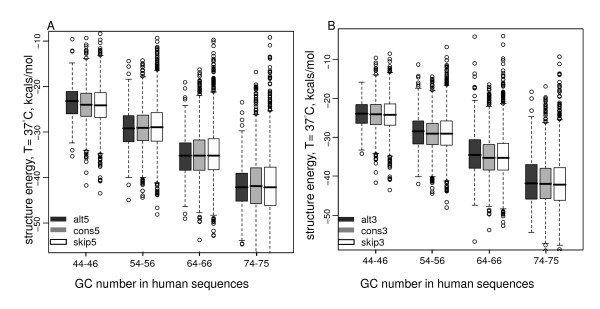
Verification
Claims the paper makes
The claims and statistics of this paper haven’t been checked yet.
Run the check — free, no account needed. It reads the open-access text and checks the sources it cites.
Claims other papers make about this one
Each is checked against this paper’s own text: does it say what the citing paper says it does?
In the citing paper
“CureVac uses GC-enrichment, which should have a similar effect (Hubert, 2021, Zhang et al., 2011).”
From mRNA-lipid nanoparticle COVID-19 vaccines: structure and stability (2021) · cites this paper as Zhang et al., 2011
Self-check
Percentages, sums and reported differences re-computed from the paper’s own numbers.
The self-check needs the paper’s full text.
Citations
Cites
Listening to silence and understanding nonsense: exonic mutations that affect splicing
Cartegni, L., Chew, S. L., & Krainer, A. R. (2002) · Nature Reviews Genetics · doi:10.1038/nrg775 · Cited by 2,209
Maximum Entropy Modeling of Short Sequence Motifs with Applications to RNA Splicing Signals
Yeo, G. W.-M., & Burge, C. B. (2004) · Journal of Computational Biology · doi:10.1089/1066527041410418 · Cited by 2,042
Pre-mRNA splicing and human diseasePreprint
Faustino, N. A., & Cooper, T. A. (2003) · Genes & Development · doi:10.1101/gad.1048803 · Cited by 1,248
Splicing regulation: From a parts list of regulatory elements to an integrated splicing code
Wang, Z., & Burge, C. B. (2008) · RNA · doi:10.1261/rna.876308 · Cited by 1,127
Jurica, M. S., & Moore, M. J. (2003) · Molecular Cell · doi:10.1016/s1097-2765(03)00270-3 · Cited by 963
Barash, Y., Calarco, J. A., Gao, W., Pan, Q., Wang, X., Shai, O., Blencowe, B. J., & Frey, B. J. (2010) · Nature · doi:10.1038/nature09000 · Cited by 925
Comprehensive proteomic analysis of the human spliceosome
Zhou, Z., Licklider, L. J., Gygi, S. P., & Reed, R. (2002) · Nature · doi:10.1038/nature01031 · Cited by 884
Genome-wide measurement of RNA secondary structure in yeast
Kertesz, M., Wan, Y., Mazor, E., Rinn, J. L., Nutter, R. C., Chang, H. Y., & Segal, E. (2010) · Nature · doi:10.1038/nature09322 · Cited by 769
Influence of RNA Secondary Structure on the Pre-mRNA Splicing Process
Buratti, E., & Baralle, F. E. (2004) · Molecular and Cellular Biology · doi:10.1128/mcb.24.24.10505-10514.2004 · Cited by 424
Castle, J. C., Zhang, C., Shah, J. K., Kulkarni, A., Kalsotra, A., Cooper, T. A., & Johnson, J. M. (2008) · Nature Genetics · doi:10.1038/ng.264 · Cited by 332
Cited by
Sorted by citations
mRNA-lipid nanoparticle COVID-19 vaccines: structure and stability
Schoenmaker, L., Witzigmann, D., Kulkarni, J. A., Verbeke, R., Kersten, G., Jiskoot, W., & Crommelin, D. J. A. (2021) · International Journal of Pharmaceutics · doi:10.1016/j.ijpharm.2021.120586 · Cited by 1,566
Saturation editing of genomic regions by multiplex homology-directed repair
Findlay, G. M., Boyle, E. A., Hause, R. J., Klein, J. C., & Shendure, J. (2014) · Nature · doi:10.1038/nature13695 · Cited by 362
Krajewska, M., Dries, R., Grassetti, A. V., Dust, S., Gao, Y., Huang, H., Sharma, B., Day, D. S., Kwiatkowski, N., Pomaville, M., et al. (2019) · Nature Communications · doi:10.1038/s41467-019-09703-y · Cited by 281
RNA structure and the mechanisms of alternative splicing
McManus, C. J., & Graveley, B. R. (2011) · Current Opinion in Genetics & Development · doi:10.1016/j.gde.2011.04.001 · Cited by 294
Research Advances on the Stability of mRNA Vaccines
Cheng, F., Wang, Y., Bai, Y., Liang, Z., Mao, Q., Liu, D., Wu, X., & Xu, M. (2023) · Viruses · doi:10.3390/v15030668 · Cited by 177
Metadata
- Authors
- Zhang, J., Kuo, C. J., & Chen, L.
- Affiliations
- University of Southern California (US)
- Corresponding author
- Chen, Liang
- Venue
- BMC Genomics
- Published
- 2011-01-31
- Volume
- 12
- Issue
- 1
- Pages
- 90-90
- ISSN
- 1471-2164 (ISSN-L)
- PMC
- PMC3041747
- OpenAlex
- W2074860825
- Cited by
- 108
- References
- 34
- Citations by year
- 2026: 11 · 2025: 10 · 2024: 8 · 2023: 8 · 2022: 6 · 2021: 7 · 2020: 3 · 2019: 12 · 2018: 4 · 2017: 5 · 2016: 3 · 2015: 7 · 2014: 9 · 2013: 6 · 2012: 7
- FWCI
- 3.11
- Type
- journal article
- Language
- en
- Open access
- gold
- doi.org
- Licence
- Locations
- BMC Genomics (publishedVersion, cc-by)
- PubMed Central (publishedVersion, cc-by)
- PubMed (publishedVersion)
- DOAJ (DOAJ: Directory of Open Access Journals) (submittedVersion)
- Funders
- National Institutes of Health
- National Human Genome Research Institute (P50HG002790)
- Topics
- Life Sciences › Biochemistry, Genetics and Molecular Biology › Molecular Biology › RNA Research and Splicing
- Life Sciences › Biochemistry, Genetics and Molecular Biology › Molecular Biology › RNA and protein synthesis mechanisms
- Life Sciences › Biochemistry, Genetics and Molecular Biology › Molecular Biology › RNA regulation and disease
- Keywords
- GC content, splice sites, alternative splicing, RNA secondary structure, pre-mRNA splicing, exon-intron junctions, tissue-specific splicing
- MeSH terms
- Animals, Base Composition, Drosophila, Humans, Nucleic Acid Conformation, RNA Precursors, RNA Splicing, Caenorhabditis elegans, Mice
About these checks
Registry, retraction, Cites and statistics results are computed, not judged, with one exception: a printed reference that no index lists is read once by a model before it counts as a citation error. Claims are extracted by a model and kept only when their quote appears verbatim in the text; each cited source is then checked, with a model’s help, for whether it says what the claim relies on. Those verdicts can be wrong — read the claim’s quote and the cited source before relying on one.
Statistics and arithmetic are recomputed, not judged.
Confidence bands are shown only for fields calibrated on our annotated test set. None is calibrated yet, so no band is shown.
What counts as a claim ›How we measure confidence ›How we check this ›
Are you an author, or do you see a problem with this page? Request a review
