

The DOI matches its Crossref record; 15 of the 15 references it cites were found in a registry or an index.
Estimating the sample mean and standard deviation from the sample size, median, range and/or interquartile range
Open accessAbstract
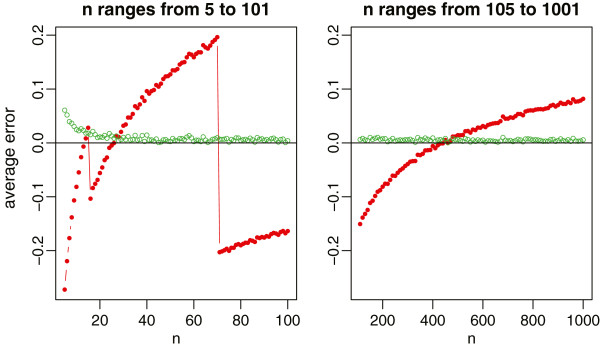
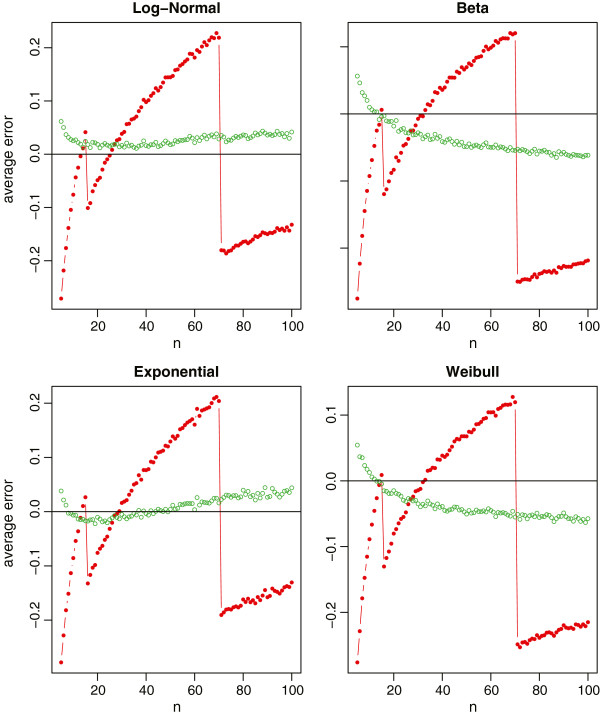
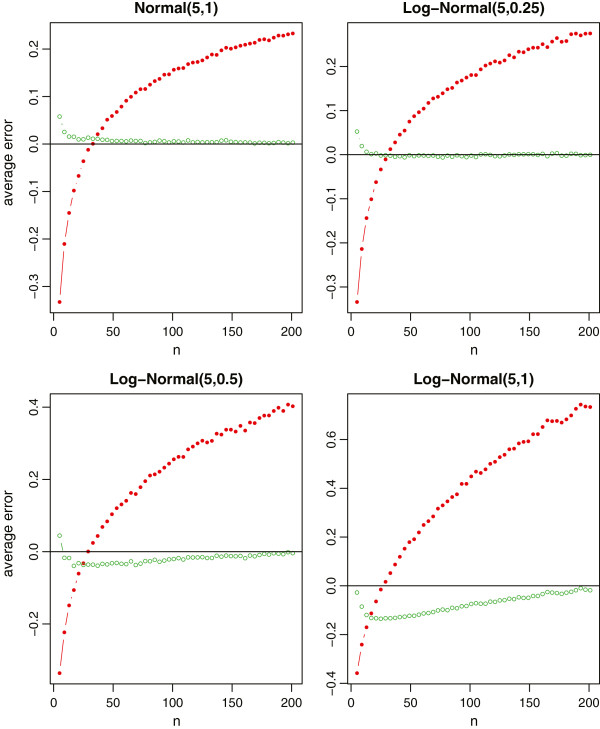
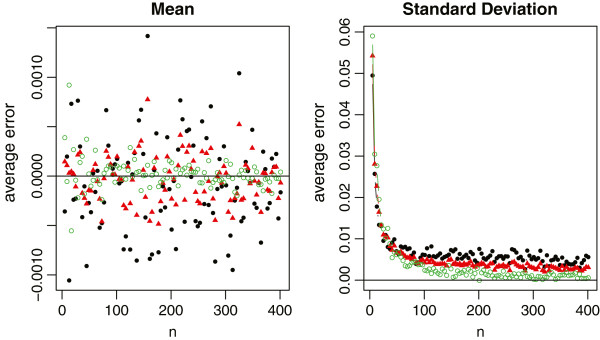
BACKGROUND: In systematic reviews and meta-analysis, researchers often pool the results of the sample mean and standard deviation from a set of similar clinical trials. A number of the trials, however, reported the study using the median, the minimum and maximum values, and/or the first and third quartiles. Hence, in order to combine results, one may have to estimate the sample mean and standard deviation for such trials. METHODS: In this paper, we propose to improve the existing literature in several directions. First, we show that the sample standard deviation estimation in Hozo et al.'s method (BMC Med Res Methodol 5:13, 2005) has some serious limitations and is always less satisfactory in practice. Inspired by this, we propose a new estimation method by incorporating the sample size. Second, we systematically study the sample mean and standard deviation estimation problem under several other interesting settings where the interquartile range is also available for the trials. RESULTS: We demonstrate the performance of the proposed methods through simulation studies for the three frequently encountered scenarios, respectively. For the first two scenarios, our method greatly improves existing methods and provides a nearly unbiased estimate of the true sample standard deviation for normal data and a slightly biased estimate for skewed data. For the third scenario, our method still performs very well for both normal data and skewed data. Furthermore, we compare the estimators of the sample mean and standard deviation under all three scenarios and present some suggestions on which scenario is preferred in real-world applications. CONCLUSIONS: In this paper, we discuss different approximation methods in the estimation of the sample mean and standard deviation and propose some new estimation methods to improve the existing literature. We conclude our work with a summary table (an Excel spread sheet including all formulas) that serves as a comprehensive guidance for performing meta-analysis in different situations.
Overview
The claims and statistics of this paper haven’t been checked yet.
Run the check — free, no account needed. It reads the open-access text and checks the sources it cites.
Integrity signals
Registry
Cites
Statistics
Figures
Verification
Claims the paper makes
The claims and statistics of this paper haven’t been checked yet.
Run the check — free, no account needed. It reads the open-access text and checks the sources it cites.
Claims other papers make about this one
Each is checked against this paper’s own text: does it say what the citing paper says it does?
The cited source says what the claim attributes to it.
In the citing paper
“Banach et al. used a conversion for median and interquartile range but our study used an updated method [20,26].”
From Effect of Coenzyme Q10 on statin-associated myalgia and adherence to statin therapy: A systematic review and meta-analysis (2020) · cites this paper as [20]
The cited source says what the claim attributes to it.
In the citing paper
“When studies reported a median and interquartile range, we estimated the mean and standard deviation (SD) using conventional formulae (Luo et al., 2018;Wan et al., 2014).When both of these were absent, we estimated the standard deviation using prognostic imputation (Ma et al., 2008).”
From Decision making capacity for treatment in psychiatric inpatients: a systematic review and meta-analysis (2024) · cites this paper as Wan et al., 2014
Self-check
Percentages, sums and reported differences re-computed from the paper’s own numbers.
The self-check needs the paper’s full text.
Citations
Cites
Cochrane Handbook for Systematic Reviews of Interventions: Cochrane Book Series
(2008) · doi:10.1002/9780470712184 · Cited by 25,048 · cited 1×
“can also estimate the sample standard deviation by S ≈ q3 −q1 2Φ−1 0.75n− 125 n+0.25 . (16) A similar estimator for estimating the standard deviation from IQR is provided in the Cochrane Handbook [13], which is defined as S ≈ q3 −q1 1.35 . (17) Note that the estimator (17) is also independent of the sample size n and t…”
MethodInfluentialEstimating the mean and variance from the median, range, and the size of a sample
Hozo, S. P., Djulbegovic, B., & Hozo, I. (2005) · BMC Medical Research Methodology · doi:10.1186/1471-2288-5-13 · Cited by 9,062
Mathematical Methods of Statistics.
Geary, R. C., & Cramer, H. L. (1947) · The Economic Journal · doi:10.2307/2226151 · Cited by 6,095
Cochrane Handbook for Systematic Reviews of Interventions Version 5.0.1. The Cochrane Collaboration
Higgins, J., Green, S. R., & Higgins, J. (2008) · Cited by 5,544
Introduction to Mathematical Statistics.
Aa, Hogg, R. V., & Craig, A. T. (1996) · Journal of the American Statistical Association · doi:10.2307/2291439 · Cited by 2,907
David, H. A., & Nagaraja, H. N. (2003) · Wiley series in probability and statistics · doi:10.1002/0471722162 · Cited by 2,418
Statistical Estimates and Transformed Beta-Variables.
Minton, P. D., & Blom, G. (1960) · American Mathematical Monthly · doi:10.2307/2308690 · Cited by 1,168
Introduction to Mathematical Statistics.
Doksum, K. A., Hogg, R. W., & Craig, A. T. (1971) · Journal of the American Statistical Association · doi:10.2307/2283566 · Cited by 804
Expected values of normal order statistics
Harter, H. L. (1961) · Biometrika · doi:10.1093/biomet/48.1-2.151 · Cited by 340 · cited 2×
“Further discussion on the choice of α can be seen, for example, in Harter (1961) and Cramér (1999). Finally, by (8) and (9) with r = n and α = 0.”
BackgroundLiu, T., Li, G., Li, L., & Korantzopoulos, P. G. (2007) · Journal of the American College of Cardiology · doi:10.1016/j.jacc.2006.12.042 · Cited by 268 · cited 1×
“In contrast, the following procedure is commonly adopted in the recent literature including [11,12]: “If the study provided medians and IQR, we imputed the means and standard deviations as described by Hozo et al.”
Method
Research works printed but not linked: 1
- Triola M. F: Elementary Statistics, 11th Ed. 2009, Addison Wesley
Cited by
Sorted by citations
Luo, D., Wan, X., Liu, J., & Tong, T. (2018) · Statistical Methods in Medical Research · doi:10.1177/0962280216669183 · Cited by 4,066
“Finally, by plugging the approximation formula (6) into the estimator (4), we propose the estimator for Scenario S1 as XðwÞ 4 4þ n0:75 aþ b 2 þ n 0:75”
BackgroundMethodSelf-citationÇevik, M., Tate, M., Lloyd, O., Maraolo, A. E., Schafers, J., & Ho, A. Y. W. (2020) · The Lancet Microbe · doi:10.1016/s2666-5247(20)30172-5 · Cited by 1,334
Baigent, C., Emberson, J., Haynes, R., Herrington, W. G., Judge, P., Landray, M. J., Mayne, K. J., Ng, S. Y. A., Preiss, D., Roddick, A. J., et al. (2022) · The Lancet · doi:10.1016/s0140-6736(22)02074-8 · Cited by 1,020
Choosing effect measures and computing estimates of effect
Higgins, J. P., Li, T., & Deeks, J. J. (2019) · Cochrane Handbook for Systematic Reviews of Interventions · doi:10.1002/9781119536604.ch6 · Cited by 977
Psychometric properties of the EQ-5D-5L: a systematic review of the literature
Feng, Y.-S., Kohlmann, T., Janssen, M. F., & Buchholz, I. (2021) · Quality of Life Research · doi:10.1007/s11136-020-02688-y · Cited by 917
Metadata
- Authors
- Wan, X., Wang, W., Liu, J., & Tong, T.
- Affiliations
- Hong Kong Baptist University (HK)
- Northwestern University (US)
- Corresponding author
- Tong, Tiejun
- Venue
- BMC Medical Research Methodology
- Published
- 2014-12
- Volume
- 14
- Issue
- 1
- Pages
- 135-135
- ISSN
- 1471-2288 (ISSN-L)
- PMC
- PMC4383202
- OpenAlex
- W2170892587
- Cited by
- 11,735
- References
- 15
- Citations by year
- 2026: 1931 · 2025: 1918 · 2024: 1806 · 2023: 1600 · 2022: 1448 · 2021: 1273 · 2020: 803 · 2019: 438 · 2018: 248 · 2017: 156 · 2016: 90 · 2015: 12
- FWCI
- 83.87
- Type
- journal article
- Language
- en
- Open access
- gold
- doi.org
- Licence
- Locations
- BMC Medical Research Methodology (publishedVersion, cc-by)
- Europe PMC (PubMed Central) (publishedVersion, cc-by)
- PubMed Central (publishedVersion, cc-by)
- PubMed (publishedVersion)
- arXiv (Cornell University) (submittedVersion)
- HKBU Institutional Repository (Hong Kong Baptist University) (submittedVersion, other-oa)
- arXiv (Cornell University)
- Funders
- Hong Kong Baptist University (FRG2/13-14/062)
- Topics
- Social Sciences › Decision Sciences › Statistics, Probability and Uncertainty › Meta-analysis and systematic reviews
- Physical Sciences › Mathematics › Statistics and Probability › Statistical Methods in Epidemiology
- Physical Sciences › Mathematics › Statistics and Probability › Probability and Statistical Research
- Keywords
- sample mean estimation, median, range, interquartile range, meta-analysis, skewed data, normal data
- MeSH terms
- Algorithms, Computer Simulation, Humans, Review Literature as Topic, Statistics as Topic, Meta-Analysis as Topic, Reproducibility of Results, Sample Size, Biomedical Research
About these checks
Registry, retraction, Cites and statistics results are computed, not judged, with one exception: a printed reference that no index lists is read once by a model before it counts as a citation error. Claims are extracted by a model and kept only when their quote appears verbatim in the text; each cited source is then checked, with a model’s help, for whether it says what the claim relies on. Those verdicts can be wrong — read the claim’s quote and the cited source before relying on one.
Statistics and arithmetic are recomputed, not judged.
Confidence bands are shown only for fields calibrated on our annotated test set. None is calibrated yet, so no band is shown.
What counts as a claim ›How we measure confidence ›How we check this ›
Are you an author, or do you see a problem with this page? Request a review
