

The DOI matches its Crossref record; 32 of the 34 references it cites were found in a registry or an index.
Modern modelling techniques are data hungry: a simulation study for predicting dichotomous endpoints
Open accessAbstract
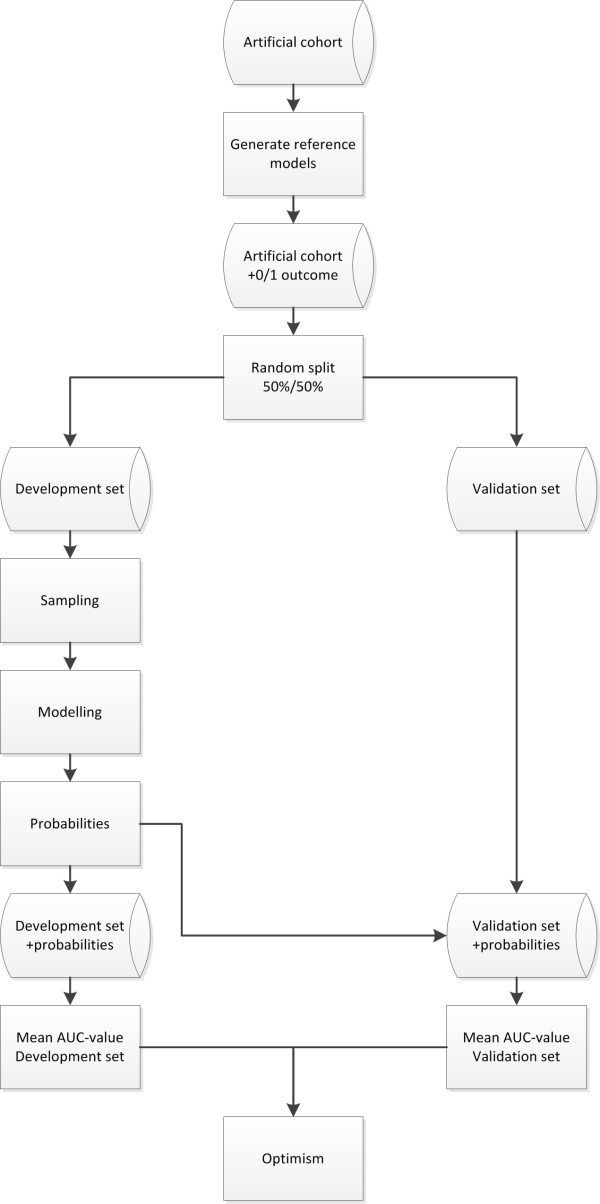
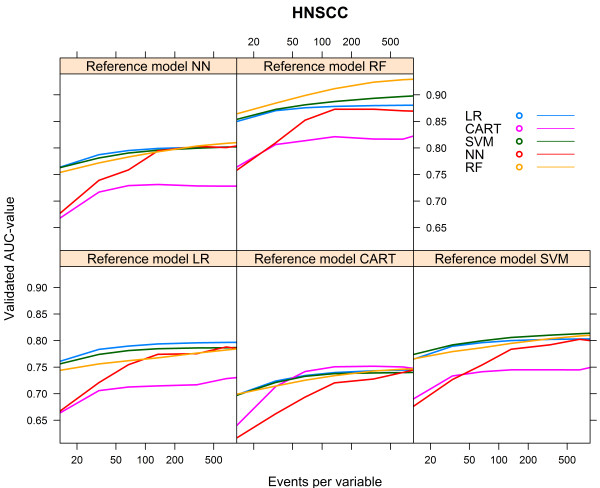
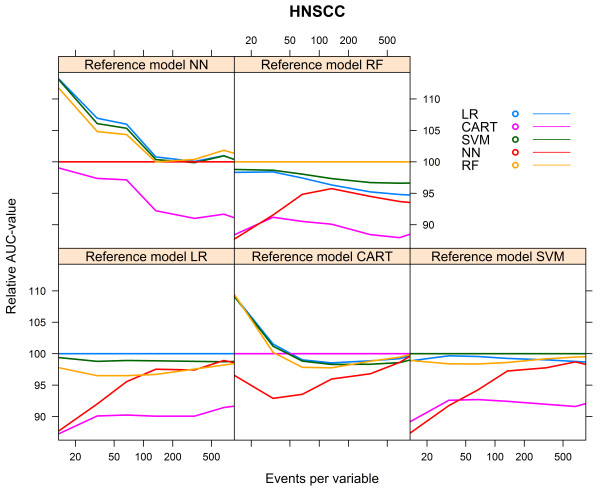
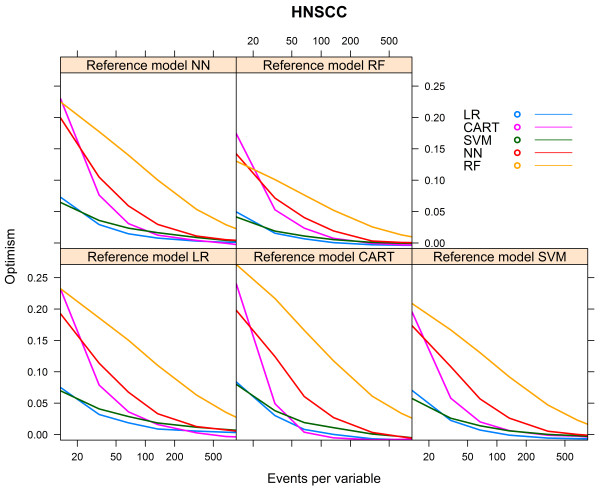
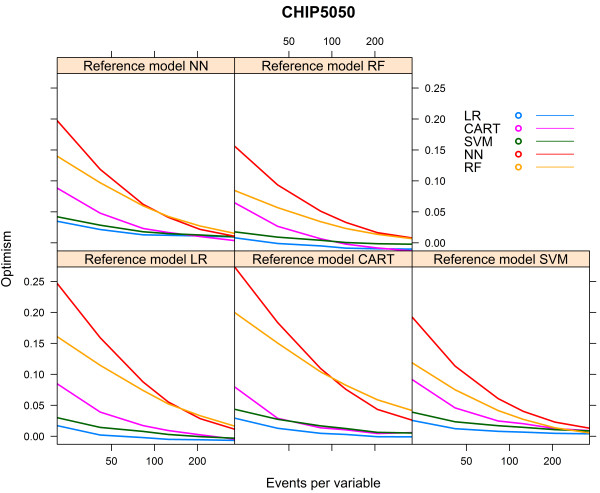
BACKGROUND: Modern modelling techniques may potentially provide more accurate predictions of binary outcomes than classical techniques. We aimed to study the predictive performance of different modelling techniques in relation to the effective sample size ("data hungriness"). METHODS: We performed simulation studies based on three clinical cohorts: 1282 patients with head and neck cancer (with 46.9% 5 year survival), 1731 patients with traumatic brain injury (22.3% 6 month mortality) and 3181 patients with minor head injury (7.6% with CT scan abnormalities). We compared three relatively modern modelling techniques: support vector machines (SVM), neural nets (NN), and random forests (RF) and two classical techniques: logistic regression (LR) and classification and regression trees (CART). We created three large artificial databases with 20 fold, 10 fold and 6 fold replication of subjects, where we generated dichotomous outcomes according to different underlying models. We applied each modelling technique to increasingly larger development parts (100 repetitions). The area under the ROC-curve (AUC) indicated the performance of each model in the development part and in an independent validation part. Data hungriness was defined by plateauing of AUC and small optimism (difference between the mean apparent AUC and the mean validated AUC <0.01). RESULTS: We found that a stable AUC was reached by LR at approximately 20 to 50 events per variable, followed by CART, SVM, NN and RF models. Optimism decreased with increasing sample sizes and the same ranking of techniques. The RF, SVM and NN models showed instability and a high optimism even with >200 events per variable. CONCLUSIONS: Modern modelling techniques such as SVM, NN and RF may need over 10 times as many events per variable to achieve a stable AUC and a small optimism than classical modelling techniques such as LR. This implies that such modern techniques should only be used in medical prediction problems if very large data sets are available.
Overview
The claims and statistics of this paper haven’t been checked yet.
Run the check — free, no account needed. It reads the open-access text and checks the sources it cites.
Integrity signals
Registry
Cites
Statistics
Figures
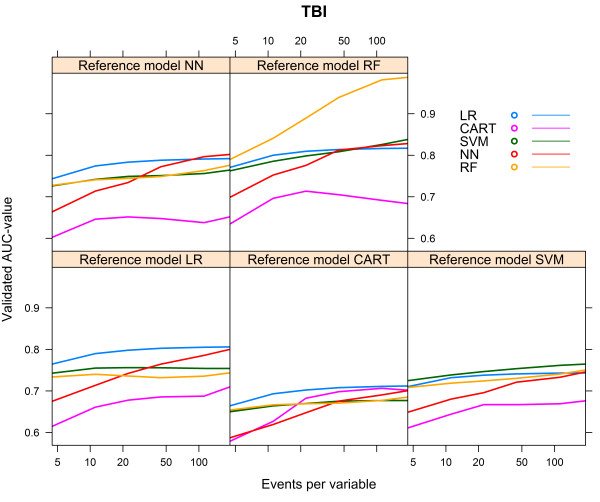
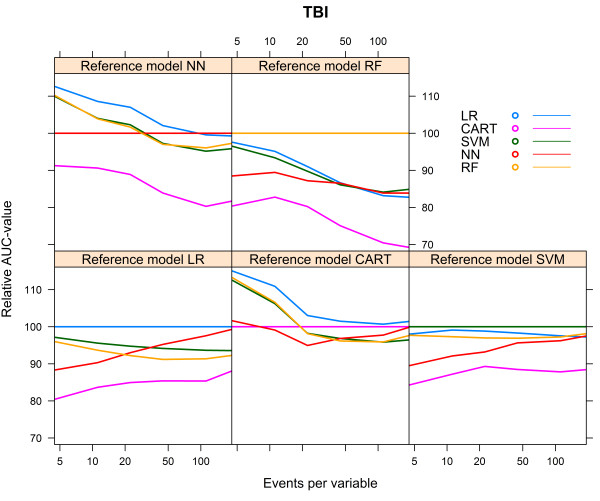
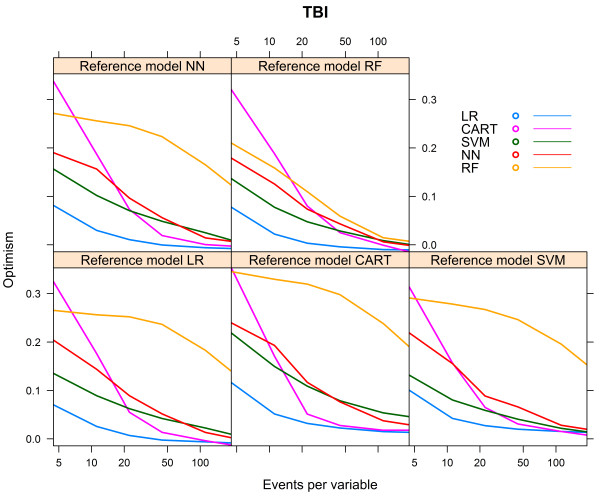
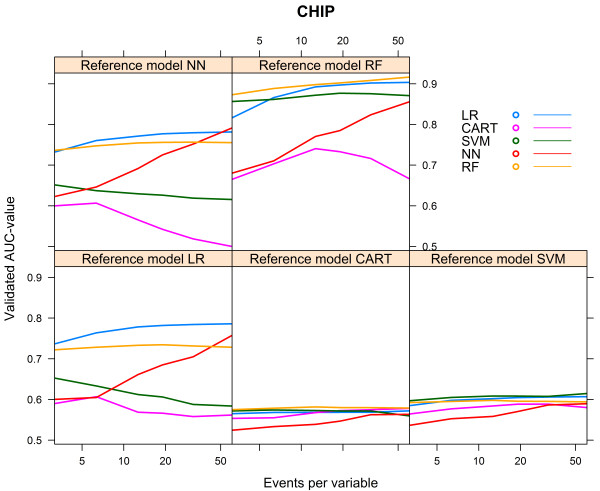
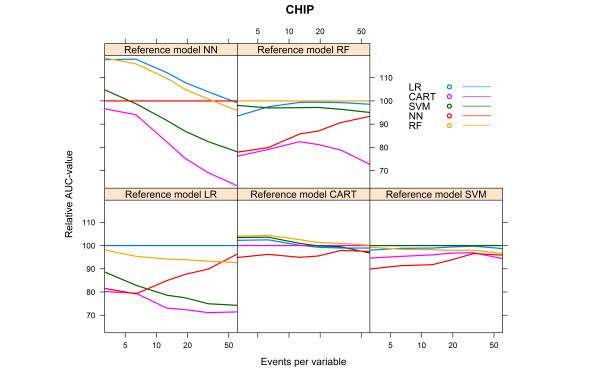
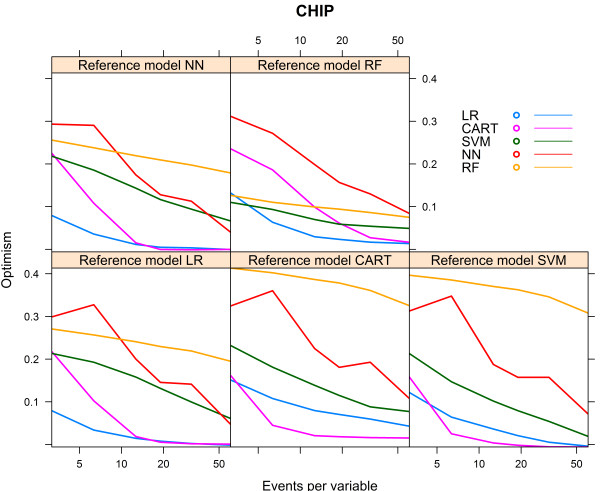
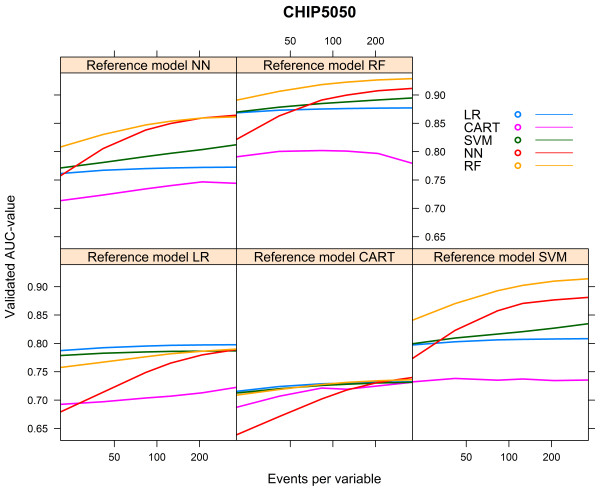
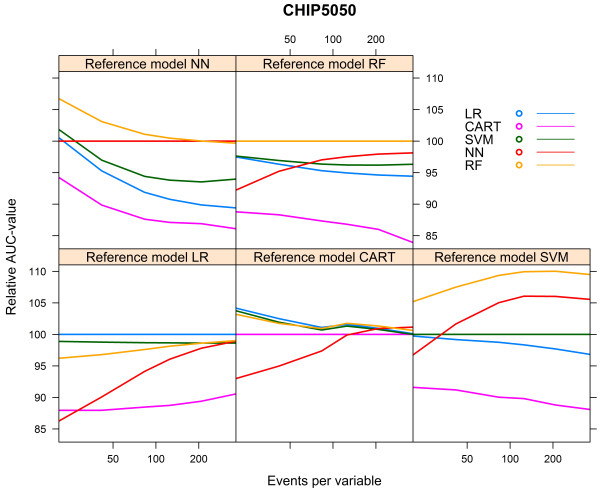
Verification
Claims the paper makes
The claims and statistics of this paper haven’t been checked yet.
Run the check — free, no account needed. It reads the open-access text and checks the sources it cites.
Claims other papers make about this one
Each is checked against this paper’s own text: does it say what the citing paper says it does?
In the citing paper
“The sample size must be several times larger if we want to use machine learning models.53”
From Developing clinical prediction models: a step-by-step guide (2024) · cites this paper as [53]
Self-check
Percentages, sums and reported differences re-computed from the paper’s own numbers.
The self-check needs the paper’s full text.
Citations
Cites
R: A Language and Environment for Statistical Computing
R Core Team (2000) · doi:10.32614/r.manuals · Cited by 355,893
Classification and Regression Trees.
Gordon, A. D., Breiman, L., Friedman, J. H., Olshen, R. A., & Stone, C. J. (1984) · Biometrics · doi:10.2307/2530946 · Cited by 23,867
Classification and Regression Trees.
Ryzin, J. V., Breiman, L., Friedman, J. H., Olshen, R. A., & Stone, C. J. (1986) · Journal of the American Statistical Association · doi:10.2307/2288003 · Cited by 21,030
A simulation study of the number of events per variable in logistic regression analysis
Peduzzi, P., Concato, J., Kemper, E., Holford, T. R., & Feinstein, A. R. (1996) · Journal of Clinical Epidemiology · doi:10.1016/s0895-4356(96)00236-3 · Cited by 9,655
Regression Modeling Strategies
Harrell, F. E. (2001) · Springer series in statistics · doi:10.1007/978-1-4757-3462-1 · Cited by 9,270
Clinical Prediction Models: A Practical Approach to Development, Validation, and Updating
Steyerberg, E. W. (2019) · Statistics for Biology and Health · doi:10.1007/978-3-030-16399-0 · Cited by 3,281
Self-citationInternal validation of predictive models
Steyerberg, E. W., Harrell, F. E., Borsboom, G. J. J. M., Eijkemans, M. J. C., Vergouwe, Y., & Habbema, J. D. F. (2001) · Journal of Clinical Epidemiology · doi:10.1016/s0895-4356(01)00341-9 · Cited by 2,746
Self-citationPrognosis Research Strategy (PROGRESS) 3: Prognostic Model Research
Steyerberg, E. W., Moons, K. G. M., van der Windt, D. A., Hayden, J. A., Perel, P., Schroter, S., Riley, R. D., Hemingway, H., Altman, D. G., & for the PROGRESS Group (2013) · PLoS Medicine · doi:10.1371/journal.pmed.1001381 · Cited by 1,508 · cited 1×
“The interest in the development, validation, and clinical application of clinical prediction models is increasing [1].”
BackgroundSelf-citationSteyerberg, E. W. (2009) · Statistics for Biology and Health · doi:10.1007/978-0-387-77244-8 · Cited by 1,491
Self-citationSteyerberg, E. W., Eijkemans, M. J. C., Harrell, F. E., & Habbema, J. D. F. (2000) · Statistics in Medicine · doi:10.1002/(sici)1097-0258(20000430)19:8 · Cited by 789
Self-citation
Research works printed but not linked: 1
- Kurahashi I: KsPlot: Check the power of seveal statistical models. 2011
Cited by
Sorted by citations
Items 801–809 of 809
Alavijeh, Z. S., & Borhani, M. (2026) · International Conference on Intelligent Systems and Artificial Intelligence Applications (ISAA) · doi:10.1109/isaa67392.2026.11726643
Machine learning to predict osteoradionecrosis in head and neck cancer
de Castro, V. T., Dalmazo, L. M. T., dos Reis, P. E. D., de Abreu, W. C., dos Reis, R. G., Prado-Ribeiro, A. C., Leite, A. F., Almeida, F. T., & Guerra, E. N. S. (2026) · Frontiers in Oncology · doi:10.3389/fonc.2026.1955800
Yohannes, E. T., Berhan, E., Mulugeta, A., & Kitaw, D. (2026) · SN Business & Economics · doi:10.1007/s43546-026-01519-5
Cui, P., Xu, S., Lin, X., Song, S., Huang, B., & Xu, Z. (2026) · Frontiers in Oncology · doi:10.3389/fonc.2026.1946352
Salı, M., Yi̇ği̇t, E., Ardıç, S. D., Sali, S., Çoşkun, A., Özçelik, E. E., Özmarasalı, B. E., Aktaş, A., Şahin, A. B., Çubukçu, E., et al. (2026) · Journal of Clinical Medicine · doi:10.3390/jcm15218262
Gültürk, E. A., & Güldoğan, E. (2026) · Konuralp Tıp Dergisi · doi:10.18521/ktd.1996338
Metadata
- Authors
- van der Ploeg, T., Austin, P. C., & Steyerberg, E. W.
- Affiliations
- University of Toronto (CA)
- Erasmus MC (NL)
- Venue
- BMC Medical Research Methodology
- Published
- 2014-12
- Volume
- 14
- Issue
- 1
- Pages
- 137-137
- ISSN
- 1471-2288 (ISSN-L)
- PMC
- PMC4289553
- OpenAlex
- W1602160603
- Cited by
- 809
- References
- 34
- Citations by year
- 2026: 118 · 2025: 107 · 2024: 91 · 2023: 117 · 2022: 114 · 2021: 107 · 2020: 59 · 2019: 39 · 2018: 30 · 2017: 13 · 2016: 8 · 2015: 6
- FWCI
- 9.51
- Type
- journal article
- Language
- en
- Open access
- gold
- doi.org
- Licence
- Locations
- BMC Medical Research Methodology (publishedVersion, cc-by)
- Europe PMC (PubMed Central) (publishedVersion, other-oa)
- PubMed Central (publishedVersion, cc-by)
- PubMed (publishedVersion)
- EUR Research Repository (Erasmus University Rotterdam) (publishedVersion)
- TSpace (University of Toronto) (submittedVersion)
- EUR Research Repository (Erasmus University Rotterdam) (submittedVersion)
- Topics
- Physical Sciences › Mathematics › Statistics and Probability › Statistical Methods in Epidemiology
- Health Sciences › Health Professions › Health Information Management › Artificial Intelligence in Healthcare
- Physical Sciences › Mathematics › Statistics and Probability › Statistical Methods and Inference
- Keywords
- effective sample size, predictive performance, binary outcome prediction, support vector machine, artificial neural networks, random forest, logistic regression, classification and regression trees, optimism, traumatic brain injury mortality, mild traumatic brain injury, CT abnormalities, model stability
- MeSH terms
- Brain Injuries, Data Interpretation, Statistical, Head and Neck Neoplasms, Humans, ROC Curve, Models, Statistical, Databases, Factual, Head Injuries, Closed, Treatment Outcome, Endpoint Determination, Support Vector Machine
About these checks
Registry, retraction, Cites and statistics results are computed, not judged, with one exception: a printed reference that no index lists is read once by a model before it counts as a citation error. Claims are extracted by a model and kept only when their quote appears verbatim in the text; each cited source is then checked, with a model’s help, for whether it says what the claim relies on. Those verdicts can be wrong — read the claim’s quote and the cited source before relying on one.
Statistics and arithmetic are recomputed, not judged.
Confidence bands are shown only for fields calibrated on our annotated test set. None is calibrated yet, so no band is shown.
What counts as a claim ›How we measure confidence ›How we check this ›
Are you an author, or do you see a problem with this page? Request a review
