

The DOI matches its Crossref record; 38 of the 39 references it cites were found in a registry or an index.
Would school closure for the 2009 H1N1 influenza epidemic have been worth the cost?: a computational simulation of Pennsylvania
Open accessAbstract
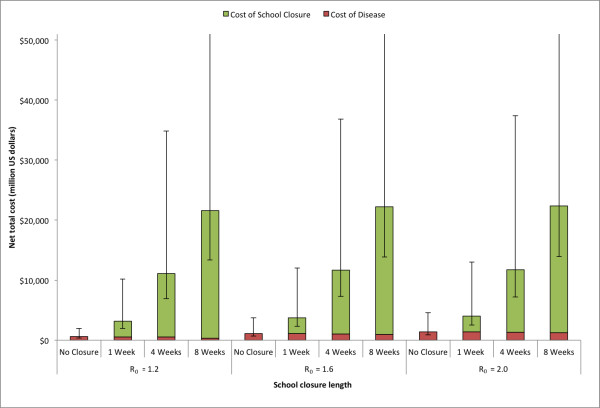
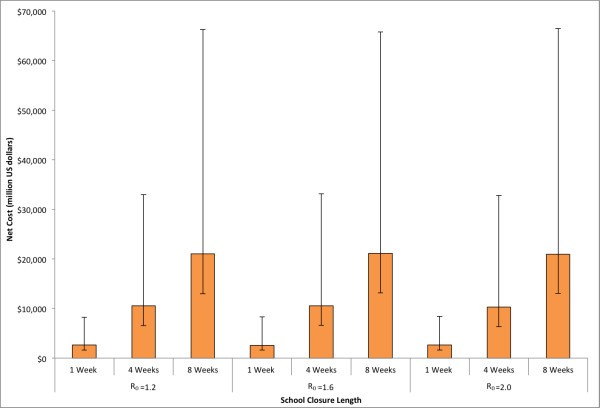
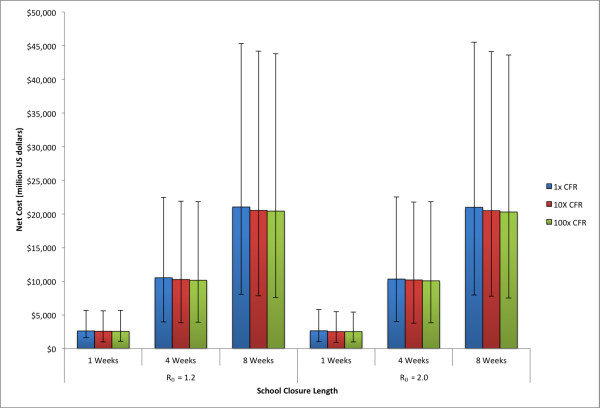
BACKGROUND: During the 2009 H1N1 influenza epidemic, policy makers debated over whether, when, and how long to close schools. While closing schools could have reduced influenza transmission thereby preventing cases, deaths, and health care costs, it may also have incurred substantial costs from increased childcare needs and lost productivity by teachers and other school employees. METHODS: A combination of agent-based and Monte Carlo economic simulation modeling was used to determine the cost-benefit of closing schools (vs. not closing schools) for different durations (range: 1 to 8 weeks) and symptomatic case incidence triggers (range: 1 to 30) for the state of Pennsylvania during the 2009 H1N1 epidemic. Different scenarios varied the basic reproductive rate (R(0)) from 1.2, 1.6, to 2.0 and used case-hospitalization and case-fatality rates from the 2009 epidemic. Additional analyses determined the cost per influenza case averted of implementing school closure. RESULTS: For all scenarios explored, closing schools resulted in substantially higher net costs than not closing schools. For R(0) = 1.2, 1.6, and 2.0 epidemics, closing schools for 8 weeks would have resulted in median net costs of $21.0 billion (95% Range: $8.0 - $45.3 billion). The median cost per influenza case averted would have been $14,185 ($5,423 - $30,565) for R(0) = 1.2, $25,253 ($9,501 - $53,461) for R(0) = 1.6, and $23,483 ($8,870 - $50,926) for R(0) = 2.0. CONCLUSIONS: Our study suggests that closing schools during the 2009 H1N1 epidemic could have resulted in substantial costs to society as the potential costs of lost productivity and childcare could have far outweighed the cost savings in preventing influenza cases.
Overview
The claims and statistics of this paper haven’t been checked yet.
Run the check — free, no account needed. It reads the open-access text and checks the sources it cites.
Integrity signals
Registry
Cites
Statistics
Figures
Verification
Claims the paper makes
The claims and statistics of this paper haven’t been checked yet.
Run the check — free, no account needed. It reads the open-access text and checks the sources it cites.
Claims other papers make about this one
Each is checked against this paper’s own text: does it say what the citing paper says it does?
The source backs part of the claim, not all of it — or backs it for a different population, condition or comparison.
In the citing paper
“they decrease the workforce in health care and other important capacities by prompting more parents to stay home with children”
From Precaution and proportionality in pandemic politics: democracy, state capacity, and COVID-19-related school closures around the world (2022) · cites this paper as Brown et al. 2011
Experimental — accuracy not yet measuredThe source backs part of the claim, not all of it — or backs it for a different population, condition or comparison.
In the citing paper
“are likely to have detrimental effects on student performance and well-being (e.g. Brown et al. 2011; CDC 2020).”
From Precaution and proportionality in pandemic politics: democracy, state capacity, and COVID-19-related school closures around the world (2022) · cites this paper as Brown et al. 2011
Experimental — accuracy not yet measured
Self-check
Percentages, sums and reported differences re-computed from the paper’s own numbers.
The self-check needs the paper’s full text.
Citations
Cites
Pandemic Potential of a Strain of Influenza A (H1N1): Early Findings
Fraser, C., Donnelly, C. A., Cauchemez, S., Hanage, W. P., Kerkhove, M. D. V., Hollingsworth, T. D., Griffin, J. T., Baggaley, R. F., Jenkins, H. E., Lyons, E., et al. (2009) · Science · doi:10.1126/science.1176062 · Cited by 1,915
Strategies for containing an emerging influenza pandemic in Southeast Asia
Ferguson, N. M., Cummings, D. A. T., Cauchemez, S., Fraser, C., Riley, S., Meeyai, A. C., Iamsirithaworn, S., & Burke, D. S. (2005) · Nature · doi:10.1038/nature04017 · Cited by 1,820
Self-citationThe annual impact of seasonal influenza in the US: Measuring disease burden and costs
Molinari, N., Ortega‐Sanchez, I. R., Messonnier, M. L., Thompson, W., WORTLEY, P. M., Weintraub, E., & Bridges, C. B. (2007) · Vaccine · doi:10.1016/j.vaccine.2007.03.046 · Cited by 1,722
Containing Pandemic Influenza at the Source
Longini, I. M., Nizam, A., Xu, S., Ungchusak, K., Hanshaoworakul, W., Cummings, D. A. T., & Halloran, M. E. (2005) · Science · doi:10.1126/science.1115717 · Cited by 1,177
Robinson, R. (1993) · BMJ · doi:10.1136/bmj.307.6907.793 · Cited by 819
Estimating the impact of school closure on influenza transmission from Sentinel data
Cauchemez, S., Valleron, A., Boëlle, P., Flahault, A., & Ferguson, N. M. (2008) · Nature · doi:10.1038/nature06732 · Cited by 688
Modeling targeted layered containment of an influenza pandemic in the United States
Halloran, M. E., Ferguson, N. M., Eubank, S., Longini, I. M., Cummings, D. A. T., Lewis, B. L., Xu, S., Fraser, C., Vullikanti, A. K. S., Germann, T. C., et al. (2008) · Proceedings of the National Academy of Sciences · doi:10.1073/pnas.0706849105 · Cited by 660
Self-citationThe Transmissibility and Control of Pandemic Influenza A (H1N1) Virus
Yang, Y., Sugimoto, J. D., Halloran, M. E., Basta, N. E., Chao, D. L., Matrajt, L., Potter, G. E., Kenah, E., & Longini, I. M. (2009) · Science · doi:10.1126/science.1177373 · Cited by 565
Closure of schools during an influenza pandemic
Cauchemez, S., Ferguson, N. M., Wachtel, C., Tegnell, A., Saour, G., Duncan, B., & Nicoll, A. (2009) · The Lancet Infectious Diseases · doi:10.1016/s1473-3099(09)70176-8 · Cited by 547
Targeted Social Distancing Designs for Pandemic Influenza
Glass, R. J., Glass, L. M., Beyeler, W., & Min, H. J. (2006) · Emerging infectious diseases · doi:10.3201/eid1211.060255 · Cited by 526
Research works printed but not linked: 3
- Centers for Disease Control and Prevention: Interim Pre-Pandemic planning Guidance: Community Strategy for Pandemic Influenza Mitigation in the United States. Volume 2010. 2009
- American Medical Association: Socioeconomics of Medical Practice. Volume 69. Edited by: Gonzales M. Chicago, Il. 1997, American Medical Association, 107-
- Centers for Medicare and Services: In Services USDoHH, ed. 2009
Cited by
Sorted by citations
Viner, R. M., Russell, S. J., Croker, H., Packer, J., Ward, J., Stansfield, C., Mytton, O., Bonell, C., & Booy, R. (2020) · The Lancet Child & Adolescent Health · doi:10.1016/s2352-4642(20)30095-x · Cited by 2,213
The scaling of contact rates with population density for the infectious disease models
Hu, H., Nigmatulina, K. R., & Eckhoff, P. A. (2013) · Mathematical Biosciences · doi:10.1016/j.mbs.2013.04.013 · Cited by 252
Mitigation of infectious disease at school: targeted class closure vs school closure
Gemmetto, V., Barrat, A., & Cattuto, C. (2014) · BMC Infectious Diseases · doi:10.1186/s12879-014-0695-9 · Cited by 244
Grefenstette, J. J., Brown, S. T., Rosenfeld, R., DePasse, J. V., Stone, N. T., Cooley, P. C., Wheaton, W. D., Fyshe, A., Galloway, D. D., Sriram, A., et al. (2013) · BMC Public Health · doi:10.1186/1471-2458-13-940 · Cited by 241
Self-citationLee, B. Y., Bartsch, S. M., Mui, Y., Haidari, L. A., Spiker, M. L., & Gittelsohn, J. (2016) · Nutrition Reviews · doi:10.1093/nutrit/nuw049 · Cited by 195
Self-citation
Metadata
- Authors
- Brown, S. T., Tai, J. H., Bailey, R. R., Cooley, P. C., Wheaton, W. D., Potter, M. A., Voorhees, R. E., LeJeune, M., Grefenstette, J. J., Burke, D. S., McGlone, S. M., & Lee, B. Y.
- Affiliations
- University of Pittsburgh (US)
- RTI International (US)
- Corresponding author
- Brown, Shawn T
- Venue
- BMC Public Health
- Published
- 2011-05-20
- Volume
- 11
- Issue
- 1
- Pages
- 353-353
- ISSN
- 1471-2458 (ISSN-L)
- PMC
- PMC3119163
- OpenAlex
- W1994172949
- Cited by
- 111
- References
- 39
- Citations by year
- 2026: 1 · 2025: 2 · 2024: 3 · 2023: 5 · 2022: 6 · 2021: 11 · 2020: 11 · 2019: 4 · 2018: 5 · 2017: 3 · 2016: 9 · 2015: 8 · 2014: 15 · 2013: 14 · 2012: 13
- FWCI
- 10.36
- Type
- journal article
- Language
- en
- Open access
- gold
- doi.org
- Licence
- Locations
- BMC Public Health (publishedVersion, cc-by)
- PubMed Central (publishedVersion, cc-by)
- PubMed (publishedVersion)
- D-Scholarship@Pitt (University of Pittsburgh) (acceptedVersion)
- DOAJ (DOAJ: Directory of Open Access Journals) (submittedVersion, cc-by-sa)
- Funders
- Johns Hopkins University
- National Institutes of Health (5u54gm088491-10)
- Centers for Disease Control and Prevention (1P01TP000304-03)
- National Institute of General Medical Sciences (1U54GM088491-01-09)
- U.S. National Library of Medicine (R01LM009132)
- Topics
- Health Sciences › Medicine › Epidemiology › Influenza Virus Research Studies
- Social Sciences › Economics, Econometrics and Finance › Economics and Econometrics › Health Systems, Economic Evaluations, Quality of Life
- Physical Sciences › Mathematics › Applied Mathematics › Mathematical and Theoretical Epidemiology and Ecology Models
- Keywords
- school closures, 2009 H1N1 influenza, pandemic influenza, cost-benefit analysis, basic reproduction number, productivity loss, childcare costs, influenza transmission, Pennsylvania
- MeSH terms
- Adolescent, Adult, Aged, Child, Child, Preschool, Disease Outbreaks, Humans, Infant, Influenza, Human, Middle Aged, Monte Carlo Method, Pennsylvania, Schools, Models, Statistical, Models, Econometric, Influenza A Virus, H1N1 Subtype, Young Adult
About these checks
Registry, retraction, Cites and statistics results are computed, not judged, with one exception: a printed reference that no index lists is read once by a model before it counts as a citation error. Claims are extracted by a model and kept only when their quote appears verbatim in the text; each cited source is then checked, with a model’s help, for whether it says what the claim relies on. Those verdicts can be wrong — read the claim’s quote and the cited source before relying on one.
Statistics and arithmetic are recomputed, not judged.
Confidence bands are shown only for fields calibrated on our annotated test set. None is calibrated yet, so no band is shown.
What counts as a claim ›How we measure confidence ›How we check this ›
Are you an author, or do you see a problem with this page? Request a review
