

The DOI matches its Crossref record; 50 of the 50 references it cites were found in a registry or an index.
Substitution of physicians by nurses in primary care: a systematic review and meta-analysis
Open accessAbstract
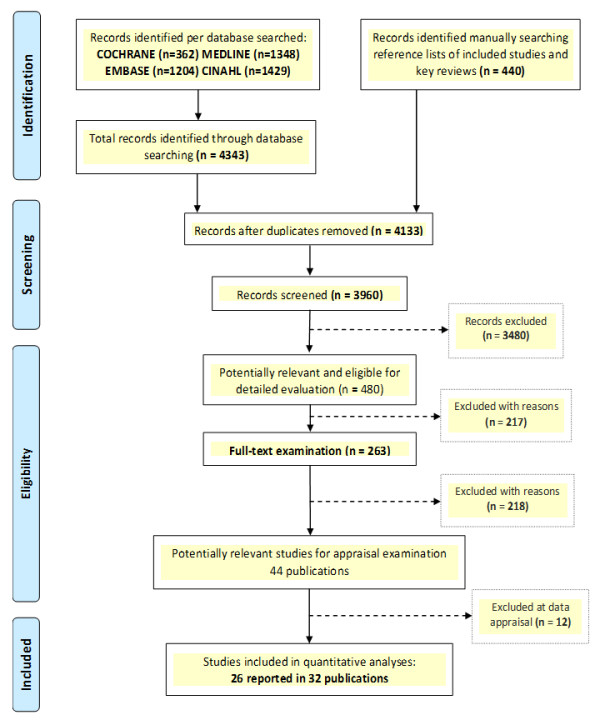
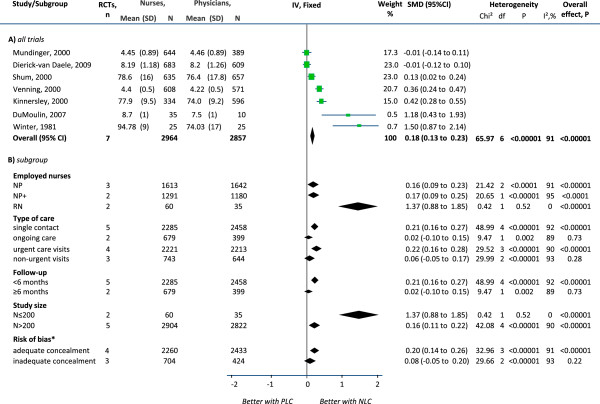
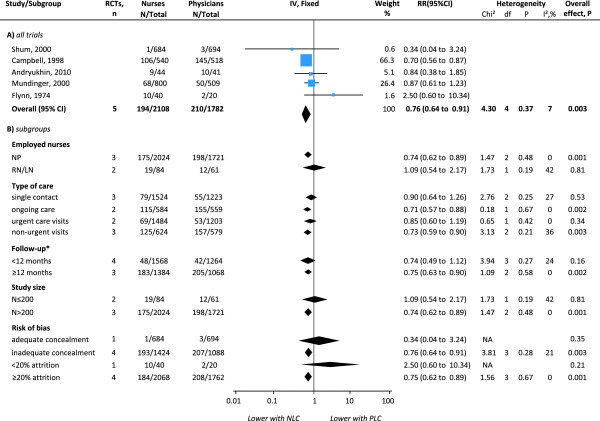
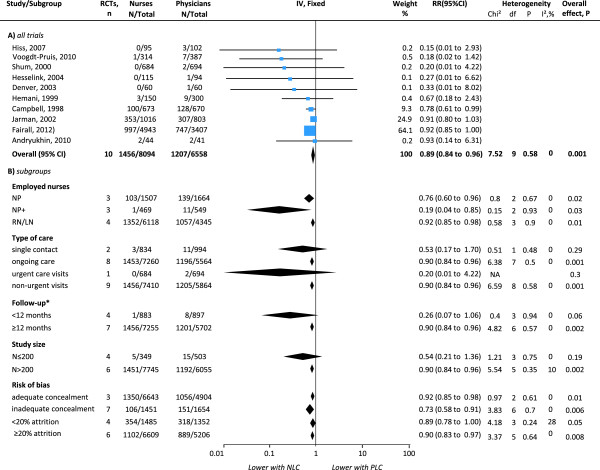
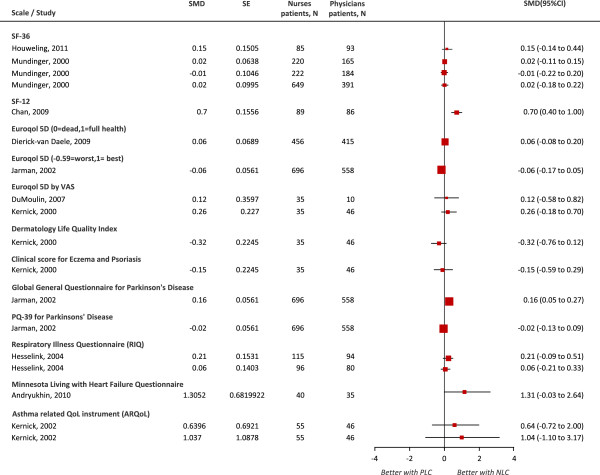
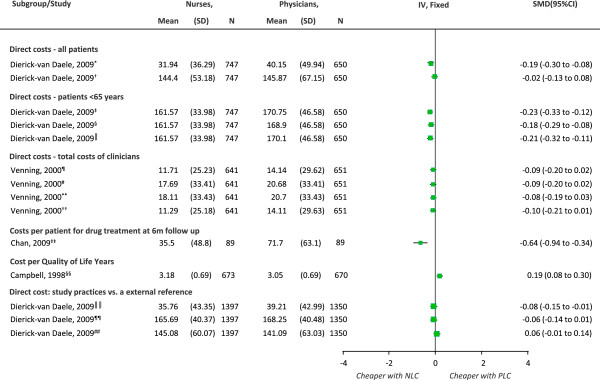
Background: In many countries, substitution of physicians by nurses has become common due to the shortage of physicians and the need for high-quality, affordable care, especially for chronic and multi-morbid patients. We examined the evidence on the clinical effectiveness and care costs of physician-nurse substitution in primary care. Methods: We systematically searched OVID Medline and Embase, The Cochrane Library and CINAHL, up to August 2012; selected and critically appraised published randomised controlled trials (RCTs) that compared nurse-led care with care by primary care physicians on patient satisfaction, Quality of Life (QoL), hospital admission, mortality and costs of healthcare. We assessed the individual study risk of bias, calculated the study-specific and pooled relative risks (RR) or standardised mean differences (SMD); and performed fixed-effects meta-analyses. Results: 24 RCTs (38,974 participants) and 2 economic studies met the inclusion criteria. Pooled analyses showed higher overall scores of patient satisfaction with nurse-led care (SMD 0.18, 95% CI 0.13 to 0.23), in RCTs of single contact or urgent care, short (less than 6 months) follow-up episodes and in small trials (N ≤ 200). Nurse-led care was effective at reducing the overall risk of hospital admission (RR 0.76, 95% CI 0.64 to 0.91), mortality (RR 0.89, 95% CI 0.84 to 0.96), in RCTs of on-going or non-urgent care, longer (at least 12 months) follow-up episodes and in larger (N > 200) RCTs. Higher quality RCTs (with better allocation concealment and less attrition) showed higher rates of hospital admissions and mortality with nurse-led care albeit less or not significant. The results seemed more consistent across nurse practitioners than with registered or licensed nurses. The effects of nurse-led care on QoL and costs were difficult to interpret due to heterogeneous outcome reporting, valuation of resources and the small number of studies. Conclusions: The available evidence continues to be limited by the quality of the research considered. Nurse-led care seems to have a positive effect on patient satisfaction, hospital admission and mortality. This important finding should be confirmed and the determinants of this effect should be assessed in further, larger and more methodically rigorous research.
Overview
The claims and statistics of this paper haven’t been checked yet.
Run the check — free, no account needed. It reads the open-access text and checks the sources it cites.
Integrity signals
Registry
Cites
Statistics
Figures
Verification
Claims the paper makes
The claims and statistics of this paper haven’t been checked yet.
Run the check — free, no account needed. It reads the open-access text and checks the sources it cites.
Claims other papers make about this one
Each is checked against this paper’s own text: does it say what the citing paper says it does?
The source backs part of the claim, not all of it — or backs it for a different population, condition or comparison.
In the citing paper
“Many studies with strong research designs have shown nursing-intensive primary care models to be safe and effective.8,11,18-26”
From Evaluating the cost of NP-led vs. GP-led primary care in British Columbia (2024) · cites this paper as [21]
Experimental — accuracy not yet measured
Self-check
Percentages, sums and reported differences re-computed from the paper’s own numbers.
The self-check needs the paper’s full text.
Citations
Cites
Quantifying heterogeneity in a meta‐analysis
Higgins, J. P. T., & Thompson, S. G. (2002) · Statistics in Medicine · doi:10.1002/sim.1186 · Cited by 36,763
The Cochrane Collaboration's tool for assessing risk of bias in randomised trials
Higgins, J. P. T., Altman, D. G., Gotzsche, P. C., Juni, P., Moher, D., Oxman, A. D., Savovic, J., Schulz, K. F., Weeks, L., Sterne, J. A. C., et al. (2011) · BMJ · doi:10.1136/bmj.d5928 · Cited by 33,817
Liberati, A., Altman, D. G., Tetzlaff, J., Mulrow, C., Gøtzsche, P. C., Ioannidis, J. P. A., Clarke, M., Devereaux, P. J., Kleijnen, J., & Moher, D. (2009) · PLoS Medicine · doi:10.1371/journal.pmed.1000100 · Cited by 28,164
Dermyshi, E., Wang, Y., Yan, C., Hong, W., Qiu, G., Gong, X., & Zhang, T. (2017) · Neonatology · doi:10.1159/000454668 · Cited by 24,586
Sterne, J. A. C., Sutton, A. J., Ioannidis, J. P. A., Terrin, N., Jones, D. R., Lau, J., Carpenter, J., Rucker, G., Harbord, R. M., Schmid, C. H., et al. (2011) · BMJ · doi:10.1136/bmj.d4002 · Cited by 7,709
Cochrane Handbook for Systematic Reviews of Interventions Version 5.0.1. The Cochrane Collaboration
Higgins, J., Green, S. R., & Higgins, J. (2008) · Cited by 5,544
Assessing the quality of controlled clinical trials
Jüni, P., Altman, D. G., & Egger, M. (2001) · BMJ · doi:10.1136/bmj.323.7303.42 · Cited by 3,309 · cited 3×
“We assessed the risk of bias of all trials without the calculation of a composite score following available guidelines [6-8].”
BackgroundMethodThe Hazards of Scoring the Quality of Clinical Trials for Meta-analysis
Jüni, P. (1999) · JAMA · doi:10.1001/jama.282.11.1054 · Cited by 1,981
Horrocks, S., Anderson, E., & Salisbury, C. (2002) · BMJ · doi:10.1136/bmj.324.7341.819 · Cited by 1,235
Substitution of doctors by nurses in primary care
Laurant, M. G. H., Reeves, D., Hermens, R., Braspenning, J., Grol, R. P. T. M., & Sibbald, B. (2005) · Cochrane Database of Systematic Reviews · doi:10.1002/14651858.cd001271.pub2 · Cited by 961
Research works printed but not linked: 3
- World Health Organization: World Health Statistics 2012: Indicator Compendium. 2012, Geneva, Switzerland: WHO
- Review Manager: (RevMan) [Computer program] Version 5.2.4 for Windows edition. 2012, Copenhagen: The Nordic Cochrane Centre, The Cochrane Collaboration, http://tech.cochrane.org/revman.
- Winter C: Quality health care: patient assessment. 1981, MSc Thesis: California State University
Cited by
Sorted by citations
Items 101–200 of 308
Chmiel, C., Giewer, I., Frei, A. L., & Rosemann, T. J. (2017) · Swiss Medical Weekly · doi:10.4414/smw.2017.14522 · Cited by 22
Self-citationThe Acceptability of Task-Shifting from Doctors to Allied Health Professionals
Jedro, C., Holmberg, C., Tille, F., Widmann, J., Schneider, A., Stumm, J., Döpfmer, S., Kuhlmey, A., & Schnitzer, S. (2020) · Deutsches Ärzteblatt international · doi:10.3238/arztebl.2020.0583 · Cited by 22
Amin, A., Dutta, M., Mohan, S. B., & Mohan, P. (2020) · Frontiers in Public Health · doi:10.3389/fpubh.2020.583821 · Cited by 21
A systematic review of pre-service training on vaccination and immunization
Tchoualeu, D. D., Fleming, M. K., & Traicoff, D. A. (2023) · Vaccine · doi:10.1016/j.vaccine.2023.03.062 · Cited by 21
Benjamins, J., Damen, M. L. W., & van Stel, H. F. (2015) · PLoS ONE · doi:10.1371/journal.pone.0139187 · Cited by 21
Agarwal, A., Zhang, W., Kuo, Y., & Sharma, G. (2016) · PLoS ONE · doi:10.1371/journal.pone.0148522 · Cited by 21
Directing Improvements in Primary Care Patient Experience through Analysis of Service Quality
Smith, M. H., & Smith, D. A. (2018) · Health Services Research · doi:10.1111/1475-6773.12985 · Cited by 21
Lauber, E., Kindlimann, A., Nicca, D., Arb, R. A.-V., Sgier, C., Staudacher, S., Schramm, M. S., Vökt, F., & Zúñiga, F. (2022) · Swiss Medical Weekly · doi:10.4414/smw.2022.w30199 · Cited by 23
Adams, S., & Carryer, J. (2020) · Policy Politics & Nursing Practice · doi:10.1177/1527154420965534 · Cited by 20
Mafi, J. N., Chen, A., Guo, R., Choi, K. R., Smulowitz, P. B., Tseng, C., Ladapo, J. A., & Landon, B. E. (2022) · BMJ Open · doi:10.1136/bmjopen-2021-055138 · Cited by 20
Ein evidenzbasiertes Gesundheitssystem: die Rolle der Gesundheitsfachberufe
Meyer, G. (2015) · Zeitschrift für Evidenz Fortbildung und Qualität im Gesundheitswesen · doi:10.1016/j.zefq.2015.07.014 · Cited by 20
Adams, S., Mustafa, M., Bareham, C. A., Carryer, J., Tenbensel, T., & Poghosyan, L. (2022) · The Journal for Nurse Practitioners · doi:10.1016/j.nurpra.2022.04.024 · Cited by 19
Ladd, E., Sweeney, C. F., GUARINO, A. J., & Hoyt, A. (2017) · Medical Care Research and Review · doi:10.1177/1077558717725604 · Cited by 19
Baron, A. M., Ridgeway, J. L., Stirn, S. L., Morris, M. A., Branda, M. E., Inselman, J., Finnie, D. M., & Baker, C. A. (2017) · AJN American Journal of Nursing · doi:10.1097/01.naj.0000529715.93343.b0 · Cited by 19
Schwingrouber, J., Loschi, A., Gentile, S., & Colson, S. (2021) · Recherche en soins infirmiers · doi:10.3917/rsi.145.0104 · Cited by 19
Pilvar, H., & Watt, T. (2024) · The European Journal of Health Economics · doi:10.1007/s10198-024-01742-7 · Cited by 18
Turner, A., Mulla, A., Booth, A., Aldridge, S., Stevens, S., Begum, M., & Malik, A. (2018) · Health Services and Delivery Research · doi:10.3310/hsdr06250 · Cited by 18
Franco, C. M., Bula, D. A., Toso, B. R. G. D. O., Giovanella, L., & Hämel, K. (2025) · BMC Nursing · doi:10.1186/s12912-025-02885-5 · Cited by 17
Regional variation of potentially avoidable hospitalisations in Switzerland: an observational study
Gygli, N., Zúñiga, F., & Simon, M. (2021) · BMC Health Services Research · doi:10.1186/s12913-021-06876-5 · Cited by 17
Hutchinson, J., Lau, Y., Sutton, M., & Checkland, K. (2023) · British Journal of General Practice · doi:10.3399/bjgp.2023.0007 · Cited by 17
Improving access to school health services as perceived by school professionals
Bezem, J., Heinen, D., Reis, R., Buitendijk, S. E., Numans, M. E., & Kocken, P. (2017) · BMC Health Services Research · doi:10.1186/s12913-017-2711-4 · Cited by 17
Lyndon, H., Latour, J. M., Marsden, J. F., & Kent, B. (2021) · Journal of Advanced Nursing · doi:10.1111/jan.15066 · Cited by 16
Li, Y., Chen, M., Lin, R., & Li, H. (2021) · Journal of Multidisciplinary Healthcare · doi:10.2147/jmdh.s343622 · Cited by 16
Dostanova, Z. A., Yermukhanova, L. S., Blaževičienė, A., Baigozhina, Z., Taushanova, M., Абдикадирова, И. Т., & Sultanova, G. (2024) · Healthcare · doi:10.3390/healthcare12151461 · Cited by 16
Walker, A., Williams, R., Sibley, F., Stamp, D., Carter, A., & Hurley, M. (2017) · Musculoskeletal Care · doi:10.1002/msc.1189 · Cited by 16
Smits, M., Peters, Y., Ranke, S., Plat, E., Laurant, M. G. H., & Giesen, P. H. J. (2019) · International Journal of Nursing Studies · doi:10.1016/j.ijnurstu.2019.103445 · Cited by 16
Introducing Nurse Practitioners Into Norwegian Primary Healthcare—Experiences and Learning
Hansen, E. H., Boman, E., Bing‐Jonsson, P. C., & Fagerström, L. (2020) · Research and theory for nursing practice · doi:10.1891/1541-6577.34.1.21 · Cited by 16
Parent Satisfaction With Pediatric Nurse Practitioner Care in Specialty Services
Thibodeau, B. A. M., Southon, S. H., Beaudoin, W., Jurasek, L., Perry, S., Dorfman, T., Issel, J., Johnston, K., & Olmstead, D. (2022) · Journal of Pediatric Health Care · doi:10.1016/j.pedhc.2022.04.004 · Cited by 15
Effect of community‐based nurse‐led support intervention in the reduction of HbA1c levels
Li, J., Yang, F., Wang, J., & Tao, Y. (2022) · Public Health Nursing · doi:10.1111/phn.13119 · Cited by 15
Formalisation and subordination: a contingency theory approach to optimising primary care teams
Contandriopoulos, D., Perroux, M., & Duhoux, A. (2018) · BMJ Open · doi:10.1136/bmjopen-2018-025007 · Cited by 15
Desarrollo competencial de las enfermeras en el sistema sanitario público de Andalucía
Robles, N. L., Fernández‐Salazar, S., Rodríguez‐Gómez, S., Casado-Mora, M. I., Morales‐Asencio, J. M., & Ramos‐Morcillo, A. J. (2019) · Enfermería Clínica · doi:10.1016/j.enfcli.2018.12.013 · Cited by 15
Casey, M., O’Connor, L., Rohde, D., Twomey, L., Cullen, W., & Carroll, Á. M. (2022) · Health Science Reports · doi:10.1002/hsr2.555 · Cited by 15
Meta-synthesis on nurse practitioner autonomy and roles in ambulatory care
Wang-Romjue, P. B. (2017) · Nursing Forum · doi:10.1111/nuf.12236 · Cited by 15
Lake, J. D., Barnsley, J. M., Lofters, A., & Austin, Z. (2024) · Research in Social and Administrative Pharmacy · doi:10.1016/j.sapharm.2024.04.016 · Cited by 15
Boman, E., Duvaland, E., Gaarde, K., Leary, A., Rauhala, A., & Fagerström, L. (2021) · International Journal of Nursing Studies · doi:10.1016/j.ijnurstu.2021.103910 · Cited by 14
Mustafa, M., Adams, S., Bareham, C. A., & Carryer, J. (2021) · Journal of Primary Health Care · doi:10.1071/hc21036 · Cited by 14
Newham, R., Weir, N., Ferguson, A., & Bennie, M. (2022) · Research in Social and Administrative Pharmacy · doi:10.1016/j.sapharm.2022.11.003 · Cited by 14
Senay, A., Delisle, J., Raynauld, J., Morin, S. N., & Fernandes, J. (2015) · Osteoporosis International · doi:10.1007/s00198-015-3413-6 · Cited by 15
Adang, E., Gerritsma, A., Nouwens, E., van Lieshout, J., & Wensing, M. (2015) · Implementation Science · doi:10.1186/s13012-016-0434-2 · Cited by 14
Self-citationChristoffels, R., & Mash, R. J. (2018) · BMC Family Practice · doi:10.1186/s12875-018-0802-x · Cited by 14
Spichiger, E., Shaha, M., Schubert, M., & Herrmann, L. (2018) · Pflege · doi:10.1024/1012-5302/a000594 · Cited by 14
Moran, V., Suhrcke, M., & Nolte, E. (2023) · BMC Health Services Research · doi:10.1186/s12913-023-10369-y · Cited by 13
Bomholt, K. B., Nebsbjerg, M. A., Burau, V., Mygind, A., Christensen, M. B., & Huibers, L. (2024) · European Journal of General Practice · doi:10.1080/13814788.2024.2351807 · Cited by 13
Laurence, C., & Karnon, J. D. (2017) · Human Resources for Health · doi:10.1186/s12960-017-0216-1 · Cited by 13
Wang, H., Gregg, A., Qiu, F., Kim, J., Chen, B., Wan, N., Su, D., Michaud, T. L., & Chen, L. (2017) · Journal of Community Health · doi:10.1007/s10900-017-0412-x · Cited by 13
Bezze, E. N., Morniroli, D., Farneti, M., Sannino, P., Marinello, R., Bettinelli, M. E., Santini, G., Plevani, L., Marchisio, P., Mosca, F., et al. (2020) · Journal of Pediatric Nursing · doi:10.1016/j.pedn.2020.09.007 · Cited by 13
Experiences of out-of-hours task-shifting from GPs: a systematic review of qualitative studies
Lyness, E., Parker, J., Willcox, M. L., & Dambha‐Miller, H. (2021) · BJGP Open · doi:10.3399/bjgpo.2021.0043 · Cited by 13
van den Hombergh, P., van Doorn-Klomberg, A. L., Campbell, S., Wensing, M., & Braspenning, J. C. C. (2016) · BMC Family Practice · doi:10.1186/s12875-016-0519-7 · Cited by 13
Self-citationvan der Biezen, M., Wensing, M., van der Burgt, R., & Laurant, M. G. H. (2017) · BMJ Open · doi:10.1136/bmjopen-2016-015509 · Cited by 13
Self-citationVerberne, D. P. J., van Mastrigt, G. A. P. G., Ponds, R., Heugten, C. M. V., & Kroese, M. (2021) · BMJ Open · doi:10.1136/bmjopen-2020-039201 · Cited by 13
Komene, E., Davis, J., Davis, R., O'Dwyer, R., Pou, K. T., Dick, C., Sami, L., Wiapo, C., & Adams, S. (2024) · Journal of Advanced Nursing · doi:10.1111/jan.16334 · Cited by 12
Comparative Cost of Early Infant Male Circumcision by Nurse-Midwives and Doctors in Zimbabwe
Mangenah, C., Mavhu, W. M., Hatzold, K., Biddle, A. K., Ncube, G., Mugurungi, O. M., Ticklay, I., Cowan, F. M., & Thirumurthy, H. (2016) · Global Health Science and Practice · doi:10.9745/ghsp-d-15-00201 · Cited by 12
Martsolf, G. R., Auerbach, D. I., & Arifkhanova, A. (2015) · Cited by 12
A legal framework on advanced practice nursing in Belgium: what do we and don’t we know?
Hecke, A. V., Bogaert, P. V., Decoene, E., Dobbels, F., Goossens, E., Goossens, G. A., Verhaeghe, S. T. L., & Goffin, T. (2020) · Acta Clinica Belgica · doi:10.1080/17843286.2020.1795575 · Cited by 11
Outcomes of Hematuria Evaluation by Advanced Practice Providers and Urologists
Hyman, M. J., Skolarus, T. A., Litwack, K., Meltzer, D. O., & Modi, P. K. (2023) · Urology · doi:10.1016/j.urology.2023.03.049 · Cited by 11
Sawaengdee, K., Kantamaturapoj, K., Seneerattanaprayul, P., Putthasri, W., & Suphanchaimat, R. (2016) · Advances in Medical Education and Practice · doi:10.2147/amep.s111026 · Cited by 11
Rim, S. H., Hall, I. J., Massetti, G. M., Thomas, C. C., Li, J., & Richardson, L. C. (2018) · Journal of Cancer Education · doi:10.1007/s13187-018-1353-5 · Cited by 11
Patient Satisfaction with Physicians and Nurse Practitioners in Multiple Sclerosis Centers
Thotam, S., & Buhse, M. (2019) · International Journal of MS Care · doi:10.7224/1537-2073.2018-042 · Cited by 11
Interprofessional Teams: Lessons Learned From a Nurse-Led Clinic
Schentrup, D. M., Black, E. W., Blue, A. V., & Whalen, K. (2019) · The Journal for Nurse Practitioners · doi:10.1016/j.nurpra.2019.02.016 · Cited by 11
Adams, S., Oster, S., & Davis, J. (2022) · Nursing Praxis in Aotearoa New Zealand · doi:10.36951/27034542.2022.01 · Cited by 10
You, W., Cusack, L., & Donnelly, F. (2023) · Scientific Reports · doi:10.1038/s41598-023-38945-6 · Cited by 10
Abrams, R., Jones, B., Campbell, J., de Lusignan, S., Peckham, S., & Gage, H. (2023) · BJGP Open · doi:10.3399/bjgpo.2023.0111 · Cited by 10
Productivity in the NHS: why it matters and what to do next
Dixon, J., Street, A., & Allwood, D. (2018) · BMJ · doi:10.1136/bmj.k4301 · Cited by 10
Ewertowski, H., Hesse, A., Schneider, N., & Stiel, S. (2019) · Zeitschrift für Evidenz Fortbildung und Qualität im Gesundheitswesen · doi:10.1016/j.zefq.2019.12.003 · Cited by 10
Constantine, L., Wang, K., Funk, D. C., Speis, A., & Moss, A. H. (2020) · Journal of Palliative Medicine · doi:10.1089/jpm.2020.0515 · Cited by 10
Baygozhina, Z., Koikov, V., Umbetzhanova, A., & Bekbergenova, Z. (2020) · Journal of Health Development · doi:10.32921/2225-9929-2020-36-69-83 · Cited by 9
Health care use in response to health shocks: Does socio‐economic status matter?
Fiebig, D. G., Gool, K. V., Hall, J. P., & Mu, C. (2021) · Health Economics · doi:10.1002/hec.4427 · Cited by 9
Experiences of an interprofessional follow-up program in primary care practice
Kolltveit, B. H., Oftedal, B. F., Thorne, S. E., Lomborg, K. E., & Graue, M. (2024) · BMC Health Services Research · doi:10.1186/s12913-024-10706-9 · Cited by 8
Competential development of nurses in the public health system of Andalucía
Robles, N. L., Fernández‐Salazar, S., Rodríguez‐Gómez, S., Casado-Mora, M. I., Morales‐Asencio, J. M., & Ramos‐Morcillo, A. J. (2019) · Enfermería Clínica (English Edition) · doi:10.1016/j.enfcle.2018.12.004 · Cited by 8
Clinicians' psychological empowerment to engage in management as part of their daily work
Andersson, T., Eriksson, N., & Müllern, T. (2022) · Journal of Health Organization and Management · doi:10.1108/jhom-08-2021-0300 · Cited by 8
Clinical profile and care pathways among unaccompanied minor asylum seekers in Vaud, Switzerland
Genton, P. C., Wang, J., Bodenmann, P., & Ambresin, A. (2019) · International Journal of Adolescent Medicine and Health · doi:10.1515/ijamh-2019-0140 · Cited by 8
Wound management provided by advanced practice nurses: a scoping review
Morrell, S., Pittman, G., Elliott, R., Ziegler, E., Borawski, S., Mulcaster, A., Hebert, A., Patel, T., & Dannawey, A. (2023) · JBI Evidence Synthesis · doi:10.11124/jbies-23-00019 · Cited by 7
UNDERWOOD, P. C., Ruscitti, B., Nguyen, T. H., Magny‐Normilus, C., Wentzell, K., Watts, S. A., & H, D. B. M. P. (2025) · Health Systems & Reform · doi:10.1080/23288604.2025.2503648 · Cited by 8
The High Cost of American Health Care: Understanding the Deeper Roots of the Crisis
Chang, C. F., Mirvis, D. M., & Mahmood, A. (2025) · Health Care Analysis · doi:10.1007/s10728-025-00554-x · Cited by 7
Fournaise, A., Andersen‐Ranberg, K., Lauridsen, J. T., Espersen, K., Gudex, C. M., & Bech, M. (2023) · Social Science & Medicine · doi:10.1016/j.socscimed.2023.115857 · Cited by 7
Kechichian, A., Pommier, D., Druart, L., Lowry, V., Pinsault, N., & Desmeules, F. (2024) · BMC Family Practice · doi:10.1186/s12875-024-02302-x · Cited by 7
Lovink, M. H., Persoon, A., van Vught, A., Koopmans, R. T. C. M., Schoonhoven, L., & Laurant, M. G. H. (2015) · Journal of Advanced Nursing · doi:10.1111/jan.12759 · Cited by 7
Advanced Practice Nursing in New Zealand
Carryer, J., & Adams, S. (2020) · Advanced practice in nursing · doi:10.1007/978-3-030-20550-8_11 · Cited by 7
Kam, L. Y., Huang, D. Q., Tobias, A. F., Poon, K., Henry, L. L., Kwo, P. Y., Cheung, R. C., & Nguyen, M. H. (2022) · Alimentary Pharmacology & Therapeutics · doi:10.1111/apt.17254 · Cited by 7
Neppelenbroek, E. M., Verhoeven, C. J. M., van der Heijden, O. W. H., van der Pijl, M. S. G., Groenen, C. J. M., Ganzevoort, W., Bijvank, B. S. W. A. N., & de Jonge, A. (2023) · Women and Birth · doi:10.1016/j.wombi.2023.08.006 · Cited by 7
Bezem, J., Kocken, P., Kamphuis, M., Theunissen, M. H. C., Buitendijk, S. E., & Numans, M. E. (2017) · BMJ Open · doi:10.1136/bmjopen-2017-016423 · Cited by 7
Grimes, D. E., Thomas, E. J., Padhye, N. S., Ottosen, M. J., & Grimes, R. M. (2018) · The Journal for Nurse Practitioners · doi:10.1016/j.nurpra.2018.06.005 · Cited by 7
The impact of nurse practitioner scope-of-practice laws on preventable hospitalizations
McMichael, B. J. (2025) · Journal of Health Economics · doi:10.1016/j.jhealeco.2025.103044 · Cited by 6
Hua, J., Sun, D., Wang, H., Chang, J., Guo, F., Zhou, Q. H., Hui, N., Gu, D., & Zhu, L. (2025) · Digital Health · doi:10.1177/20552076251387050 · Cited by 6
Forstner, J., Mangold, J., Litke, N. A., Weis, A., Szécsényi, J., Wensing, M., & Ullrich, C. (2023) · Das Gesundheitswesen · doi:10.1055/a-2144-5767 · Cited by 6
Self-citationThe changing shape of general practice in Scotland: the rise of the ‘megapractice’
McCartney, G., Johnstone, C., & Dover, L. (2024) · Public Health · doi:10.1016/j.puhe.2024.05.026 · Cited by 6
Sonenberg, A., Knepper, H. J., & Pulcini, J. A. (2015) · Poverty & Public Policy · doi:10.1002/pop4.119 · Cited by 6
Gonzalez, A., Delgado, V., & Buscemi, C. P. (2019) · The Journal for Nurse Practitioners · doi:10.1016/j.nurpra.2019.04.015 · Cited by 6
Boman, E., Duvaland, E., Gaarde, K., Leary, A., & Fagerström, L. (2019) · Journal of Advanced Nursing · doi:10.1111/jan.14299 · Cited by 6
The Evolution and Future of Nurse Practitioners in New Zealand
Adams, S., & Carryer, J. (2023) · Advanced practice in nursing · doi:10.1007/978-3-031-20762-4_19 · Cited by 6
Kuschick, D., Dierks, M. T., Grittner, U., Heintze, C., Kümpel, L., Riens, B., Rost, L., Schmidt, K. F. R., Schulze, D., Toutaoui, K. J., et al. (2023) · BMC Family Practice · doi:10.1186/s12875-023-02211-5 · Cited by 6
Abdallah, L., Etten, D. V., Lee, A. J., Melillo, K. D., Remington, R., Gautam, R., & Gore, R. J. (2015) · Research in Gerontological Nursing · doi:10.3928/19404921-20150121-01 · Cited by 6
Neppelenbroek, E. M., van der Heijden, O. W. H., de Vet, H. C. W., Groot, A. D., Daemers, D. O. A., de Jonge, A., & Verhoeven, C. J. M. (2024) · International Journal of Gynecology & Obstetrics · doi:10.1002/ijgo.15497 · Cited by 6
Evaluating the cost of NP-led vs. GP-led primary care in British Columbia
Contandriopoulos, D., Bertoni, K., McCracken, R., Hedden, L., Lavergne, R., & Randhawa, G. K. (2024) · Healthcare Management Forum · doi:10.1177/08404704241229075 · Cited by 5
“11,19,21,26,27,29,30,33,34 There also are some robust studies comparing the cost of care provided by nurses — generally NPs — to the cost of care provided by physicians.”
BackgroundLopatina, E., Barber, C. E. H., LECLERCQ, S. A., Noseworthy, T., Suter, E., Mosher, D. P., & Marshall, D. A. (2022) · Seminars in Arthritis and Rheumatism · doi:10.1016/j.semarthrit.2022.152160 · Cited by 5
Nurse Practitioners as Disruptive Innovators in Palliative Medicine
Opitz, S. E., & Hebert, R. S. (2018) · Journal of Palliative Care · doi:10.1177/0825859718785227 · Cited by 5
van der Pijl, M. S. G., Groenestege, E. Q. T., & Verhoeven, C. J. M. (2019) · Midwifery · doi:10.1016/j.midw.2019.02.003 · Cited by 5
How nurse-led practices perceive implementation of the patient-centered medical home
Frasso, R., Golinkoff, J., Klusaritz, H. A., Kellom, K. S., Kollar-McArthur, H., Miller-Day, M. A., Gabbay, R. A., & Cronholm, P. F. (2017) · Applied Nursing Research · doi:10.1016/j.apnr.2017.02.005 · Cited by 5
The trend in density of skilled health personnel in BRICS countries: Implication for China and India
Yan, F., Li, H., Wang, W., & Zhang, J. (2023) · The International Journal of Health Planning and Management · doi:10.1002/hpm.3623 · Cited by 4
Bomholt, K. B., Mygind, A., Nebsbjerg, M. A., Christensen, M. B., Huibers, L., & Burau, V. (2025) · Scandinavian Journal of Primary Health Care · doi:10.1080/02813432.2025.2490911 · Cited by 4
Metadata
- Authors
- Martínez-González, N. A., Djalali, S., Tandjung, R., Huber-Geismann, F., Markun, S., Wensing, M., & Rosemann, T.
- Affiliations
- University Hospital Zurich (CH)
- Radboud University Medical Center (NL)
- Corresponding author
- Rosemann, Thomas
- Venue
- BMC Health Services Research
- Published
- 2014-05-12
- Volume
- 14
- Issue
- 1
- Pages
- 214-214
- ISSN
- 1472-6963 (ISSN-L)
- PMC
- PMC4065389
- OpenAlex
- W2138392956
- Cited by
- 310
- References
- 50
- Citations by year
- 2026: 10 · 2025: 18 · 2024: 26 · 2023: 24 · 2022: 26 · 2021: 24 · 2020: 36 · 2019: 35 · 2018: 28 · 2017: 36 · 2016: 25 · 2015: 19 · 2014: 2
- FWCI
- 4.65
- Type
- journal article
- Language
- en
- Open access
- gold
- doi.org
- Licence
- Locations
- BMC Health Services Research (publishedVersion, cc-by)
- Europe PMC (PubMed Central) (publishedVersion, cc-by)
- PubMed Central (publishedVersion, cc-by)
- PubMed (publishedVersion)
- Radboud Repository (Radboud University) (publishedVersion)
- Zurich Open Repository and Archive (University of Zurich) (acceptedVersion, cc-by)
- Zurich Open Repository and Archive (University of Zurich) (submittedVersion, cc-by)
- Radboud Repository (Radboud University) (submittedVersion, other-oa)
- Zurich Open Repository and Archive (University of Zurich)
- Funders
- Schweizerische Akademie der Medizinischen Wissenschaften
- Topics
- Health Sciences › Health Professions › General Health Professions › Nursing Roles and Practices
- Health Sciences › Medicine › Family Practice › Primary Care and Health Outcomes
- Health Sciences › Nursing › Research and Theory › Nursing education and management
- Keywords
- nurse-led care, primary care, nurse practitioners, registered nurses, licensed nurses, patient satisfaction, hospitalization, mortality, quality of life, health care costs, physician shortage
- MeSH terms
- Workforce, Clinical Competence, Delivery of Health Care, Hospitalization, Humans, Medical Staff, Hospital, Nursing Staff, Hospital, Personnel Staffing and Scheduling, Primary Health Care, Quality of Life, Randomized Controlled Trials as Topic, Patient Satisfaction, Personnel Delegation
About these checks
Registry, retraction, Cites and statistics results are computed, not judged, with one exception: a printed reference that no index lists is read once by a model before it counts as a citation error. Claims are extracted by a model and kept only when their quote appears verbatim in the text; each cited source is then checked, with a model’s help, for whether it says what the claim relies on. Those verdicts can be wrong — read the claim’s quote and the cited source before relying on one.
Statistics and arithmetic are recomputed, not judged.
Confidence bands are shown only for fields calibrated on our annotated test set. None is calibrated yet, so no band is shown.
What counts as a claim ›How we measure confidence ›How we check this ›
Are you an author, or do you see a problem with this page? Request a review
