

The DOI matches its Crossref record; 87 of the 88 references it cites were found in a registry or an index.
IOP induces upregulation of GFAP and MHC-II and microglia reactivity in mice retina contralateral to experimental glaucoma
Open accessAbstract
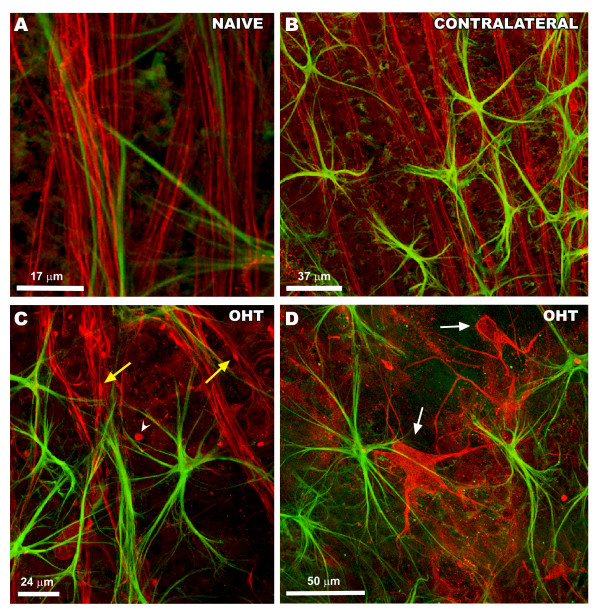
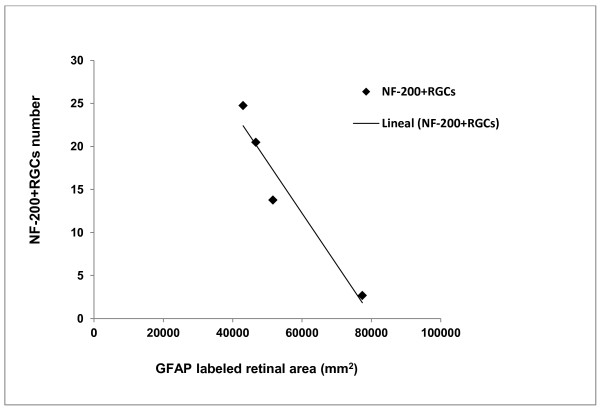
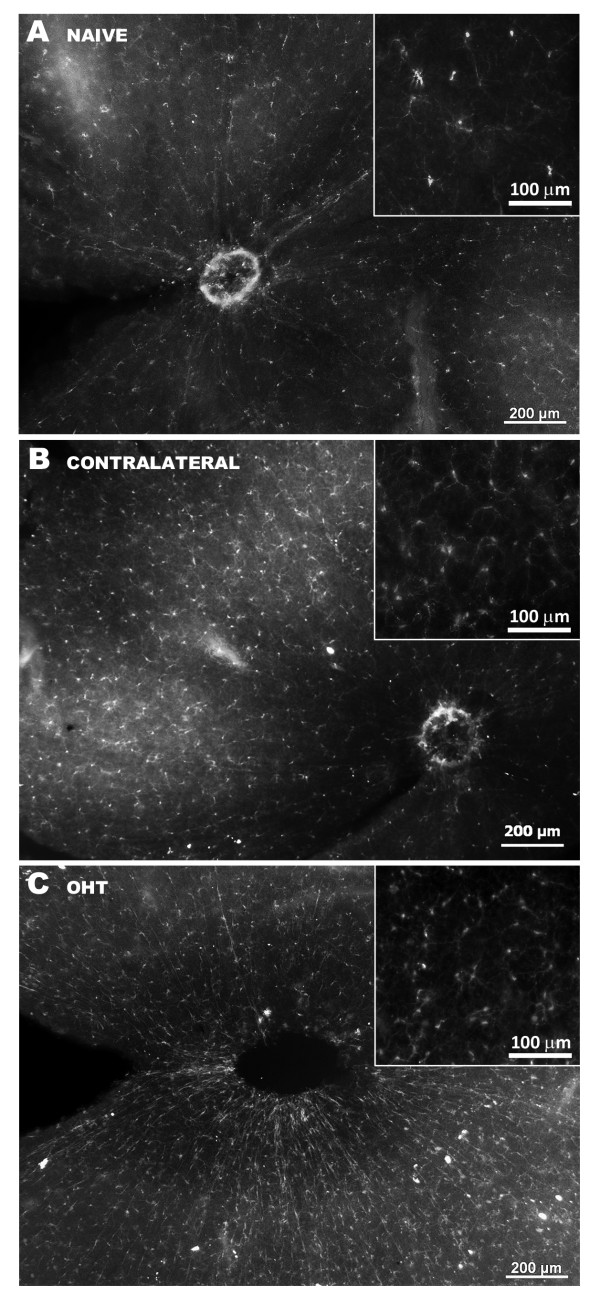
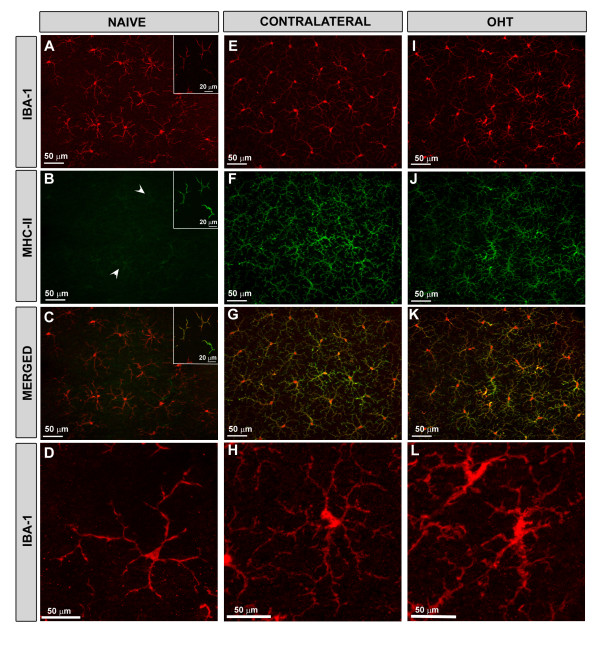
BACKGROUND: Ocular hypertension is a major risk factor for glaucoma, a neurodegenerative disease characterized by an irreversible decrease in ganglion cells and their axons. Macroglial and microglial cells appear to play an important role in the pathogenic mechanisms of the disease. Here, we study the effects of laser-induced ocular hypertension (OHT) in the macroglia, microglia and retinal ganglion cells (RGCs) of eyes with OHT (OHT-eyes) and contralateral eyes two weeks after lasering. METHODS: Two groups of adult Swiss mice were used: age-matched control (naïve, n=9); and lasered (n=9). In the lasered animals, both OHT-eyes and contralateral eyes were analyzed. Retinal whole-mounts were immunostained with antibodies against glial fibrillary acid protein (GFAP), neurofilament of 200 kD (NF-200), ionized calcium binding adaptor molecule (Iba-1) and major histocompatibility complex class II molecule (MHC-II). The GFAP-labeled retinal area (GFAP-RA), the intensity of GFAP immunoreaction (GFAP-IR), and the number of astrocytes and NF-200 + RGCs were quantified. RESULTS: In comparison with naïve: i) astrocytes were more robust in contralateral eyes. In OHT-eyes, the astrocyte population was not homogeneous, given that astrocytes displaying only primary processes coexisted with astrocytes in which primary and secondary processes could be recognized, the former having less intense GFAP-IR (P<0.001); ii) GFAP-RA was increased in contralateral (P<.05) and decreased in OHT-eyes (P <0.001); iii) the mean intensity of GFAP-IR was higher in OHT-eyes (P<0.01), and the percentage of the retinal area occupied by GFAP+ cells with higher intensity levels was increased in contralateral (P=0.05) and in OHT-eyes (P<0.01); iv) both in contralateral and in OHT-eyes, GFAP was upregulated in Müller cells and microglia was activated; v) MHC-II was upregulated on macroglia and microglia. In microglia, it was similarly expressed in contralateral and OHT-eyes. By contrast, in macroglia, MHC-II upregulation was observed mainly in astrocytes in contralateral eyes and in Müller cells in OHT-eyes; vi) NF-200+ RGCs (degenerated cells) appeared in OHT-eyes with a trend for the GFAP-RA to decrease and for the NF-200+RGC number to increase from the center to the periphery (r= -0.45). CONCLUSION: The use of the contralateral eye as an internal control in experimental induction of unilateral IOP should be reconsidered. The gliotic behavior in contralateral eyes could be related to the immune response. The absence of NF-200+RGCs (sign of RGC degeneration) leads us to postulate that the MHC-II upregulation in contralateral eyes could favor neuroprotection.
Overview
The claims and statistics of this paper haven’t been checked yet.
Run the check — free, no account needed. It reads the open-access text and checks the sources it cites.
Integrity signals
Registry
Cites
Statistics
Figures
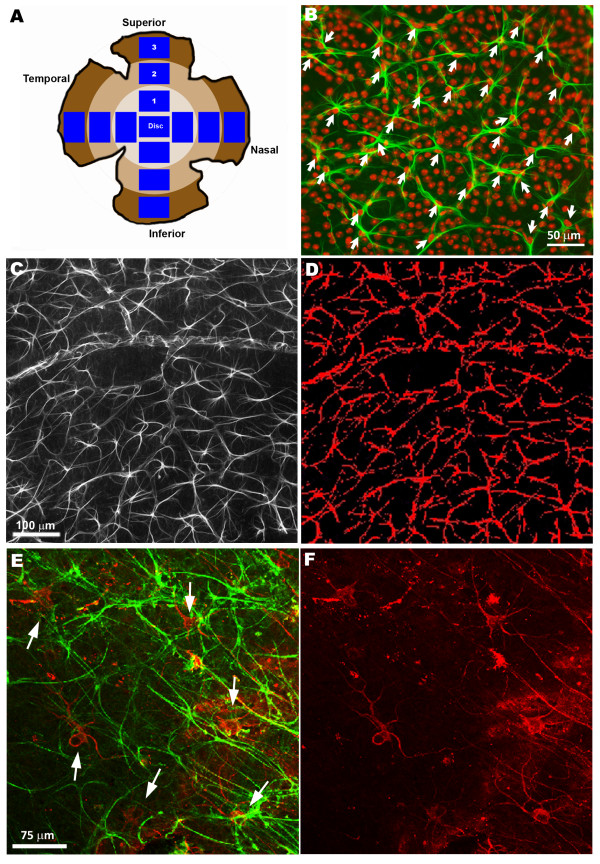
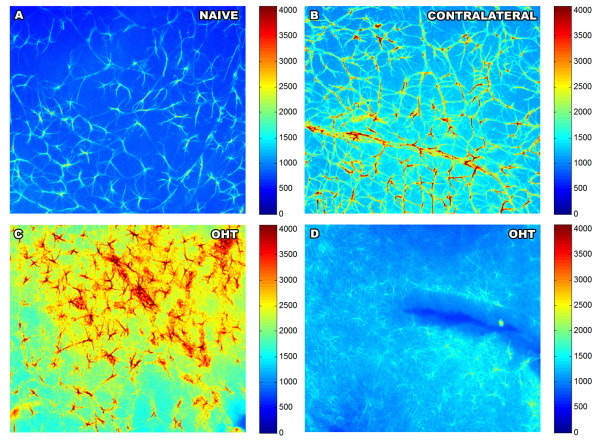
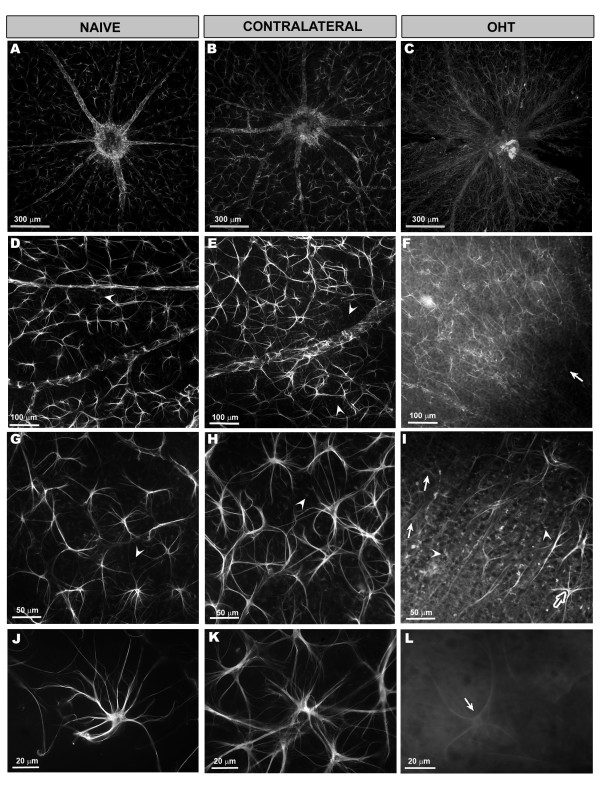
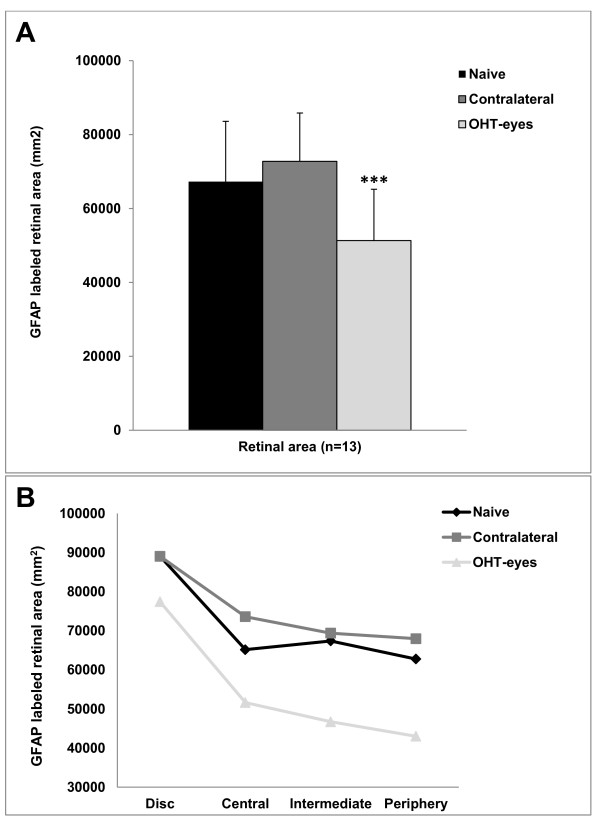
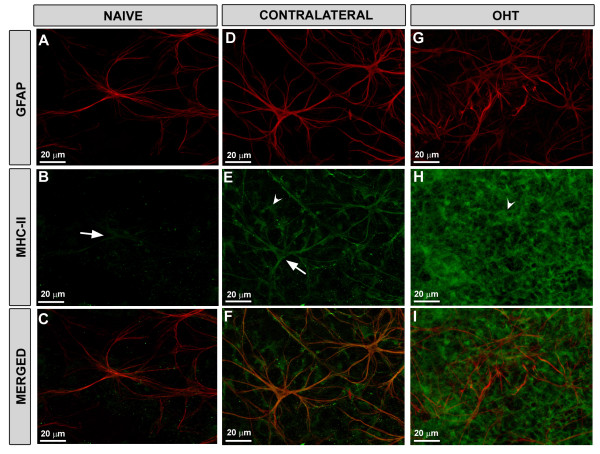
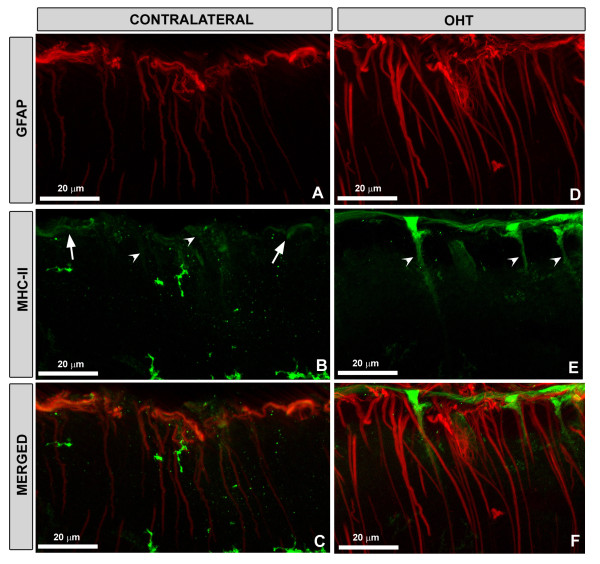
Verification
Claims the paper makes
The claims and statistics of this paper haven’t been checked yet.
Run the check — free, no account needed. It reads the open-access text and checks the sources it cites.
Claims other papers make about this one
Each is checked against this paper’s own text: does it say what the citing paper says it does?
In the citing paper
“These alterations can lead to secondary damage such as, excitotoxicity, neurotrophin deprivation, oxidative damage, mitochondrial dysfunction, and eventually RGC death (Nickells, 1999; Gallego et al., 2012).”
From The role of microglia in retinal neurodegeneration: Alzheimer’s disease, parkinson, and glaucoma. (2017) · cites this paper as Gallego et al., 2012
Self-check
Percentages, sums and reported differences re-computed from the paper’s own numbers.
The self-check needs the paper’s full text.
Citations
Cites
Astrocytes: Biology and pathology
Sofroniew, M. V., & Vinters, H. V. (2010) · Acta Neuropathologica · doi:10.1007/s00401-009-0619-8 · Cited by 5,196
Müller cells in the healthy and diseased retina
Bringmann, A., Pannicke, T., Grosche, J., Francke, M., Wiedemann, P., Skatchkov, S. N., Osborne, N. N., & Reichenbach, A. (2006) · Progress in Retinal and Eye Research · doi:10.1016/j.preteyeres.2006.05.003 · Cited by 1,967
Optic Nerve Damage in Human Glaucoma
Quigley, H. A. (1981) · Archives of Ophthalmology · doi:10.1001/archopht.1981.03930010635009 · Cited by 1,246
Retinal Ganglion Cell Atrophy Correlated With Automated Perimetry in Human Eyes With Glaucoma
Quigley, H. A., Dunkelberger, G. R., & Green, W. R. (1989) · American Journal of Ophthalmology · doi:10.1016/0002-9394(89)90488-1 · Cited by 1,125
Middeldorp, J., & Hol, E. M. (2011) · Progress in Neurobiology · doi:10.1016/j.pneurobio.2011.01.005 · Cited by 1,080
Imai, Y., Ibata, I., Ito, D., Ohsawa, K., & Kohsaka, S. (1996) · Biochemical and Biophysical Research Communications · doi:10.1006/bbrc.1996.1112 · Cited by 872 · cited 1×
“The aim was to determine i) concurrent responses of macroglial and retinal ganglion cells, using specific antibodies as markers against cytoskeletal proteins from both cells: GFAP (a major constituent of the astrocyte cytoskeleton [32] and NF-200kD (a major constituent of the neuronal cytoskeleton, which after axonal…”
ResultKerrigan, L. A., Quigley, H. A., Pease, M. E., Kerrigan, D., & Mitchell, R. S. (2000) · PubMed · Cited by 869
Elevated Glutamate Levels in the Vitreous Body of Humans and Monkeys With Glaucoma
Dreyer, E. B. (1996) · Archives of Ophthalmology · doi:10.1001/archopht.1996.01100130295012 · Cited by 664
Axons of retinal ganglion cells are insulted in the optic nerve early in DBA/2J glaucoma
Howell, G. R., Libby, R. T., Jakobs, T., Smith, R. S., Phalan, F. C., Barter, J. W., Barbay, J. M., Marchant, J. K., Nagaraju, M., Porciatti, V., et al. (2007) · The Journal of Cell Biology · doi:10.1083/jcb.200706181 · Cited by 601
The optic nerve head in glaucoma: role of astrocytes in tissue remodeling
Hernandez, M. R. (2000) · Progress in Retinal and Eye Research · doi:10.1016/s1350-9462(99)00017-8 · Cited by 565
Cited by
Sorted by citations
Items 201–224 of 224
Nork, T. M., Kim, C. B. Y., Katz, A. W., Rasmussen, C. A., Banghart, M., & Hoeve, J. N. V. (2023) · Documenta Ophthalmologica · doi:10.1007/s10633-023-09922-1 · Cited by 1
Glaucoma: Mechanisms of Neurodegeneration
Wareham, L. K., Cooper, M., & Calkins, D. J. (2020) · Elsevier eBooks · doi:10.1016/b978-0-12-809324-5.24202-8 · Cited by 1
Expression of Slit2 and Robo Receptors in a Sprague-Dawley Rat Glaucoma Model
Choy, Y., Shin, J., & Choi, J. (2021) · Indian Journal of Animal Research · doi:10.18805/ijar.bf-4699 · Cited by 1
Gurdita, A., Kwiecień, J. M., & Choh, V. (2023) · Heliyon · doi:10.1016/j.heliyon.2023.e14361 · Cited by 1
Chitosan-Based Nanomedicine for Rosmarinic Acid Ocular Delivery
Baptista-Silva, S. (2014) · Portuguese National Funding Agency for Science, Research and Technology (RCAAP Project by FCT) · doi:10.34626/5b2c-m927 · Cited by 1
Visual function in human and experimental glaucoma
Vasalauskaite, A. (2016) · ORCA Online Research @Cardiff (Cardiff University)
Noailles, A. (2016) · LA Referencia (Red Federada de Repositorios Institucionales de Publicaciones Científicas)
Ramírez, K., & Trías, J. F. (2017) · Odovtos - International Journal of Dental Sciences · doi:10.15517/ijds.v19i3.29698
Glaucoma-Induced Optic Nerve Injury on Retinal Microglia
孙, 凯. (2020) · Hans Journal of Ophthalmology · doi:10.12677/hjo.2020.91003
Eissa, M. S. A. L. (2019) · Journal of Endocrinology and Thyroid Research · doi:10.19080/jetr.2019.04.555648
Under Pressure: The Role of Retinal Astrocytes and the Response to Ocular Hypertension
Cullen, P. F. (2021) · eScholarship (California Digital Library)
Gavrilova, N. A., Гуревич, К. Г., Комова, О. Ю., & Зиновьева, А. В. (2021) · Человек и его здоровье · doi:10.21626/vestnik/2021-2/05
Retinal Disorders in Humans and Experimental ALS Models
Rojas, P., Ramirez, A. I., de Hoz, R., Cadena, M., Salobrar‐García, E., López‐Cuenca, I., Fernández‐Albarral, J. A., Sánchez-Puebla, L., Matamoros, J. A., Salazar, J. J., et al. (2022) · IntechOpen eBooks · doi:10.5772/intechopen.107052
Self-citationInfluence of gut microbiome on primary open angle glaucoma
Chen, D. F., & Napolitano, P. (2023) · Elsevier eBooks · doi:10.1016/b978-0-323-98338-9.00009-8
Effects of Brimonidine on Microglia Morphology in the Transient Retinal Ischemia Model
Acar, S. E., glu, M. S. S. ̆., Çolak, A., ̧s, Z. A., & Dinçel, A. S. (2022) · BOHR International Journal of Current Research in Optometry and Ophthalmology · doi:10.54646/bijcroo.2023.23
Yamamoto, M., Ash, D., Varadarajan, S., Zaidi, S. A. H., Rojas, M., Xu, Z., Kelley, S. S., Caldwell, R. B., Fukai, T., & Ushio‐Fukai, M. (2025) · bioRxiv (Cold Spring Harbor Laboratory) · doi:10.1101/2025.05.17.654687
Hu, X. T., Zhao, G.-L., Xu, M.-X., Zhou, H., Li, F., Miao, Y., Lei, B., Yang, X.-L., & Wang, Z. (2021) · Figshare · doi:10.6084/m9.figshare.17598239
Additional file 1 of A time window for rescuing dying retinal ganglion cells
You, W., Knoops, K., Boesten, I., Berendschot, T. T. J. M., van Zandvoort, M. A. M. J., Benedikter, B. J., Webers, C. A. B., Reutelingsperger, C. P. M., & Gorgels, T. G. M. F. (2024) · Figshare · doi:10.6084/m9.figshare.26675273
Multi-omics panorama of glaucoma: Pathogenesis, biomarkers, and novel therapeutic strategies
Gao, J., Liu, M., Liu, X., Zhang, M., Qu, W., Wang, W., Cao, P., & Mo, Y. (2026) · Survey of Ophthalmology · doi:10.1016/j.survophthal.2026.04.008
Microglia crosstalk with T cells in neurodegenerative diseases: pathogenesis and treatment targets
Chen, G., Zhao, C., Wang, C., Chen, G., Shi, J., & Chen, H. (2026) · International Immunopharmacology · doi:10.1016/j.intimp.2026.116781
Wang, Y., Liu, L., Zhang, J., Liu, Y., Ren, J., & Qian, X. (2026) · Frontiers in Bioengineering and Biotechnology · doi:10.3389/fbioe.2026.1875609
Martínez‐López, M. A., Vázquez-Gómez, D., Paleo‐García, V., Rubio‐Casado, S., Rodríguez-Morales, J., Llorente, R., Ramirez, J. M., Matamoros, J. A., Fernández‐Albarral, J. A., Marco, E. M., et al. (2026) · Frontiers in Neuroanatomy · doi:10.3389/fnana.2026.1987962
Metadata
- Authors
- Gallego, B. I., Salazar, J. J., de Hoz, R., Rojas, B., Ramírez, A. I., Salinas-Navarro, M., Ortín-Martínez, A., Valiente-Soriano, F. J., Avilés-Trigueros, M., Villegas-Perez, M. P., Vidal-Sanz, M., Triviño, A., & Ramírez, J. M.
- Affiliations
- Universidad Complutense de Madrid (ES)
- Universidad de Murcia (ES)
- Venue
- Journal of Neuroinflammation
- Published
- 2012-05-14
- Volume
- 9
- Issue
- 1
- Pages
- 92-92
- ISSN
- 1742-2094 (ISSN-L)
- PMC
- PMC3410794
- OpenAlex
- W2029522517
- Cited by
- 224
- References
- 88
- Citations by year
- 2026: 5 · 2025: 9 · 2024: 5 · 2023: 17 · 2022: 18 · 2021: 29 · 2020: 22 · 2019: 15 · 2018: 10 · 2017: 21 · 2016: 24 · 2015: 22 · 2014: 15 · 2013: 8 · 2012: 4
- FWCI
- 14.66
- Type
- journal article
- Language
- en
- Open access
- gold
- doi.org
- Locations
- Journal of Neuroinflammation (publishedVersion, cc-by)
- Europe PMC (PubMed Central) (publishedVersion, cc-by)
- PubMed Central (publishedVersion, cc-by)
- PubMed (publishedVersion)
- LA Referencia (Red Federada de Repositorios Institucionales de Publicaciones Científicas) (submittedVersion, cc-by)
- Library Open Repository (Universidad Complutense Madrid) (submittedVersion)
- DOAJ (DOAJ: Directory of Open Access Journals) (submittedVersion, cc-by-sa)
- Funders
- Fundación Mutua Madrileña (4131173)
- Universidad Complutense de Madrid (GR35/10A, GR35/10)
- Ministerio de Ciencia e Innovación
- Instituto de Salud Carlos III (RD07/0062/0000, RD07/0062)
- Topics
- Health Sciences › Medicine › Ophthalmology › Glaucoma and retinal disorders
- Life Sciences › Neuroscience › Neurology › Neuroinflammation and Neurodegeneration Mechanisms
- Health Sciences › Medicine › Ophthalmology › Retinal Diseases and Treatments
- Keywords
- experimental glaucoma, ocular hypertension, laser-induced ocular hypertension, microglial activation, astrocytes, glial fibrillary acidic protein, MHC class II, retinal ganglion cells, Müller cells, neuroinflammation, fellow eye, neurodegeneration, neurofilaments, Iba1, mice, glaucoma risk factors, neuroprotection
- MeSH terms
- Animals, Histocompatibility Antigens Class II, Astrocytes, Cell Count, Glaucoma, Glial Fibrillary Acidic Protein, Intraocular Pressure, Male, Nerve Tissue Proteins, Ocular Hypertension, Retina, Retinal Ganglion Cells, Up-Regulation, Microglia, Mice
About these checks
Registry, retraction, Cites and statistics results are computed, not judged, with one exception: a printed reference that no index lists is read once by a model before it counts as a citation error. Claims are extracted by a model and kept only when their quote appears verbatim in the text; each cited source is then checked, with a model’s help, for whether it says what the claim relies on. Those verdicts can be wrong — read the claim’s quote and the cited source before relying on one.
Statistics and arithmetic are recomputed, not judged.
Confidence bands are shown only for fields calibrated on our annotated test set. None is calibrated yet, so no band is shown.
What counts as a claim ›How we measure confidence ›How we check this ›
Are you an author, or do you see a problem with this page? Request a review
