

The DOI matches its Crossref record; 76 of the 76 references it cites were found in a registry or an index.
Environmental monitoring using next generation sequencing: rapid identification of macroinvertebrate bioindicator species
Open accessAbstract
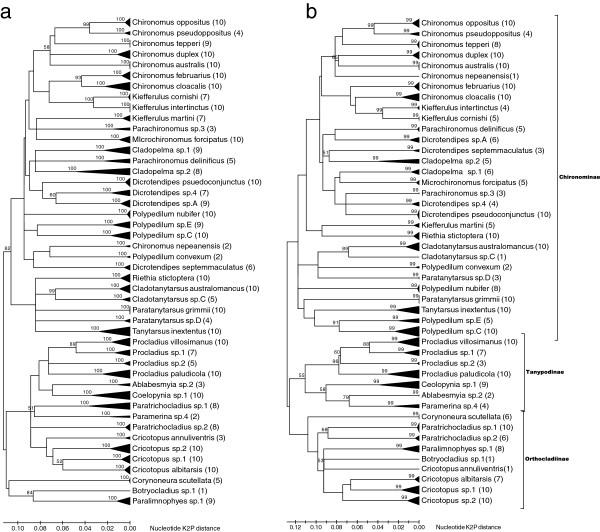
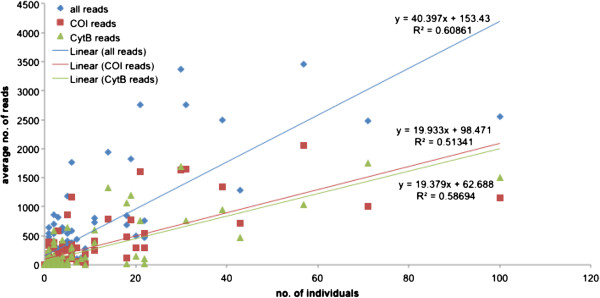
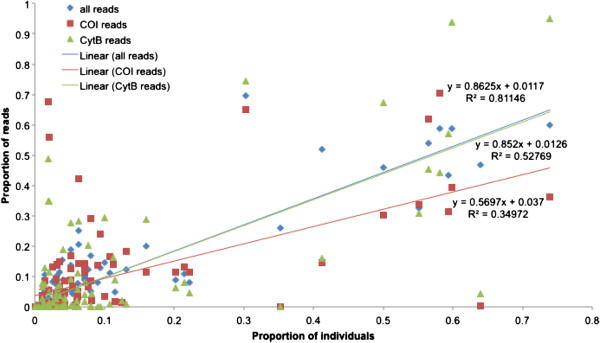
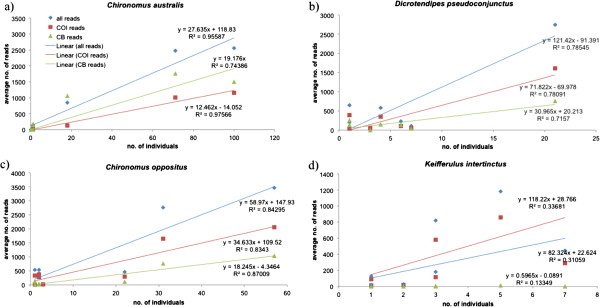
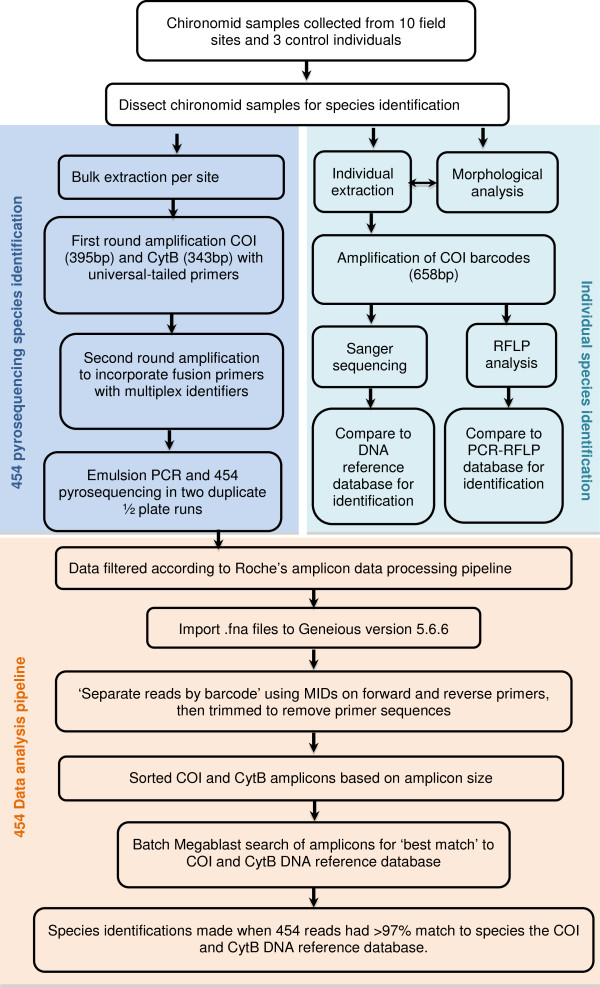
INTRODUCTION: Invertebrate communities are central to many environmental monitoring programs. In freshwater ecosystems, aquatic macroinvertebrates are collected, identified and then used to infer ecosystem condition. Yet the key step of species identification is often not taken, as it requires a high level of taxonomic expertise, which is lacking in most organizations, or species cannot be identified as they are morphologically cryptic or represent little known groups. Identifying species using DNA sequences can overcome many of these issues; with the power of next generation sequencing (NGS), using DNA sequences for routine monitoring becomes feasible. RESULTS: In this study, we test if NGS can be used to identify species from field-collected samples in an important bioindicator group, the Chironomidae. We show that Cytochrome oxidase I (COI) and Cytochrome B (CytB) sequences provide accurate DNA barcodes for chironomid species. We then develop a NGS analysis pipeline to identifying species using megablast searches of high quality sequences generated using 454 pyrosequencing against comprehensive reference libraries of Sanger-sequenced voucher specimens. We find that 454 generated COI sequences successfully identified up to 96% of species in samples, but this increased up to 99% when combined with CytB sequences. Accurate identification depends on having at least five sequences for a species; below this level species not expected in samples were detected. Incorrect incorporation of some multiplex identifiers (MID's) used to tag samples was a likely cause, and most errors could be detected when using MID tags on forward and reverse primers. We also found a strong quantitative relationship between the number of 454 sequences and individuals showing that it may be possible to estimate the abundance of species from 454 pyrosequencing data. CONCLUSIONS: Next generation sequencing using two genes was successful for identifying chironomid species. However, when detecting species from 454 pyrosequencing data sets it was critical to include known individuals for quality control and to establish thresholds for detecting species. The NGS approach developed here can lead to routine species-level diagnostic monitoring of aquatic ecosystems.
Overview
The claims and statistics of this paper haven’t been checked yet.
Run the check — free, no account needed. It reads the open-access text and checks the sources it cites.
Integrity signals
Registry
Cites
Statistics
Figures
Verification
Claims the paper makes
The claims and statistics of this paper haven’t been checked yet.
Run the check — free, no account needed. It reads the open-access text and checks the sources it cites.
Claims other papers make about this one
Each is checked against this paper’s own text: does it say what the citing paper says it does?
In the citing paper
“small organisms may be lost owing to low number of sequence reads [38].”
In the citing paper
“First, sampled organisms have vastly different biomasses, and thus small organisms may be lost owing to low number of sequence reads [38].”
Self-check
Percentages, sums and reported differences re-computed from the paper’s own numbers.
The self-check needs the paper’s full text.
Citations
Cites
Folmer, O., Black, M., Hoeh, W., Lutz, R., & Vrijenhoek, R. (1994) · PubMed · doi:10.5281/zenodo.15145663 · Cited by 15,546
Biological identifications through DNA barcodes
Hebert, P. D. N., Cywinska, A., Ball, S. L., & deWaard, J. R. (2003) · Proceedings of the Royal Society of London. Series B: Biological Sciences · doi:10.1098/rspb.2002.2218 · Cited by 13,376
Freshwater biomonitoring and benthic macroinvertebrates
(1993) · Choice Reviews Online · doi:10.5860/choice.30-6159 · Cited by 1,762
Meier, R., Kwong, S.-Y., Vaidya, G., & Ng, P. (2006) · Systematic Biology · doi:10.1080/10635150600969864 · Cited by 1,409
DEVELOPMENTS IN AQUATIC INSECT BIOMONITORING: A Comparative Analysis of Recent Approaches
Bonada, N., Prat, N., Resh, V. H., & Statzner, B. (2005) · Annual Review of Entomology · doi:10.1146/annurev.ento.51.110104.151124 · Cited by 1,071
Next‐generation sequencing technologies for environmental DNA research
Shokralla, S., Spall, J. L., Gibson, J. F., & Hajibabaei, M. (2012) · Molecular Ecology · doi:10.1111/j.1365-294x.2012.05538.x · Cited by 1,007
Defining operational taxonomic units using DNA barcode data
Blaxter, M., Mann, J., Chapman, T. W., Thomas, F., Whitton, C., Floyd, R., & Abebe, E. (2005) · Philosophical Transactions of the Royal Society B Biological Sciences · doi:10.1098/rstb.2005.1725 · Cited by 885
Biodiversity soup: metabarcoding of arthropods for rapid biodiversity assessment and biomonitoring
Yu, D. W., Ji, Y., Emerson, B. C., Wang, X., Ye, C., Yang, C., & Ding, Z. (2012) · Methods in Ecology and Evolution · doi:10.1111/j.2041-210x.2012.00198.x · Cited by 763
Molecular barcodes for soil nematode identification
Floyd, R., Abebe, E., Papert, A., & Blaxter, M. (2002) · Molecular Ecology · doi:10.1046/j.1365-294x.2002.01485.x · Cited by 750
Hajibabaei, M., Shokralla, S., Zhou, X., Singer, G. A. C., & Baird, D. J. (2011) · PLoS ONE · doi:10.1371/journal.pone.0017497 · Cited by 584
Tedersoo, L., Nilsson, R. H., Abarenkov, K., Jairus, T., Sadam, A., Saar, I., Bahram, M., Bechem, E. E. T., Chuyong, G. B., & Kõljalg, U. (2010) · New Phytologist · doi:10.1111/j.1469-8137.2010.03373.x · Cited by 571
Chironomid communities as water quality indicators
Sæther, O. A. (1979) · Ecography · doi:10.1111/j.1600-0587.1979.tb00683.x · Cited by 570
A minimalist barcode can identify a specimen whose DNA is degraded
Hajibabaei, M., Smith, M. A., Janzen, D. H., RODRIGUEZ, J. J., Whitfield, J. B., & Hebert, P. D. N. (2006) · Molecular Ecology Notes · doi:10.1111/j.1471-8286.2006.01470.x · Cited by 559
Baird, D. J., & Hajibabaei, M. (2012) · Molecular Ecology · doi:10.1111/j.1365-294x.2012.05519.x · Cited by 535
Introduction to freshwater biomonitoring and benthic macroinvertebrates
Rosenberg, D. M. (1993) · Medical Entomology and Zoology · Cited by 502
Lenat, D. R. (1988) · Journal of the North American Benthological Society · doi:10.2307/1467422 · Cited by 462
Blacket, M. J., Robin, C., Good, R. T., Lee, S. F., & Miller, A. D. (2012) · Molecular Ecology Resources · doi:10.1111/j.1755-0998.2011.03104.x · Cited by 401
Taxonomy and stream ecology—The benefits of genus- and species-level identifications
Lenat, D. R., & Resh, V. H. (2001) · Journal of the North American Benthological Society · doi:10.2307/1468323 · Cited by 385
Evaluating high‐throughput sequencing as a method for metagenomic analysis of nematode diversity
Porazinska, D. L., Giblin-davis, R. M., Faller, L. L., Farmerie, W. G., Kanzaki, N., Morris, K., Powers, T. O., Tucker, A. E., Sung, W., & Thomas, W. K. (2009) · Molecular Ecology Resources · doi:10.1111/j.1755-0998.2009.02611.x · Cited by 369
Ultrasequencing of the meiofaunal biosphere: practice, pitfalls and promises
Creer, S., Fonseca, V. G., Porazinska, D. L., Giblin-davis, R. M., Sung, W., Power, D. M., PACKER, M., Carvalho, G. R., Blaxter, M., Lambshead, P. J. D., et al. (2010) · Molecular Ecology · doi:10.1111/j.1365-294x.2009.04473.x · Cited by 357
A comprehensive DNA sequence library is essential for identification with DNA barcodes
Ekrem, T., Willassen, E., & Stur, E. (2006) · Molecular Phylogenetics and Evolution · doi:10.1016/j.ympev.2006.11.021 · Cited by 346
Parameswaran, P., Jalili, R., Tao, L., Shokralla, S., Gharizadeh, B., Ronaghi, M., & Fire, A. Z. (2007) · Nucleic Acids Research · doi:10.1093/nar/gkm760 · Cited by 344
Parallel tagged sequencing on the 454 platform
Meyer, M., Stenzel, U., & Hofreiter, M. (2008) · Nature Protocols · doi:10.1038/nprot.2007.520 · Cited by 324
Ferri, E., Barbuto, M., Bain, O., Galimberti, A., Uni, S., Guerrero, R., Ferté, H., Bandi, C., Martin, C., & Casiraghi, M. (2009) · Frontiers in Zoology · doi:10.1186/1742-9994-6-1 · Cited by 324
Current progress in DNA barcoding and future implications for entomology
Jinbo, U., Kato, T., & Itô, M. (2011) · Entomological Science · doi:10.1111/j.1479-8298.2011.00449.x · Cited by 313
Hodkinson, I. D., & Jackson, J. K. (2005) · Environmental Management · doi:10.1007/s00267-004-0211-x · Cited by 313
Use of benthos in lake monitoring
Wiederholm, T. (1980) · Water Environment Research · Cited by 301
Jones, F. C. (2008) · Environmental Reviews · doi:10.1139/a07-010 · Cited by 300
Biological identifications of mayflies (Ephemeroptera) using DNA barcodes
Ball, S. L., Hebert, P. D. N., Burian, S. K., & Webb, J. M. (2005) · Journal of the North American Benthological Society · doi:10.1899/04-142.1 · Cited by 290
Whitworth, T. L., Dawson, R. D., Magalon, H., & Baudry, E. (2007) · Proceedings of the Royal Society B Biological Sciences · doi:10.1098/rspb.2007.0062 · Cited by 283
DNA-based species delineation in tropical beetles using mitochondrial and nuclear markers
Monaghan, M. T., Balke, M., Gregory, T. R., & Vogler, A. P. (2005) · Philosophical Transactions of the Royal Society B Biological Sciences · doi:10.1098/rstb.2005.1724 · Cited by 248
Jermiin, L. S., & Crozier, R. H. (1994) · Journal of Molecular Evolution · doi:10.1007/bf00176090 · Cited by 242
Moulton, J., & Wiegmann, B. (2004) · Molecular Phylogenetics and Evolution · doi:10.1016/s1055-7903(03)00284-7 · Cited by 237
Rare species in multivariate analysis for bioassessment: some considerations
Cao, Y., Larsen, D. P., & Thorne, R. S.-J. (2001) · Journal of the North American Benthological Society · doi:10.2307/1468195 · Cited by 236
Ecological assessment of estuarine sediments by pyrosequencing eukaryotic ribosomal DNA
Chariton, A. A., Court, L. N., HARTLEY, D. M., Colloff, M. J., & Hardy, C. M. (2010) · Frontiers in Ecology and the Environment · doi:10.1890/090115 · Cited by 214
Carlsen, T., Aas, A. B., Lindner, D. L., Vrålstad, T., Schumacher, T. K., & Kauserud, H. (2012) · Fungal ecology · doi:10.1016/j.funeco.2012.06.003 · Cited by 180
Sweeney, B. W., Battle, J. M., Jackson, J. K., & Dapkey, T. (2011) · Journal of the North American Benthological Society · doi:10.1899/10-016.1 · Cited by 180
Markmann, M., & Tautz, D. (2005) · Philosophical Transactions of the Royal Society B Biological Sciences · doi:10.1098/rstb.2005.1723 · Cited by 176
Identification of Nearctic black flies using DNA barcodes (Diptera: Simuliidae)
Rivera, J., & Currie, D. C. (2009) · Molecular Ecology Resources · doi:10.1111/j.1755-0998.2009.02648.x · Cited by 164
Pfenninger, M., Nowak, C., KLEY, C., Steinke, D., & Streit, B. (2007) · Molecular Ecology · doi:10.1111/j.1365-294x.2006.03136.x · Cited by 150
Classification of water-bodies and pollution
Lindegaard, C. (1995) · Springer eBooks · doi:10.1007/978-94-011-0715-0_15 · Cited by 144
Hewlett, R. (2000) · Journal of the North American Benthological Society · doi:10.2307/1468077 · Cited by 130
Do rare species have any place in multivariate analysis for bioassessment?
Marchant, R. (2002) · Journal of the North American Benthological Society · doi:10.2307/1468417 · Cited by 109
Carew, M. E., Pettigrove, V. J., Cox, R. L., & Hoffmann, A. A. (2007) · Freshwater Biology · doi:10.1111/j.1365-2427.2007.01840.x · Cited by 108
Self-citationPorazinska, D. L., Sung, W., Giblin-davis, R. M., & Thomas, W. K. (2009) · Molecular Ecology Resources · doi:10.1111/j.1755-0998.2009.02819.x · Cited by 106
DNA taxonomy of a neglected animal phylum: an unexpected diversity of tardigrades
Blaxter, M., Elsworth, B., & Daub, J. (2004) · Proceedings of the Royal Society B Biological Sciences · doi:10.1098/rsbl.2003.0130 · Cited by 103
Tan, D., Ang, Y., LIM, G. S., Ismail, M. R. B., & Meier, R. (2009) · Zoologica Scripta · doi:10.1111/j.1463-6409.2009.00408.x · Cited by 98
Ecometagenetics confirm high tropical rainforest nematode diversity
Porazinska, D. L., Giblin-davis, R. M., Esquivel, A., Powers, T. O., Sung, W., & Thomas, W. K. (2010) · Molecular Ecology · doi:10.1111/j.1365-294x.2010.04891.x · Cited by 97
Pfrender, M. E., Hawkins, C. P., Bagley, M. J., Courtney, G. W., Creutzburg, B. R., Epler, J. H., Fend, S., Ferrington, L. C., Hartzell, P., Jackson, S. A., et al. (2010) · The Quarterly Review of Biology · doi:10.1086/655118 · Cited by 89
Assigning macroinvertebrate tolerance classifications using generalised additive models
Yuan, L. L. (2004) · Freshwater Biology · doi:10.1111/j.1365-2427.2004.01206.x · Cited by 88
Guryev, V., Makarevitch, I., Blinov, A. G., & Martin, J. (2001) · Molecular Phylogenetics and Evolution · doi:10.1006/mpev.2001.0898 · Cited by 79
DNA identification of urban Tanytarsini chironomids (Diptera:Chironomidae)
Carew, M. E., Pettigrove, V. J., Cox, R. L., & Hoffmann, A. A. (2007) · Journal of the North American Benthological Society · doi:10.1899/06-120.1 · Cited by 78
Self-citationSystematics and biogeography of the Gondwanan Orthocladiinae (Diptera: Chironomidae)
Krosch, M. N., Baker, A. M., Mather, P. B., & Cranston, P. S. (2011) · Molecular Phylogenetics and Evolution · doi:10.1016/j.ympev.2011.03.003 · Cited by 74
Pettigrove, V. J., & Hoffmann, A. A. (2004) · Environmental Toxicology and Chemistry · doi:10.1897/03-459.1 · Cited by 72
Self-citationHow common are rare taxa in long-term benthic macroinvertebrate surveys?
Resh, V. H., Bêche, L. A., & McElravy, E. P. (2005) · Journal of the North American Benthological Society · doi:10.1899/05-026.1 · Cited by 68
Discrimination of Cricotopus species (Diptera: Chironomidae) by DNA barcoding
Sinclair, C. S., & Gresens, S. E. (2008) · Bulletin of Entomological Research · doi:10.1017/s0007485308005865 · Cited by 65
Identifying chironomids (Diptera: Chironomidae) for biological monitoring with PCR–RFLP
Carew, M. E., Pettigrove, V. J., & Hoffmann, A. A. (2003) · Bulletin of Entomological Research · doi:10.1079/ber2003268 · Cited by 61
Self-citationBorges, L. M. S., Sivrikaya, H., Roux, A. L., Shipway, J. R., Cragg, S. M., & Costa, F. O. (2012) · Invertebrate Systematics · doi:10.1071/is12028 · Cited by 57
Isolating the impact of sediment toxicity in urban streams
Marshall, S., Pettigrove, V. J., Carew, M. E., & Hoffmann, A. A. (2010) · Environmental Pollution · doi:10.1016/j.envpol.2009.11.019 · Cited by 56
Self-citationStressor tolerance values for benthic macroinvertebrates in Mississippi
Bressler, D. W., Stribling, J. B., Paul, M. J., & Hicks, M. B. (2006) · Hydrobiologia · doi:10.1007/s10750-006-0266-1 · Cited by 55
Carew, M. E., Pettigrove, V., & Hoffmann, A. A. (2005) · Annals of the Entomological Society of America · doi:10.1603/0013-8746(2005)098[0587:tuodmi]2.0.co;2 · Cited by 55
Self-citationCarew, M. E., Miller, A. D., & Hoffmann, A. A. (2011) · Ecotoxicology · doi:10.1007/s10646-011-0615-3 · Cited by 47
Self-citationRiva‐Murray, K., Bode, R. W., Phillips, P. J. J., & Wall, G. (2002) · Northeastern Naturalist · doi:10.1656/1092-6194(2002)009[0127:isdwbd]2.0.co;2 · Cited by 43
Carew, M. E., Marshall, S. E., & Hoffmann, A. A. (2011) · Bulletin of Entomological Research · doi:10.1017/s000748531100006x · Cited by 39
Self-citationEffects of long-chain hydrocarbon-polluted sediment on freshwater macroinvertebrates
Pettigrove, V. J., & Hoffmann, A. A. (2005) · Environmental Toxicology and Chemistry · doi:10.1897/05-018r.1 · Cited by 37
Self-citationDNA barcoding should accompany taxonomy – the case of Cerebratulus spp (Nemertea)
Sundberg, P., VODOTI, E. T., & Strand, M. (2009) · Molecular Ecology Resources · doi:10.1111/j.1755-0998.2009.02774.x · Cited by 34
Bahrndorff, S., Ward, J., Pettigrove, V. J., & Hoffmann, A. A. (2005) · Environmental Pollution · doi:10.1016/j.envpol.2005.05.024 · Cited by 33
Self-citationGeraci, C. J., Al-Saffar, M. A., & Zhou, X. Y. (2011) · Journal of the North American Benthological Society · doi:10.1899/10-011.1 · Cited by 29
The effects of sediment quality on benthic macroinvertebrates in the River Murray, Australia
Townsend, K. R., Pettigrove, V. J., Carew, M. E., & Hoffmann, A. A. (2009) · Marine and Freshwater Research · doi:10.1071/mf08121 · Cited by 28
Self-citationA taxonomic revision of the genusStempellinella(Diptera: Chironomidae)
Ekrem, T. (2007) · Journal of Natural History · doi:10.1080/00222930701437360 · Cited by 27
Ruse, L., Herrmann, S. J., & Sublette, J. E. (2000) · ScholarsArchive (Brigham Young University) · Cited by 24
Neville, P. J., & Yen, A. L. (2007) · Australian Journal of Experimental Agriculture · doi:10.1071/ea05268 · Cited by 22
Sharley, D. J., Hoffmann, A. A., & Pettigrove, V. J. (2008) · Environmental Pollution · doi:10.1016/j.envpol.2008.06.014 · Cited by 21
Self-citationLong-term data assessment of chironomid taxa structure and function in the River Thames
Ruse, L., & Davison, M. J. (2000) · Regulated Rivers Research & Management · doi:10.1002/(sici)1099-1646(200003/04)16:2 · Cited by 18
Anson, J. R., Pettigrove, V. J., Carew, M. E., & Hoffmann, A. A. (2007) · Environmental Toxicology and Chemistry · doi:10.1897/07-414.1 · Cited by 13
Self-citationCombining rapid bioassessment and field-based microcosms for identifying impacts in an urban river
O'Brien, M. L., Pettigrove, V. J., Carew, M. E., & Hoffmann, A. A. (2010) · Environmental Toxicology and Chemistry · doi:10.1002/etc.215 · Cited by 7
Self-citation
Cited by
Sorted by citations
Ruppert, K. M., Kline, R. J., & Rahman, M. S. (2019) · Global Ecology and Conservation · doi:10.1016/j.gecco.2019.e00547 · Cited by 1,260
Taberlet, P., Bonin, A., Zinger, L., & Coissac, É. (2018) · doi:10.1093/oso/9780198767220.001.0001 · Cited by 1,146
Elbrecht, V., & Leese, F. (2015) · PLOS ONE · doi:10.1371/journal.pone.0130324 · Cited by 765
Tag jumps illuminated – reducing sequence‐to‐sample misidentifications in metabarcoding studies
Schnell, I. B., Bohmann, K., & Gilbert, M. T. P. (2015) · Molecular Ecology Resources · doi:10.1111/1755-0998.12402 · Cited by 643
Pawlowski, J. W., Kelly‐Quinn, M., Altermatt, F., Apothéloz‐Perret‐Gentil, L., Beja, P. R., Boggero, A., Borja, Á., Bouchez, A., Cordier, T., Domaizon, I., et al. (2018) · The Science of The Total Environment · doi:10.1016/j.scitotenv.2018.05.002 · Cited by 597
Metadata
- Authors
- Carew, M. E., Pettigrove, V. J., Metzeling, L., & Hoffmann, A. A.
- Affiliations
- The University of Melbourne (AU)
- Environment Protection Authority Victoria (AU)
- Corresponding author
- Carew, Melissa E
- Venue
- Frontiers in Zoology
- Published
- 2013
- Volume
- 10
- Issue
- 1
- Pages
- 45
- ISSN
- 1742-9994 (ISSN-L)
- PMC
- PMC3750358
- OpenAlex
- W2159396143
- Cited by
- 243
- References
- 76
- Citations by year
- 2026: 5 · 2025: 4 · 2024: 5 · 2023: 12 · 2022: 8 · 2021: 16 · 2020: 27 · 2019: 23 · 2018: 50 · 2017: 33 · 2016: 24 · 2015: 24 · 2014: 11
- FWCI
- 17.38
- Type
- journal article
- Language
- en
- Open access
- gold
- doi.org
- Licence
- cc-by
- Locations
- Frontiers in Zoology (publishedVersion, cc-by)
- Europe PMC (PubMed Central) (publishedVersion, cc-by)
- PubMed Central (publishedVersion, cc-by)
- PubMed (publishedVersion)
- Minerva Access (University of Melbourne) (submittedVersion, cc-by)
- Funders
- Melbourne Water
- State Government of Victoria
- Environment Protection Authority Victoria
- Australian Research Council
- Topics
- Physical Sciences › Environmental Science › Ecology › Environmental DNA in Biodiversity Studies
- Life Sciences › Agricultural and Biological Sciences › Ecology, Evolution, Behavior and Systematics › Invertebrate Taxonomy and Ecology
- Physical Sciences › Environmental Science › Ecology › Freshwater macroinvertebrate diversity and ecology
- Keywords
- DNA barcoding, Chironomidae, aquatic macroinvertebrates, bioindicator species, species identification, COI, cytochrome b, 454 pyrosequencing, environmental monitoring, freshwater ecosystems, species abundance estimation, reference library
About these checks
Registry, retraction, Cites and statistics results are computed, not judged, with one exception: a printed reference that no index lists is read once by a model before it counts as a citation error. Claims are extracted by a model and kept only when their quote appears verbatim in the text; each cited source is then checked, with a model’s help, for whether it says what the claim relies on. Those verdicts can be wrong — read the claim’s quote and the cited source before relying on one.
Statistics and arithmetic are recomputed, not judged.
Confidence bands are shown only for fields calibrated on our annotated test set. None is calibrated yet, so no band is shown.
What counts as a claim ›How we measure confidence ›How we check this ›
Are you an author, or do you see a problem with this page? Request a review
