

The DOI matches its Crossref record; 33 of the 33 references it cites were found in a registry or an index.
Which components or attributes of biodiversity influence which dimensions of poverty?
Abstract
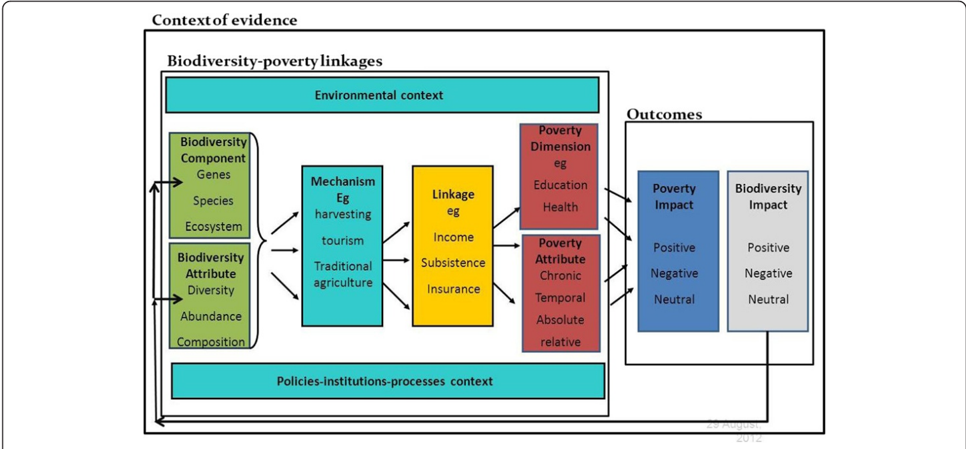
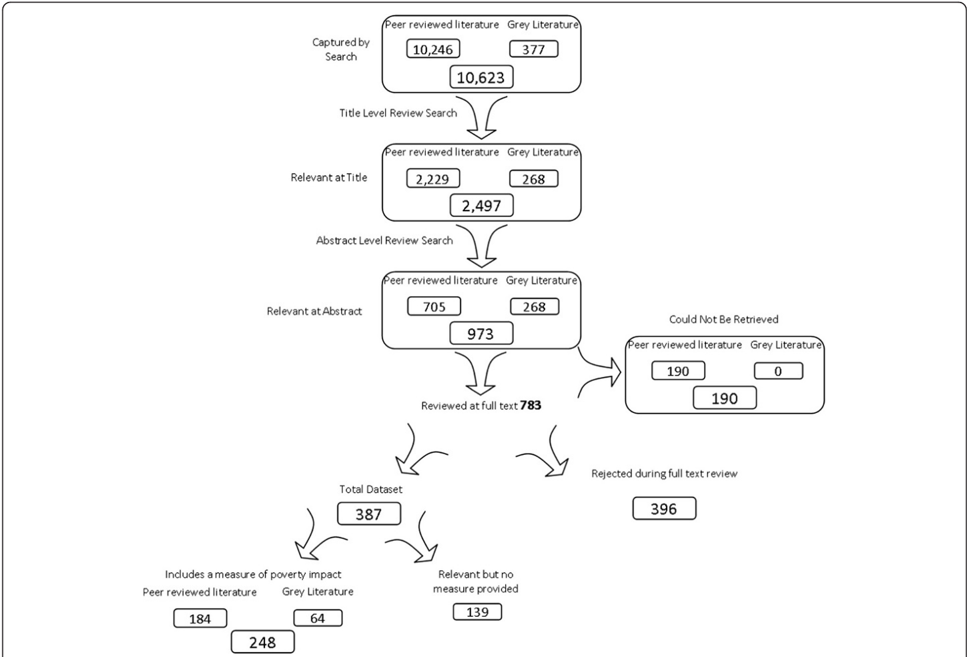
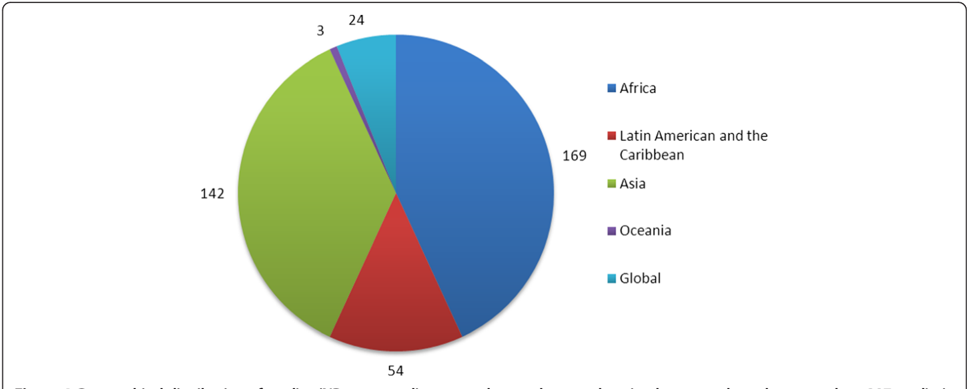
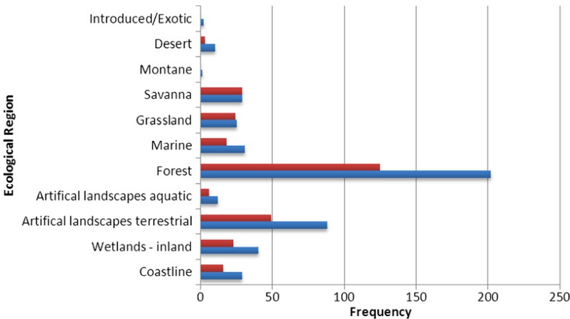
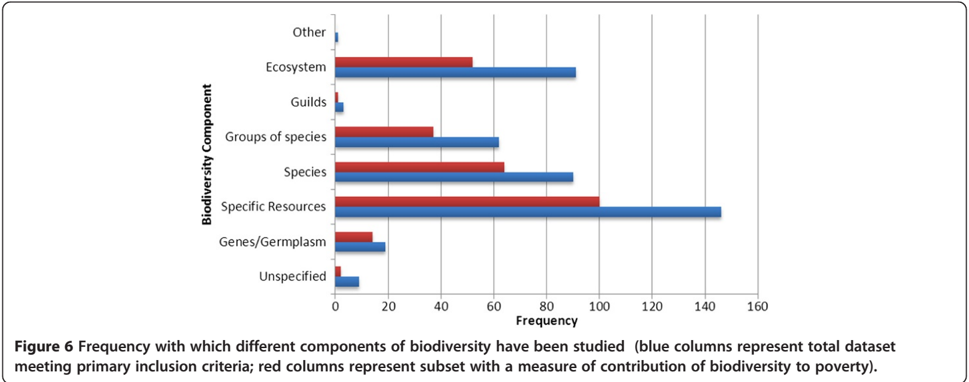
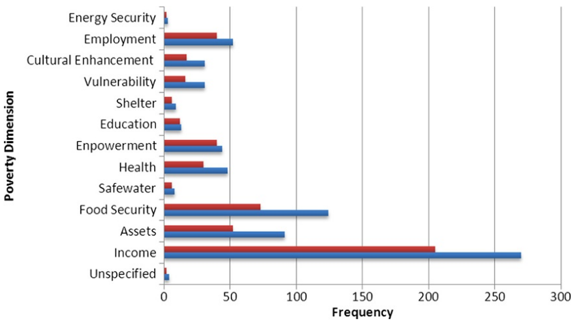
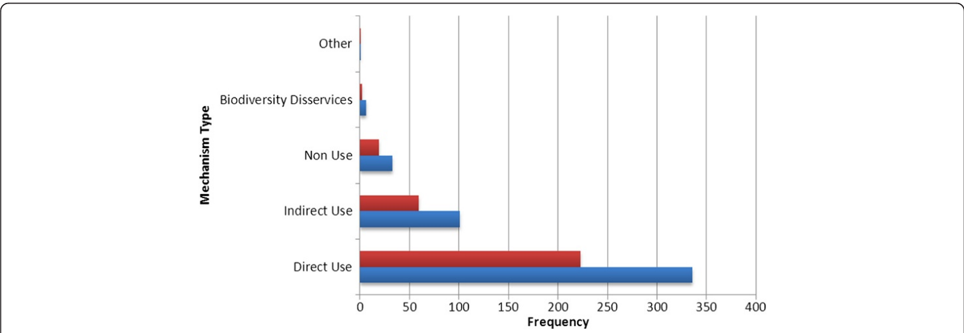
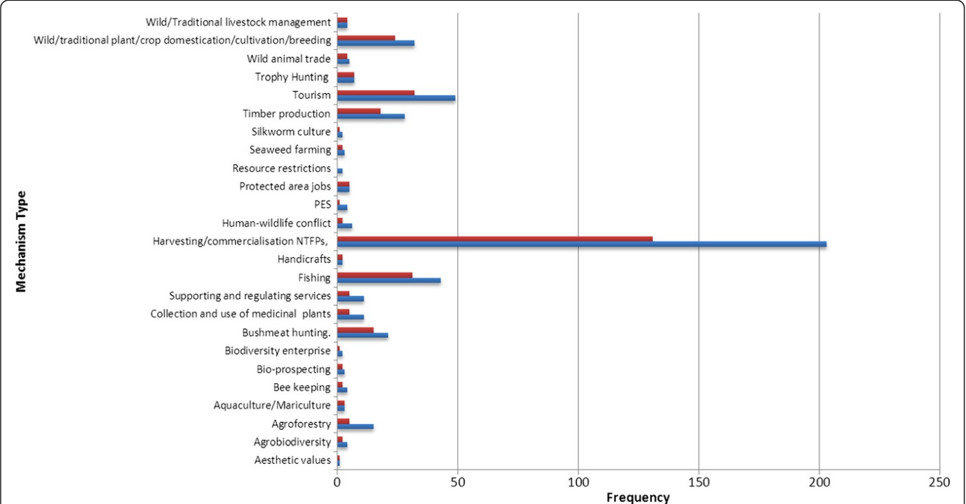
Background: There is an explicit assumption in international policy statements that biodiversity can help in efforts to tackle global poverty. This systematic map was stimulated by an interest in better understanding the evidence behind this assumption by disaggregating the terms and asking - as our review question - which components or attributes of biodiversity influence which dimensions of poverty? Methods: We employed a search strategy that covered peer-reviewed and grey literature. Relevant studies included in the map were those that described an interaction by poor people with biodiversity in non-OECD countries and documented some kind of contribution (positive or negative) to different aspects of their well-being. Results: A total of 387 studies were included in the final systematic map. Of these 248 met our additional criteria that studies should include a measure of the contribution to poverty alleviation. The studies were widely distributed geographically. Ecological distribution was less well spread, however, with the largest number of studies focussed on forests. We found studies addressing 12 different dimensions of poverty/well-being – although the most commonly studied was income. Similarly we found studies addressing all levels of biodiversity from genes to ecosystems. The largest number of studies was focussed on groups of resources – particularly non-timber forest products. In most cases, abundance was the attribute that made biodiversity important for poverty alleviation/well-being, while diversity was the least frequently noted attribute. Conclusions: The map highlights a number of apparent gaps in the evidence base. Very few studies documented any causal link between use of biodiversity and an impact on poverty. In the majority of the studies biodiversity was framed in terms of its value as a resource– in the form of specific goods that can be used to generate tangible benefits such as cash, food fuel. Very few studies explored the underpinning role of biodiversity in ecosystem service delivery for poverty alleviation, and fewer investigated the benefits of diversity as a form of insurance or adaptive capacity. This is where we suggest research should be prioritised.
Overview
The claims and statistics of this paper haven’t been checked yet.
Run the check — free, no account needed. It reads the open-access text and checks the sources it cites.
Integrity signals
Registry
Cites
Statistics
Figures
Verification
Claims the paper makes
The claims and statistics of this paper haven’t been checked yet.
Run the check — free, no account needed. It reads the open-access text and checks the sources it cites.
Claims other papers make about this one
Each is checked against this paper’s own text: does it say what the citing paper says it does?
The cited source says what the claim attributes to it.
In the citing paper
“Systematic reviews typically screen the first 50 to 100 search records within Google Scholar e.g. [18,19,20], sometimes restricting searches to title rather than full-text searches e.g. [21].”
From The role of google scholar in evidence reviews and its applicability to grey literature searching (2015) · cites this paper as [20]
Self-check
Percentages, sums and reported differences re-computed from the paper’s own numbers.
The self-check needs the paper’s full text.
Citations
Cites
Sen, A. (2009) · Rugman Reviews · doi:10.1007/978-1-137-28787-8_94 · Cited by 15,837
Clapp, J., & Sen, A. (1999) · International Journal · doi:10.2307/40203469 · Cited by 13,411
Global Biodiversity: Indicators of Recent Declines
Butchart, S. H. M., Walpole, M., Collen, B., van Strien, A., Scharlemann, J. P. W., Almond, R. E. A., Baillie, J. E. M., Bomhard, B., Brown, C., Bruno, J., et al. (2010) · Science · doi:10.1126/science.1187512 · Cited by 4,892
The Millennium Development Goals Report
(2018) · Human Rights Documents online · doi:10.1163/2210-7975_hrd-9927-2015002 · Cited by 3,609
Ecosystems and Human Well-Being: Biodiversity Synthesis
Duraiappah, A. K., Naeem, S., WRI, & Millennium Ecosystems Assessment Board (2005) · Cited by 2,836
World development report 2000/2001 : attacking poverty
Kanbur, R., Calvo, C. M., Gupta, M. D., Grootaert, C. M., Kwakwa, V., & Lustig, N. C. (2001) · Cited by 2,753
Millennium Ecosystem Assessment
(2012) · Strategic Environmental Assessment · doi:10.4324/9781849772631-19 · Cited by 2,617
Biodiversity and ecosystem services: A multilayered relationship
Mace, G. M., Norris, K., & Fitter, A. H. (2012) · Trends in Ecology & Evolution · doi:10.1016/j.tree.2011.08.006 · Cited by 1,832
Economic Reasons for Conserving Wild Nature
Balmford, A., Bruner, A., Cooper, P., Costanza, R., Farber, S., Green, R. E., Jenkins, M., Jefferiss, P., Jessamy, V., Madden, J., et al. (2002) · Science · doi:10.1126/science.1073947 · Cited by 1,454
World Development Report 2000/2001
Bank, W. (2001) · doi:10.1596/0-1952-1129-4 · Cited by 1,008
The Millennium Development Goals Report 2010
Nations, U. (2010) · Millennium Development Goals Report · doi:10.18356/00399789-en · Cited by 829
Ecosystems and Human Well-Being: Desertification Synthesis
Adeel, Z., Safriel, U. N., Niemeijer, D., & White, R. (2005) · Cited by 735
The Economics of Ecosystems and Biodiversity: Recent Instances for Debate
Rodríguez-Labajos, B., & Martínez-Alier, J. (2013) · Conservation and Society · doi:10.4103/0972-4923.125744 · Cited by 637
The Millennium Development Goals Report 2011
Nations, U. (2011) · Millennium Development Goals Report · doi:10.18356/c495b58e-en · Cited by 382
On biodiversity conservation and poverty traps
Barrett, C. B., Travis, A. J., & Dasgupta, P. (2011) · Proceedings of the National Academy of Sciences · doi:10.1073/pnas.1011521108 · Cited by 321
Chronic Poverty: Meanings and Analytical Frameworks
Hulme, D., Moore, K., & Shepherd, A. (2001) · SSRN Electronic Journal · doi:10.2139/ssrn.1754546 · Cited by 293
Conservation, evidence and policy
Adams, W. M., & Sandbrook, C. G. (2013) · Oryx · doi:10.1017/s0030605312001470 · Cited by 249
Self-citationBiodiversity targets after 2010
Mace, G. M., Crämer, W., Díaz, S. M., Faith, D. P., Larigauderie, A., Prestre, P. L., Palmer, M. A., Perrings, C. A., Scholes, R. J., Walpole, M., et al. (2010) · Current Opinion in Environmental Sustainability · doi:10.1016/j.cosust.2010.03.003 · Cited by 185
Cost-Benefit Analysis and the Environment: Recent Developments
OECD (2006) · OECD eBooks · doi:10.1787/9789264010055-en · Cited by 160
Belcher, B. M. (2003) · International Forestry Review · doi:10.1505/ifor.5.2.161.17408 · Cited by 151
Conserving dryland biodiversity
Crawhall, N. T., Davies, J., Dudley, N., Gudka, M., Henwood, W. D., MacKinnon, K., Poulsen, L., Schulte‐Herbrüggen, B., & Smith, J. (2012) · IUCN eBooks · Cited by 85
Randall, N., & James, K. L. (2012) · Environmental Evidence · doi:10.1186/2047-2382-1-4 · Cited by 69
Chronic Poverty Research Centre Working Paper 2: Chronic Poverty: Meanings and Analytical Frameworks
Hulme, D., Moore, K., & Shepherd, A. (2001) · Cited by 60
Poverty alleviation and biodiversity conservation: a South African perspective
Kepe, T., Saruchera, M., & Whande, W. (2004) · Oryx · doi:10.1017/s0030605304000262 · Cited by 57
Biodiversity conservation and poverty alleviation: exploring the evidence for a link
(2013) · Choice Reviews Online · doi:10.5860/choice.51-0261 · Cited by 57
Does Conserving Biodiversity Work to Reduce Poverty? A State of Knowledge Review
Leisher, C., Sanjayan, M., Blockhus, J. M., Larsen, N., & Kontoleon, A. V. (2012) · Wiley eBooks · doi:10.1002/9781118428351.ch9 · Cited by 32
OECD (2006) · OECD eBooks · doi:10.1787/9789264010055-7-en · Cited by 27
Evidence-based conservation and evidence-informed policy: a response to Adams & Sandbrook
Haddaway, N., & Pullin, A. S. (2013) · Oryx · doi:10.1017/s0030605313000811 · Cited by 25
Dependence of the Poor on Biodiversity: Which Poor, What Biodiversity?
Vira, B., & Kontoleon, A. V. (2012) · Wiley eBooks · doi:10.1002/9781118428351.ch4 · Cited by 16
Roe, D., Sandbrook, C. G., Fancourt, M., Schulte‐Herbrüggen, B., Munroe, R., & Sibanda, M. (2013) · Environmental Evidence · doi:10.1186/2047-2382-2-8 · Cited by 14
Self-citationSuich, H., & Directorate, E. (2012) · Cited by 4
Sandbrook, C. G. (2013) · Cited by 2
Self-citationGlobal Biodiversity: Indicators of Recent Declines
Butchart, S. H. M., Walpole, M., Collen, B., Strien, A. J. V., Scharlemann, J. P. W., Almond, R. E. A., Baillie, J. E. M., Bomhard, B., Brown, C., Bruno, J., et al. (2010) · Zenodo (CERN European Organization for Nuclear Research) · doi:10.5281/zenodo.18198680
Research works printed but not linked: 6
- SCBD: Decision VI/26: Strategic Plan for the Convention on Biological Diversity. Montreal: Secretariat of the Convention on Biological Diversity; 2002.
- SCBD: Decision X/2: Strategic Plan for Biodiversity 2011–2020. Montreal: Secretariat of the Convention on Biological Diversity; 2010.
- Millennium Ecosystem Assessment: Ecosystems and Human Wellbeing – Biodiversity Synthesis. Washington DC: World Resources Institute; 2005.
- Tekelenburg A, ten Brink BJE, Witmer MCH: How do Biodiversity and Poverty Relate? An Explorative Study. Bilthoven: Netherlands Environmental Assessment Agency; 2009.
- Clapton J, Rutter D, Sharif N: SCIE Systematic mapping guidance. UK: Social Care Institute for Excellence; 2009.
- Lincoln Fishpool: Pers Comm. 2011.
Cited by
The role of google scholar in evidence reviews and its applicability to grey literature searching
Haddaway, N. R., Collins, A. M., Coughlin, D., & Kirk, S. (2015) · PLOS ONE · doi:10.1371/journal.pone.0138237 · Cited by 2,387
A methodology for systematic mapping in environmental sciences
James, K. L., Randall, N. P., & Haddaway, N. R. (2016) · Environmental Evidence · doi:10.1186/s13750-016-0059-6 · Cited by 769
A rapid method to increase transparency and efficiency in web-based searches
Haddaway, N. R., Collins, A. M., Coughlin, D., & Kirk, S. (2017) · Environmental Evidence · doi:10.1186/s13750-016-0079-2 · Cited by 129
Metadata
- Authors
- Roe, D., Fancourt, M., Sandbrook, C., Sibanda, M., Giuliani, A., & Gordon-Maclean, A.
- Venue
- Environmental Evidence
- Published
- 2014-02-19
- Volume
- 3
- Issue
- 1
- ISSN
- 2047-2382
- Cited by
- 38
- References
- 33
- Language
- en
- Licence
- creativecommons.org/licenses/by/4.0 (tdm)
- creativecommons.org/licenses/by/4.0 (vor)
About these checks
Registry, retraction, Cites and statistics results are computed, not judged, with one exception: a printed reference that no index lists is read once by a model before it counts as a citation error. Claims are extracted by a model and kept only when their quote appears verbatim in the text; each cited source is then checked, with a model’s help, for whether it says what the claim relies on. Those verdicts can be wrong — read the claim’s quote and the cited source before relying on one.
Statistics and arithmetic are recomputed, not judged.
Confidence bands are shown only for fields calibrated on our annotated test set. None is calibrated yet, so no band is shown.
What counts as a claim ›How we measure confidence ›How we check this ›
Are you an author, or do you see a problem with this page? Request a review
Data sources
Bibliographic data: Semantic Scholar, OpenAlex, Crossref.
Contains information from the Semantic Scholar Academic Graph Datasets, made available under the ODC Attribution License (ODC-BY 1.0).
Semantic Scholar’s data is described in: Kinney, R., et al. (2023). The Semantic Scholar Open Data Platform. arXiv:2301.10140.
