

The DOI matches its Crossref record; 6 of the 6 references it cites were found in a registry or an index.
Signaling pathways have an inherent need for noise to acquire information
Open accessPublished version of a preprint
Abstract
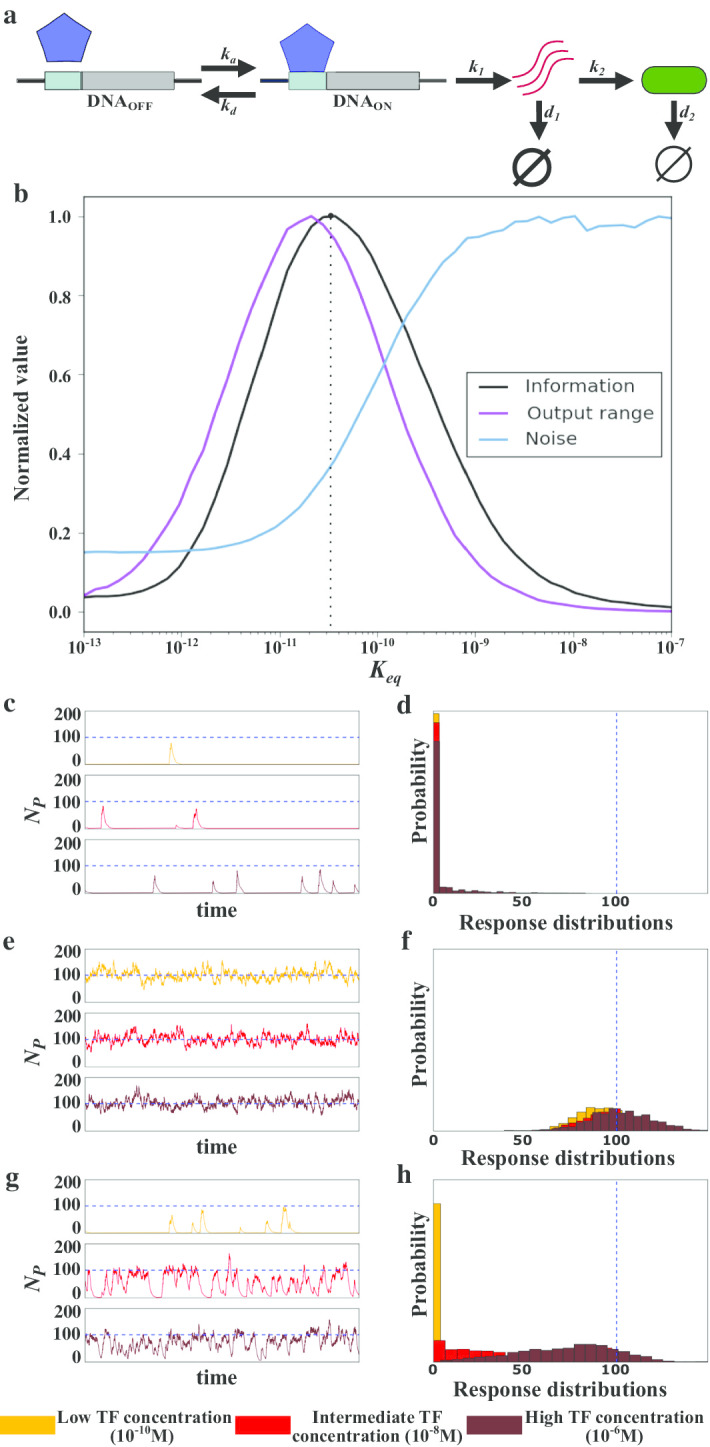
Background: All living systems acquire information about their environment. At the cellular level, they do so through signaling pathways. Such pathways rely on reversible binding interactions between molecules that detect and transmit the presence of an extracellular cue or signal to the cell’s interior. These interactions are inherently stochastic and thus noisy. On the one hand, noise can cause a signaling pathway to produce the same response for different stimuli, which reduces the amount of information a pathway acquires. On the other hand, in processes such as stochastic resonance, noise can improve the detection of weak stimuli and thus the acquisition of information. It is not clear whether the kinetic parameters that determine a pathway’s operation cause noise to reduce or increase the acquisition of information. Results: We analyze how the kinetic properties of the reversible binding interactions used by signaling pathways affect the relationship between noise, the response to a signal, and information acquisition. Our results show that, under a wide range of biologically sensible parameter values, a noisy dynamic of reversible binding interactions is necessary to produce distinct responses to different stimuli. As a consequence, noise is indispensable for the acquisition of information in signaling pathways. Conclusions: Our observations go beyond previous work by showing that noise plays a positive role in signaling pathways, demonstrating that noise is essential when such pathways acquire information.
Overview
The claims and statistics of this paper haven’t been checked yet.
Run the check — free, no account needed. It reads the open-access text and checks the sources it cites.
Integrity signals
Registry
Cites
Statistics
Figures
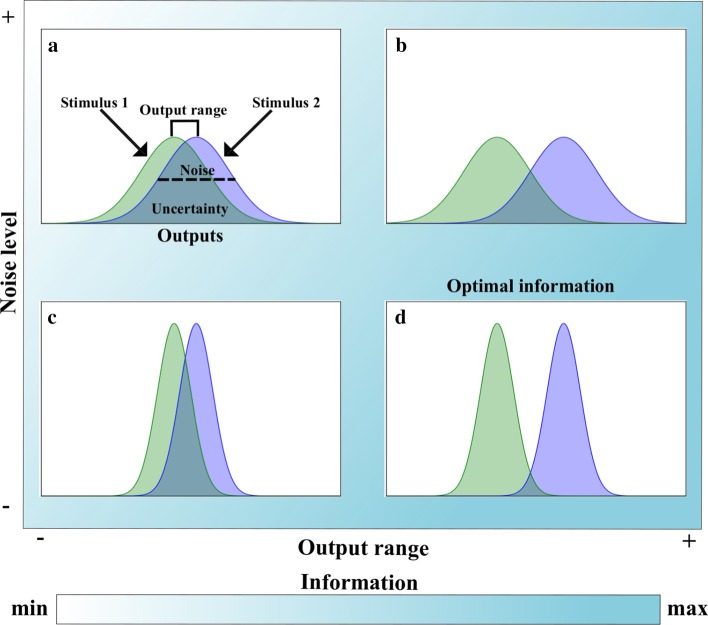
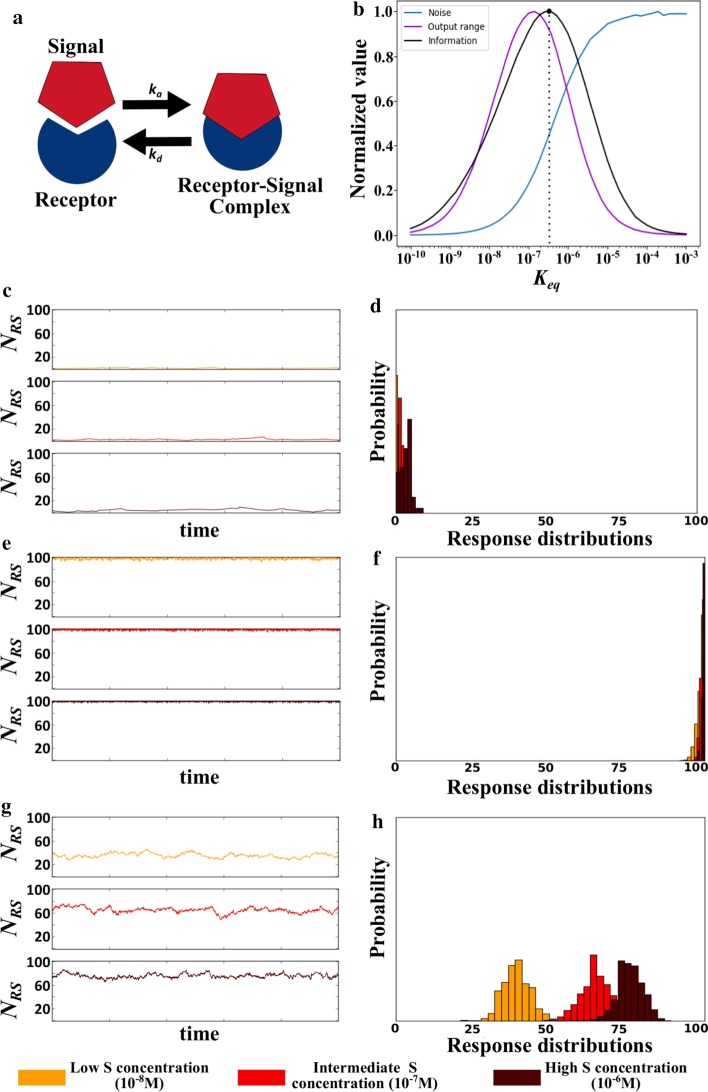
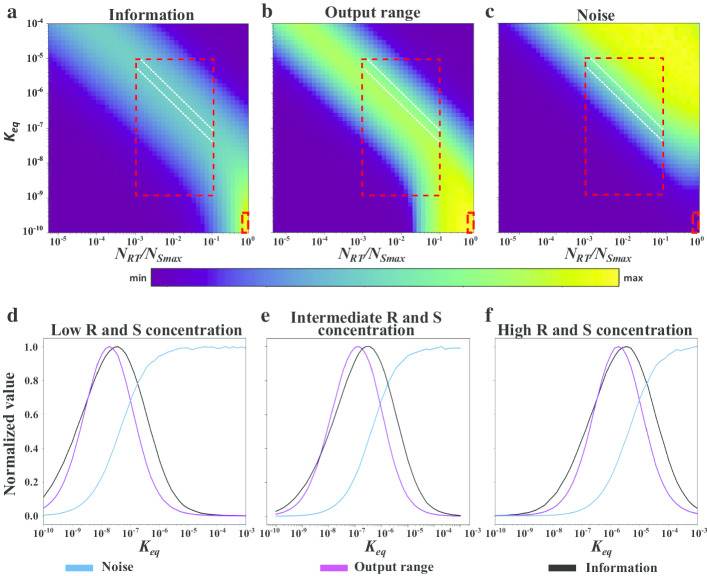
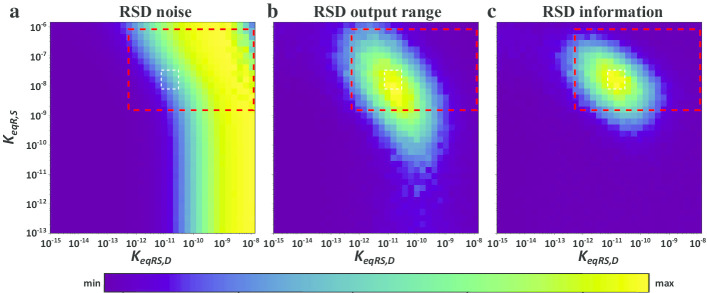
Verification
Claims the paper makes
The claims and statistics of this paper haven’t been checked yet.
Run the check — free, no account needed. It reads the open-access text and checks the sources it cites.
Self-check
Percentages, sums and reported differences re-computed from the paper’s own numbers.
The self-check needs the paper’s full text.
Citations
Cites
Global quantification of mammalian gene expression control
Schwanhäusser, B., Busse, D., Li, N., Dittmar, G., Schuchhardt, J., Wolf, J., Chen, W., & Selbach, M. (2011) · Nature · doi:10.1038/nature10098 · Cited by 6,566
Intrinsic noise in gene regulatory networks
Thattai, M., & van Oudenaarden, A. (2001) · Proceedings of the National Academy of Sciences · doi:10.1073/pnas.151588598 · Cited by 1,428
What Is Stochastic Resonance? Definitions, Misconceptions, Debates, and Its Relevance to Biology
McDonnell, M. D., & Abbott, D. (2009) · PLoS Computational Biology · doi:10.1371/journal.pcbi.1000348 · Cited by 774
Sharova, L. V., Sharov, A. A., Nedorezov, T., Piao, Y., Shaik, N., & Ko, M. S. H. (2009) · DNA Research · doi:10.1093/dnares/dsn030 · Cited by 591
Animal Transcription Networks as Highly Connected, Quantitative Continua
Biggin, M. D. (2011) · Developmental Cell · doi:10.1016/j.devcel.2011.09.008 · Cited by 308
Recurrent design patterns in the feedback regulation of the mammalian signalling network
Legewie, S., Herzel, H., Westerhoff, H. V., & Blüthgen, N. (2008) · Molecular Systems Biology · doi:10.1038/msb.2008.29 · Cited by 112
Research works printed but not linked: 81
- Bowsher CG, Swain PS. Environmental sensing, information transfer, and cellular decision-making. Curr Opin Biotechnol. 2014;28:149–55. · DOI
- Laidre ME, Johnstone RA. Animal signals. Curr Biol. 2013;23(18):R829–33. · DOI
- Cantley LC. Signal transduction: principles, pathways, and processes. Cold Spring Harbor: Cold Spring Harbor Laboratory; 2014.
- Boyer PD, Krebs EG, Tamanoi F, editors. The enzymes. 3d ed. New York: Academic Press; 1970.
- Pilpel Y. Noise in biological systems: pros, cons, and mechanisms of control. In: Castrillo JI, Oliver SG, editors. Yeast systems biology [Internet]. Totowa: Humana Press; 2011 [cited 2019 Aug 9]. p. 407–25. https://doi.org/10.1007/978-1-61779-173-4_23. · DOI
- Tsimring LS. Noise in biology. Rep Prog Phys. 2014;77(2):026601. · DOI
- Selimkhanov J, Taylor B, Yao J, Pilko A, Albeck J, Hoffmann A, et al. Accurate information transmission through dynamic biochemical signaling networks. Science. 2014;346(6215):1370–3. · DOI
- Uda S, Saito TH, Kudo T, Kokaji T, Tsuchiya T, Kubota H, et al. Robustness and compensation of information transmission of signaling pathways. Science. 2013;341(6145):558–61. · DOI
- Cheong R, Rhee A, Wang CJ, Nemenman I, Levchenko A. Information transduction capacity of noisy biochemical signaling networks. Science. 2011;334(6054):354–8. · DOI
- Tkacik G, Callan CG, Bialek W. Information flow and optimization in transcriptional regulation. Proc Natl Acad Sci. 2008;105(34):12265–70. · DOI
- Tkačik G, Walczak AM, Bialek W. Optimizing information flow in small genetic networks. Phys Rev E [Internet]. 2009 Sep 29 [cited 2019 Aug 9];80(3). https://doi.org/10.1103/PhysRevE.80.031920. · DOI
- Eldar A, Elowitz MB. Functional roles for noise in genetic circuits. Nature. 2010;467(7312):167–73. · DOI
- Bravi B, Longo G. The unconventionality of nature: biology, from noise to functional randomness. In: Calude CS, Dinneen MJ, editors. Unconventional computation and natural computation [Internet]. Cham: Springer; 2015 [cited 2020 May 6]. p. 3–34. (Lecture notes in computer science; vol. 9252). https://doi.org/10.1007/978-3-319-21819-9_1. · DOI
- Fraser D, Kaern M. A chance at survival: gene expression noise and phenotypic diversification strategies. Mol Microbiol. 2009;71(6):1333–40. · DOI
- Chalancon G, Ravarani CNJ, Balaji S, Martinez-Arias A, Aravind L, Jothi R, et al. Interplay between gene expression noise and regulatory network architecture. Trends Genet. 2012;28(5):221–32. · DOI
- Gonze D, Gérard C, Wacquier B, Woller A, Tosenberger A, Goldbeter A, et al. Modeling-based investigation of the effect of noise in cellular systems. Front Mol Biosci. 2018;5:34. · DOI
- Moss F. Stochastic resonance and sensory information processing: a tutorial and review of application. Clin Neurophysiol. 2004;115(2):267–81. · DOI · Paper page
- Rodrigo G. Insights about collective decision-making at the genetic level. Biophys Rev. 2020;12(1):19–24. · DOI
- Rodrigo G, Poyatos JF. Genetic redundancies enhance information transfer in noisy regulatory circuits. PLoS Comput Biol. 2016;12(10):e1005156. · DOI
- Stocks NG. Suprathreshold Stochastic Resonance in Multilevel Threshold Systems. Phys Rev Lett. 2000;84(11):2310–3. · DOI
- Lestas I, Vinnicombe G, Paulsson J. Fundamental limits on the suppression of molecular fluctuations. Nature. 2010;467(7312):174–8. · DOI
- Bowsher CG, Voliotis M, Swain PS. The fidelity of dynamic signaling by noisy biomolecular networks. PLoS Comput Biol. 2013;9(3):e1002965. · DOI
- Kellogg RA, Tay S. Noise facilitates transcriptional control under dynamic inputs. Cell. 2015;160(3):381–92. · DOI
- Suderman R, Bachman JA, Smith A, Sorger PK, Deeds EJ. Fundamental trade-offs between information flow in single cells and cellular populations. Proc Natl Acad Sci USA. 2017;114(22):5755–60. · DOI
- Cover TM, Thomas JA. Elements of information theory. 2nd ed. Hoboken: Wiley-Interscience; 2006.
- Rhee A, Cheong R, Levchenko A. The application of information theory to biochemical signaling systems. Phys Biol. 2012;9(4):045011. · DOI
- Donaldson-Matasci MC, Bergstrom CT, Lachmann M. The fitness value of information. Oikos. 2010;119(2):219–30. · DOI
- Wagner A. From bit to it: how a complex metabolic network transforms information into living matter. BMC Syst Biol [Internet]. 2007 [cited 2019 Aug 9];1(1). https://doi.org/10.1186/1752-0509-1-33. · DOI
- McNamara JM, Dall SRX. Information is a fitness enhancing resource. Oikos. 2010;119(2):231–6. · DOI
- Tkačik G, Walczak AM, Bialek W. Optimizing information flow in small genetic networks. III. A self-interacting gene. Phys Rev E [Internet]. 2012 April 5 [cited 2019 Aug 9];85(4). https://doi.org/10.1103/PhysRevE.85.041903 · DOI
- Corzo J. Time, the forgotten dimension of ligand binding teaching. Biochem Mol Biol Educ. 2006;34(6):413–6. · DOI
- Lusk RW, Eisen MB. Evolutionary mirages: selection on binding site composition creates the illusion of conserved grammars in Drosophila enhancers. PLoS Genet. 2010;6(1):e1000829. · DOI
- Bilu Y, Barkai N. The design of transcription-factor binding sites is affected by combinatorial regulation. Genome Biol. 2005;6(12):R103. · DOI
- Sever R, Glass CK. Signaling by nuclear receptors. Cold Spring Harb Perspect Biol. 2013;5(3):a016709. · DOI · Paper page
- Raj A, van Oudenaarden A. Single-molecule approaches to stochastic gene expression. Annu Rev Biophys. 2009;38(1):255–70. · DOI
- Kepler TB, Elston TC. Stochasticity in transcriptional regulation: origins, consequences, and mathematical representations. Biophys J. 2001;81(6):3116–36. · DOI
- Rieckh G, Tkačik G. Noise and information transmission in promoters with multiple internal states. Biophys J. 2014;106(5):1194–204. · DOI
- Langer A, Schräml M, Strasser R, Daub H, Myers T, Heindl D, et al. Polymerase/DNA interactions and enzymatic activity: multi-parameter analysis with electro-switchable biosurfaces. Sci Rep. 2015;5(1):12066. · DOI
- Fraser HB, Hirsh AE, Giaever G, Kumm J, Eisen MB. Noise minimization in eukaryotic gene expression. PLoS Biol. 2004;2(6):e137. · DOI
- Hanna J, Saha K, Pando B, van Zon J, Lengner CJ, Creyghton MP, et al. Direct cell reprogramming is a stochastic process amenable to acceleration. Nature. 2009;462(7273):595–601. · DOI · Paper page
- Arias AM, Hayward P. Filtering transcriptional noise during development: concepts and mechanisms. Nat Rev Genet. 2006;7(1):34–44. · DOI
- Rao CV, Wolf DM, Arkin AP. Control, exploitation and tolerance of intracellular noise. Nature. 2002;420(6912):231–7. · DOI · Paper page
- Chang HH, Hemberg M, Barahona M, Ingber DE, Huang S. Transcriptome-wide noise controls lineage choice in mammalian progenitor cells. Nature. 2008;453(7194):544–7. · DOI
- Hebenstreit D, Deonarine A, Babu MM, Teichmann SA. Duel of the fates: the role of transcriptional circuits and noise in CD4+ cells. Curr Opin Cell Biol. 2012;24(3):350–8. · DOI · Paper page
- Arkin A, Ross J, McAdams HH. Stochastic kinetic analysis of developmental pathway bifurcation in phage lambda-infected Escherichia coli cells. Genetics. 1998;149(4):1633–48. · DOI
- Bhogale PM, Sorg RA, Veening J-W, Berg J. What makes the lac-pathway switch: identifying the fluctuations that trigger phenotype switching in gene regulatory systems. Nucleic Acids Res. 2014;42(18):11321–8. · DOI
- Karig D, Martini KM, Lu T, DeLateur NA, Goldenfeld N, Weiss R. Stochastic Turing patterns in a synthetic bacterial population. Proc Natl Acad Sci USA. 2018;115(26):6572–7. · DOI
- Meyer HM, Roeder AHK. Stochasticity in plant cellular growth and patterning. Front Plant Sci [Internet]. 2014 Sep 8 [cited 2020 May 6];5. https://doi.org/10.3389/fpls.2014.00420/abstract. · DOI
- Guerriero ML, Pokhilko A, Fernández AP, Halliday KJ, Millar AJ, Hillston J. Stochastic properties of the plant circadian clock. J R Soc Interface. 2012;9(69):744–56. · DOI
- Guerriero ML, Akman OE, van Ooijen G. Stochastic models of cellular circadian rhythms in plants help to understand the impact of noise on robustness and clock structure. Front Plant Sci [Internet]. 2014 Oct 21 [cited 2020 May 6];5. https://doi.org/10.3389/fpls.2014.00564/abstract. · DOI
- Samoilov M, Plyasunov S, Arkin AP. Stochastic amplification and signaling in enzymatic futile cycles through noise-induced bistability with oscillations. Proc Natl Acad Sci. 2005;102(7):2310–5. · DOI
- Forger DB, Peskin CS. Stochastic simulation of the mammalian circadian clock. Proc Natl Acad Sci. 2005;102(2):321–4. · DOI
- Thurley K, Tovey SC, Moenke G, Prince VL, Meena A, Thomas AP, et al. Reliable encoding of stimulus intensities within random sequences of intracellular Ca2+ spikes. Sci Signal. 2014;7(331):59. · DOI
- Furusawa C, Kaneko K. Theory of robustness of irreversible differentiation in a stem cell system: chaos hypothesis. J Theor Biol. 2001;209(4):395–416. · DOI
- Fernandez-de-Cossio-Diaz J, Mulet R, Vazquez A. Cell population heterogeneity driven by stochastic partition and growth optimality. Sci Rep. 2019;9(1):9406. · DOI
- Acar M, Mettetal JT, van Oudenaarden A. Stochastic switching as a survival strategy in fluctuating environments. Nat Genet. 2008;40(4):471–5. · DOI
- Espinosa-Soto C, Martin OC, Wagner A. Phenotypic plasticity can facilitate adaptive evolution in gene regulatory circuits. BMC Evol Biol. 2011;11(1):5. · DOI
- Starrfelt J, Kokko H. Bet-hedging—a triple trade-off between means, variances and correlations. Biol Rev. 2012;87(3):742–55. · DOI
- Ho B, Baryshnikova A, Brown GW. Unification of protein abundance datasets yields a quantitative Saccharomyces cerevisiae proteome. Cell Syst. 2018;2:192-205.e3. · DOI
- Walczak AM, Tkačik G, Bialek W. Optimizing information flow in small genetic networks. II. Feed-forward interactions. Phys Rev E [Internet]. 2010 AprIL 6 [cited 2019 Aug 9];81(4). https://doi.org/10.1103/PhysRevE.81.041905. · DOI
- Becskei A, Serrano L. Engineering stability in gene networks by autoregulation. Nature. 2000;405(6786):590–3. · DOI
- Osella M, Bosia C, Corá D, Caselle M. The role of incoherent microRNA-mediated feedforward loops in noise buffering. PLoS Comput Biol. 2011;7(3):e1001101. · DOI
- Liu F-Y, Lo S-C, Shu C-C. The reaction of dimerization by itself reduces the noise intensity of the protein monomer. Sci Rep [Internet]. 2019 Dec [cited 2019 Aug 9];9(1). https://www.nature.com/articles/s41598-019-39611-6. · DOI
- Ghim C-M, Almaas E. Genetic noise control via protein oligomerization. BMC Syst Biol [Internet]. 2008 Dec [cited 2019 Aug 9];2(1). https://doi.org/10.1186/1752-0509-2-94. · DOI
- Bundschuh R, Hayot F, Jayaprakash C. The role of dimerization in noise reduction of simple genetic networks. J Theor Biol. 2003;220(2):261–9. · DOI
- ten Wolde PR, Becker NB, Ouldridge TE, Mugler A. Fundamental limits to cellular sensing. J Stat Phys. 2016;162(5):1395–424. · DOI
- Pahle J, Green AK, Dixon CJ, Kummer U. Information transfer in signaling pathways: a study using coupled simulated and experimental data. BMC Bioinform. 2008;9(1):139. · DOI
- Richard M, Yvert G. How does evolution tune biological noise? Front Genet [Internet]. 2014 Oct 28 [cited 2019 Aug 9];5. https://doi.org/10.3389/fgene.2014.00374/abstract. · DOI
- Bialek W, Setayeshgar S. Physical limits to biochemical signaling. Proc Natl Acad Sci USA. 2005;102(29):10040. · DOI
- Senecal A, Munsky B, Proux F, Ly N, Braye FE, Zimmer C, et al. Transcription factors modulate c-Fos transcriptional bursts. Cell Rep. 2014;8(1):75–83. · DOI
- Azpeitia E, Wagner A. Short residence times of DNA-bound transcription factors can reduce gene expression noise and increase the transmission of information in a gene regulation system. Front Mol Biosci. 2020;7:67. · DOI · Paper page
- Gillespie DT. Exact stochastic simulation of coupled chemical reactions. J Phys Chem. 1977;81(25):2340–61. · DOI
- Belikov S, Berg OG, Wrange Ö. Quantification of transcription factor-DNA binding affinity in a living cell. Nucleic Acids Res. 2015;44(7):3045–58. · DOI
- Fisher WW, Li JJ, Hammonds AS, Brown JB, Pfeiffer BD, Weiszmann R, et al. DNA regions bound at low occupancy by transcription factors do not drive patterned reporter gene expression in Drosophila. Proc Natl Acad Sci. 2012;109(52):21330–5. · DOI
- Li X-Y, Thomas S, Sabo PJ, Eisen MB, Stamatoyannopoulos JA, Biggin MD. The role of chromatin accessibility in directing the widespread, overlapping patterns of Drosophila transcription factor binding. Genome Biol. 2011;12(4):R34. · DOI · Paper page
- Lugowski A, Nicholson B, Rissland OS. Determining mRNA half-lives on a transcriptome-wide scale. Methods. 2018;137:90–8. · DOI
- Laalami S, Zig L, Putzer H. Initiation of mRNA decay in bacteria. Cell Mol Life Sci. 2014;71(10):1799–828. · DOI
- Toyama BH, Hetzer MW. Protein homeostasis: live long, won’t prosper. Nat Rev Mol Cell Biol. 2013;14(1):55–61. · DOI
- Hausser J, Mayo A, Keren L, Alon U. Central dogma rates and the trade-off between precision and economy in gene expression. Nat Commun [Internet]. 2019 Dec [cited 2019 Aug 9];10(1). https://www.nature.com/articles/s41467-018-07391-8. · DOI · Paper page
- Morisaki T, Müller WG, Golob N, Mazza D, McNally JG. Single-molecule analysis of transcription factor binding at transcription sites in live cells. Nat Commun [Internet]. 2014 Dec [cited 2019 Aug 9];5(1). https://www.nature.com/articles/ncomms5456. · DOI
- Mueller F, Stasevich TJ, Mazza D, McNally JG. Quantifying transcription factor kinetics: at work or at play? Crit Rev Biochem Mol Biol. 2013;48(5):492–514. · DOI
Metadata
- Authors
- Azpeitia, E., Balanzario, E. P., & Wagner, A.
- Affiliations
- SIB Swiss Institute of Bioinformatics (CH)
- Centro de Ciencias Matemáticas (MX)
- Corresponding author
- Wagner, Andreas
- Venue
- BMC Bioinformatics
- Published
- 2020-10-16
- Volume
- 21
- Issue
- 1
- Pages
- 462-462
- ISSN
- 1471-2105 (ISSN-L)
- PMC
- PMC7568421
- OpenAlex
- W3092838074
- Cited by
- 20
- References
- 6
- Citations by year
- 2026: 2 · 2025: 4 · 2024: 5 · 2023: 2 · 2022: 3 · 2021: 2 · 2020: 2
- FWCI
- 0.73
- Type
- journal article
- Language
- en
- Open access
- gold
- doi.org
- Locations
- BMC Bioinformatics (publishedVersion, cc-by)
- bioRxiv (Cold Spring Harbor Laboratory) (acceptedVersion, cc-by)
- PubMed Central (publishedVersion, cc-by)
- PubMed (publishedVersion)
- Zurich Open Repository and Archive (University of Zurich) (acceptedVersion, cc-by)
- DOAJ (DOAJ: Directory of Open Access Journals) (submittedVersion, cc-by-sa)
- Zurich Open Repository and Archive (University of Zurich) (submittedVersion, cc-by)
- Zurich Open Repository and Archive (University of Zurich)
- Funders
- National Science Foundation (31003A_172887)
- Schweizerischer Nationalfonds zur Förderung der Wissenschaftlichen Forschung (739874, 172887)
- H2020 European Research Council (739874)
- Topics
- Life Sciences › Biochemistry, Genetics and Molecular Biology › Molecular Biology › Gene Regulatory Network Analysis
- Physical Sciences › Physics and Astronomy › Statistical and Nonlinear Physics › stochastic dynamics and bifurcation
- Physical Sciences › Physics and Astronomy › Statistical and Nonlinear Physics › Advanced Thermodynamics and Statistical Mechanics
- Keywords
- signaling pathways, noise, information acquisition, stochastic resonance, kinetic parameters, signal detection, stochastic dynamics
- MeSH terms
- Gene Expression Regulation, Kinetics, Ligands, Models, Biological, Signal Transduction
About these checks
Registry, retraction, Cites and statistics results are computed, not judged, with one exception: a printed reference that no index lists is read once by a model before it counts as a citation error. Claims are extracted by a model and kept only when their quote appears verbatim in the text; each cited source is then checked, with a model’s help, for whether it says what the claim relies on. Those verdicts can be wrong — read the claim’s quote and the cited source before relying on one.
Statistics and arithmetic are recomputed, not judged.
Confidence bands are shown only for fields calibrated on our annotated test set. None is calibrated yet, so no band is shown.
What counts as a claim ›How we measure confidence ›How we check this ›
Are you an author, or do you see a problem with this page? Request a review
