

The DOI matches its Crossref record; 15 of the 15 references it cites were found in a registry or an index.
Seasonal and climatic variation in the incidence of adult acute appendicitis: a seven year longitudinal analysis
Open accessPublished version of a preprint
Abstract
BACKGROUND: Acute appendicitis represents an extremely common surgical emergency, yet its aetiology remains uncertain. A multifactorial understanding of its causation has emerged along with increasing evidence of seasonal variation. This study seeks to find evidence for such a circannual trend within the United Kingdom (UK), and further assess key meteorological indicators which may be causative of any such variation. METHODS: The patient records of a region health body in the North East of England were retrospectively assessed over a 7-year period. The incident cases of acute appendicitis were recorded and averaged by month before undergoing statistical analysis for variation and correlation with average temperature, sunlight hours, and rainfall. RESULTS: The incidence of acute appendicitis revealed significant seasonal variation with only 38 incident cases in the months of January compared to 73 in July, a 92.1% increase. Only a weak correlation was seen between incidence and average sunlight hours/rainfall, however a significant, positive correlation was found between incidence and average temperature (r = 0.58, p = 0.048). CONCLUSION: Compelling evidence is found to support the existence of a circannual trend for acute appendicitis. Data suggests a seasonal peak in the month of July, accompanied by a low in January, a finding that develops the understanding of this trend from previously equivocal research in the UK. A clear correlation is also established between the incidence of acute appendicitis and average temperature. The 92.1% increase between the coolest and warmest months suggests a greater magnitude for this as a risk factor than has previously been shown.
Overview
The claims and statistics of this paper haven’t been checked yet.
Run the check — free, no account needed. It reads the open-access text and checks the sources it cites.
Integrity signals
Registry
Cites
Statistics
Figures
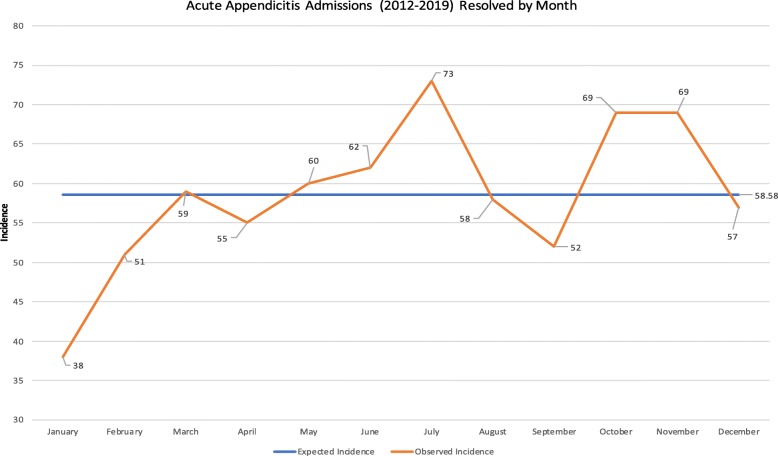
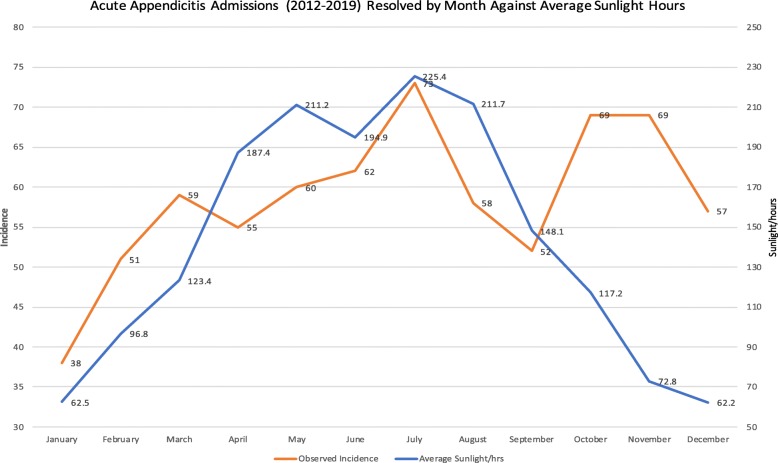
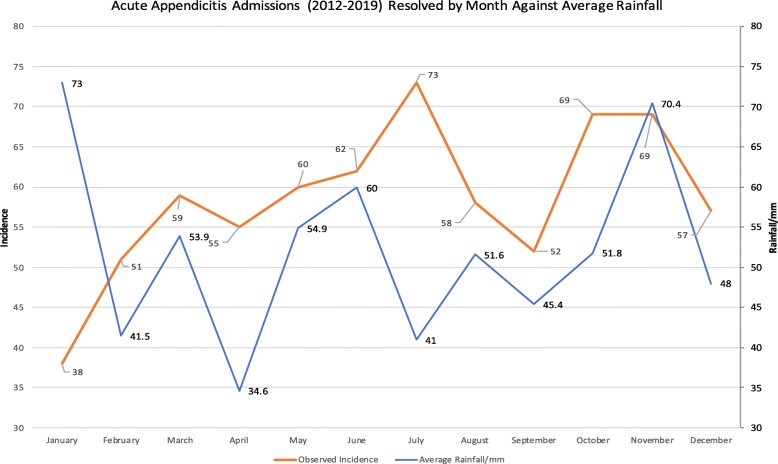
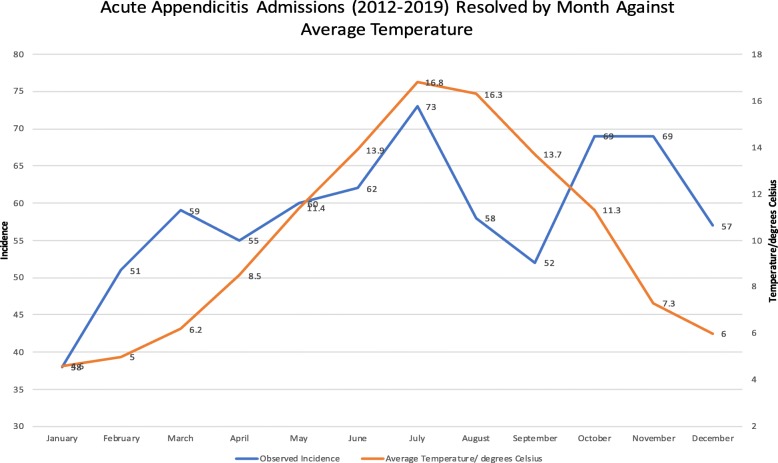
Verification
Claims the paper makes
The claims and statistics of this paper haven’t been checked yet.
Run the check — free, no account needed. It reads the open-access text and checks the sources it cites.
Claims other papers make about this one
Each is checked against this paper’s own text: does it say what the citing paper says it does?
The cited source says what the claim attributes to it.
In the citing paper
“the circannual trend of acute appendicitis is well documented indicating a seasonal peak during summer months and lower numbers during colder months. 12,13”
From Increasing incidence of complicated appendicitis during COVID-19 pandemic (2021) · cites this paper as [13]
Self-check
Percentages, sums and reported differences re-computed from the paper’s own numbers.
The self-check needs the paper’s full text.
Citations
Cites
Scandinavian Journal of Gastroenterology
Aabakken, L. (2010) · Scandinavian Journal of Gastroenterology · doi:10.3109/00365521003666533 · Cited by 520
Incidence of Acute Nonperforated and Perforated Appendicitis: Age‐specific and Sex‐specific Analysis
Kørner, H., Søndenaa, K., Søreide, J. A., Andersen, E., Nysted, A., Lende, T. H., & Kjellevold, K. H. (1997) · World Journal of Surgery · doi:10.1007/s002689900235 · Cited by 458
Annals of Medical and Health Sciences Research
(2022) · doi:10.54608/amhsr · Cited by 358
Appendicitis: Trends in incidence, age, sex, and seasonal variations in South-Western Nigeria
Oguntola, A., Adeoti, M., & Oyemolade, T. (2010) · Annals of African Medicine · doi:10.4103/1596-3519.70956 · Cited by 111
The Epidemiology of Acute Appendicitis in California
Luckmann, R., & Davis, P. J. (1991) · Epidemiology · doi:10.1097/00001648-199109000-00003 · Cited by 110
Stein, G. Y., Rath‐Wolfson, L., Zeidman, A., Atar, E., Marcus, O., Joubran, S., & Ram, E. (2012) · Langenbeck s Archives of Surgery · doi:10.1007/s00423-012-0958-0 · Cited by 78
Acute Appendicitis and Dietary Fiber
Arnbjörnsson, E. (1983) · Archives of Surgery · doi:10.1001/archsurg.1983.01390070076015 · Cited by 56
Fares, A. (2014) · Annals of Medical and Health Sciences Research · doi:10.4103/2141-9248.126603 · Cited by 46
Ilves, I., Paajanen, H., Herzig, K., Fagerström, A., & Miettinen, P. J. R. (2011) · World Journal of Surgery · doi:10.1007/s00268-011-0988-8 · Cited by 43
Temporal patterns of alcohol consumption and attempts to reduce alcohol intake in England
de Vocht, F., Brown, J., Beard, E., Angus, C., Brennan, A., Michie, S., Campbell, R. M., & Hickman, M. (2016) · BMC Public Health · doi:10.1186/s12889-016-3542-7 · Cited by 33
Cited by
Increasing incidence of complicated appendicitis during COVID-19 pandemic
Orthopoulos, G., Santone, E., Izzo, F., Tirabassi, M., Pérez-Caraballo, A. M., Corriveau, N., & Jabbour, N. (2021) · The American Journal of Surgery · doi:10.1016/j.amjsurg.2020.09.026 · Cited by 171
Burgard, M., Cherbanyk, F., Nassiopoulos, K., Malekzadeh, S., Pugin, F., & Egger, B. (2021) · PLoS ONE · doi:10.1371/journal.pone.0249171 · Cited by 65
Association of Appendicitis Incidence With Warmer Weather Independent of Season
Simmering, J. E., Polgreen, L. A., Talan, D. A., Cavanaugh, J. E., & Polgreen, P. M. (2022) · JAMA Network Open · doi:10.1001/jamanetworkopen.2022.34269 · Cited by 27
Salö, M., Tiselius, C., Rosemar, A., Öst, E., Sohlberg, S., & Andersson, R. E. (2025) · BJS Open · doi:10.1093/bjsopen/zrae165 · Cited by 33
Seasonal Variation in Cases of Acute Appendicitis
AlHarmi, R. A. R., Almahari, S. A., AlAradi, J., Alqaseer, A., Aljirdabi, N. S., & Ahmed, F. A. (2021) · Surgery Research and Practice · doi:10.1155/2021/8811898 · Cited by 12
Metadata
- Authors
- York, T. J.
- Affiliations
- Imperial College Healthcare NHS Trust (GB)
- Corresponding author
- York, Thomas James
- ORCID
- York, Thomas James
- Venue
- BMC Emergency Medicine
- Published
- 2020-04-07
- Volume
- 20
- Issue
- 1
- Pages
- 24-24
- ISSN
- 1471-227X (ISSN-L)
- PMC
- PMC7140570
- OpenAlex
- W3014718012
- Cited by
- 23
- References
- 15
- Citations by year
- 2026: 4 · 2025: 3 · 2024: 3 · 2022: 7 · 2021: 5 · 2020: 1
- FWCI
- 3.13
- Type
- journal article
- Language
- en
- Open access
- gold
- doi.org
- Locations
- BMC Emergency Medicine (publishedVersion, cc-by)
- Research Square (acceptedVersion, cc-by)
- PubMed Central (publishedVersion, cc-by)
- PubMed (publishedVersion)
- DOAJ (DOAJ: Directory of Open Access Journals) (submittedVersion, cc-by-sa)
- Topics
- Health Sciences › Medicine › Emergency Medicine › Appendicitis Diagnosis and Management
- Physical Sciences › Environmental Science › Health, Toxicology and Mutagenesis › Climate Change and Health Impacts
- Health Sciences › Medicine › Surgery › Intraperitoneal and Appendiceal Malignancies
- Keywords
- acute appendicitis, seasonal variation, circannual variation, meteorological factors, ambient temperature, sunshine duration, rainfall, appendicitis incidence
- MeSH terms
- Adult, Appendicitis, Climate, Female, United Kingdom, Humans, Longitudinal Studies, Male, Retrospective Studies, Seasons, Incidence
About these checks
Registry, retraction, Cites and statistics results are computed, not judged, with one exception: a printed reference that no index lists is read once by a model before it counts as a citation error. Claims are extracted by a model and kept only when their quote appears verbatim in the text; each cited source is then checked, with a model’s help, for whether it says what the claim relies on. Those verdicts can be wrong — read the claim’s quote and the cited source before relying on one.
Statistics and arithmetic are recomputed, not judged.
Confidence bands are shown only for fields calibrated on our annotated test set. None is calibrated yet, so no band is shown.
What counts as a claim ›How we measure confidence ›How we check this ›
Are you an author, or do you see a problem with this page? Request a review
Data sources
Bibliographic data: Semantic Scholar, OpenAlex, Crossref.
Contains information from the Semantic Scholar Academic Graph Datasets, made available under the ODC Attribution License (ODC-BY 1.0).
Semantic Scholar’s data is described in: Kinney, R., et al. (2023). The Semantic Scholar Open Data Platform. arXiv:2301.10140.
