

The DOI matches its Crossref record; 67 of the 67 references it cites were found in a registry or an index.
Combine and conquer: manganese synergizing anti-TGF-β/PD-L1 bispecific antibody YM101 to overcome immunotherapy resistance in non-inflamed cancers
Open accessAbstract
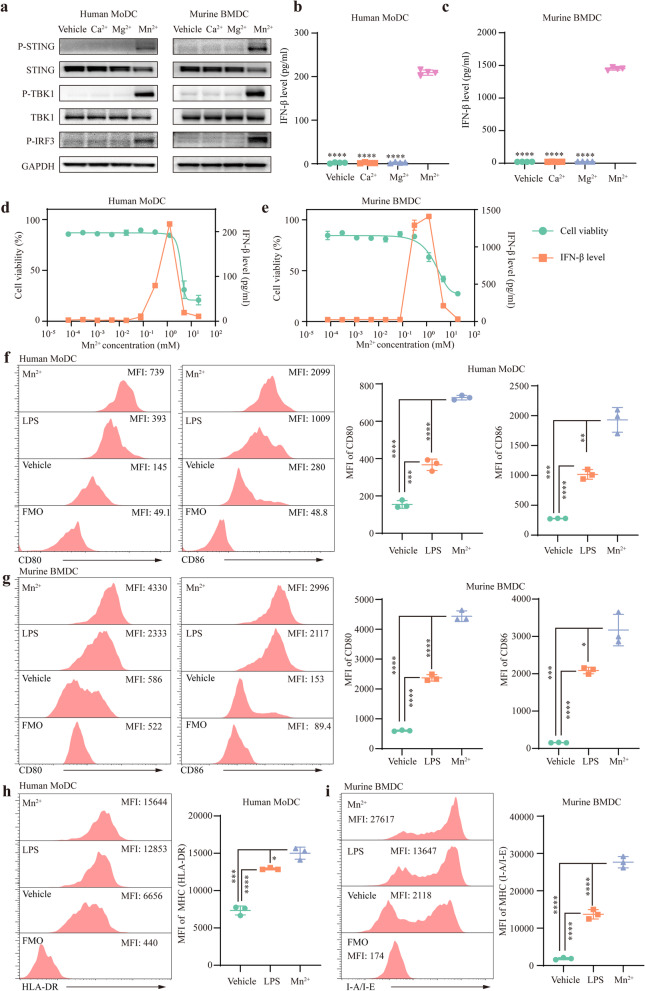
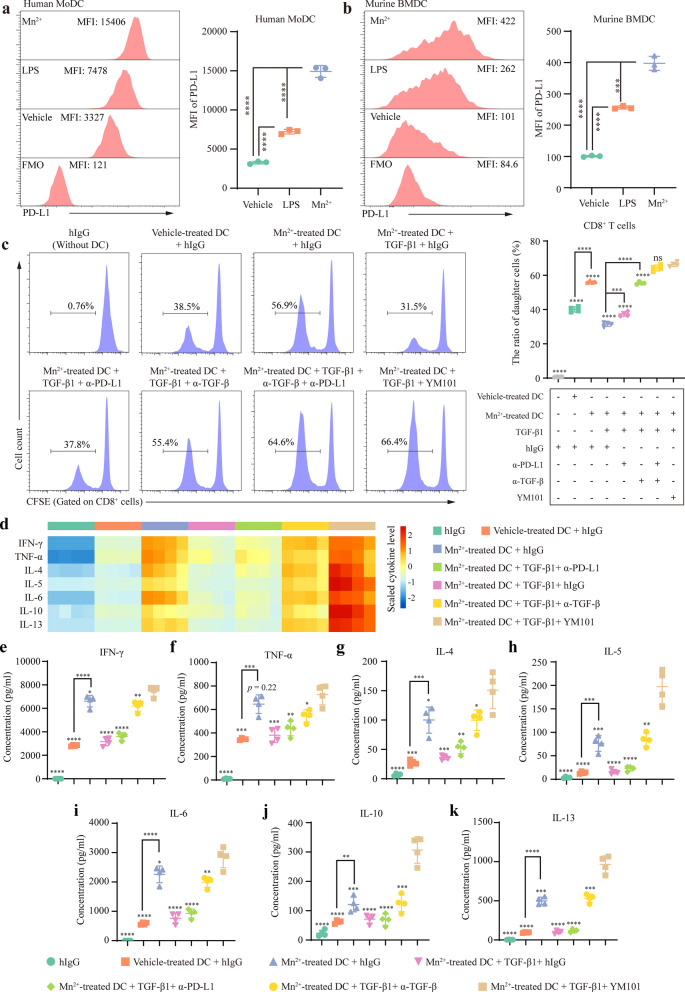
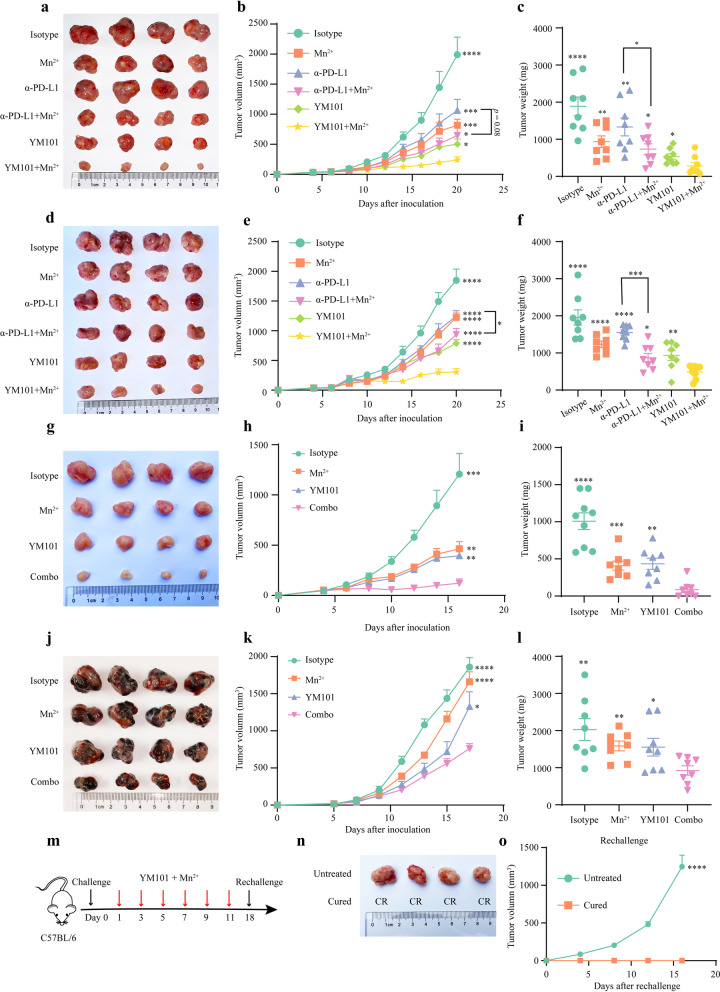
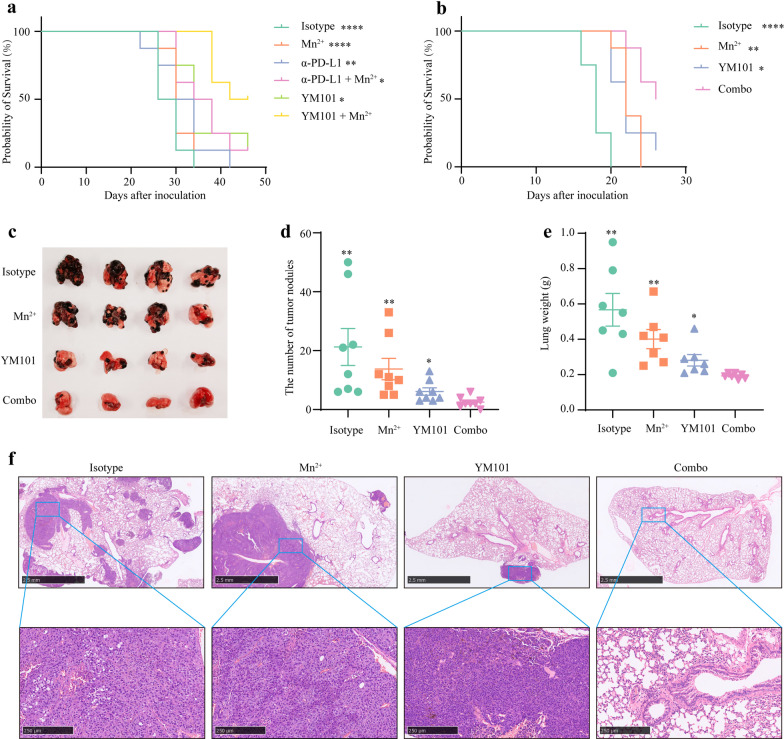
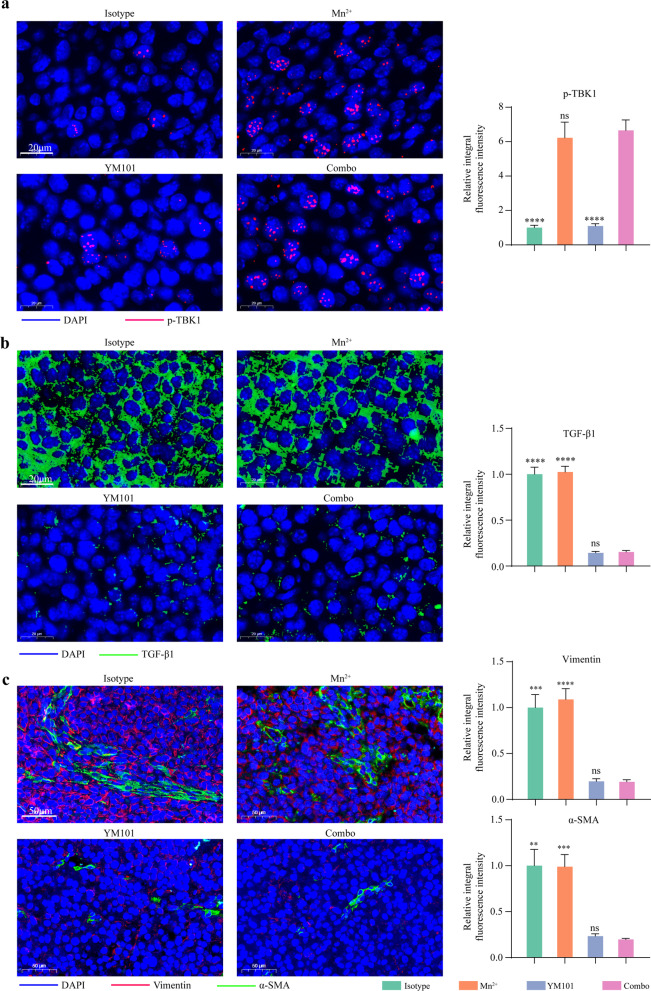
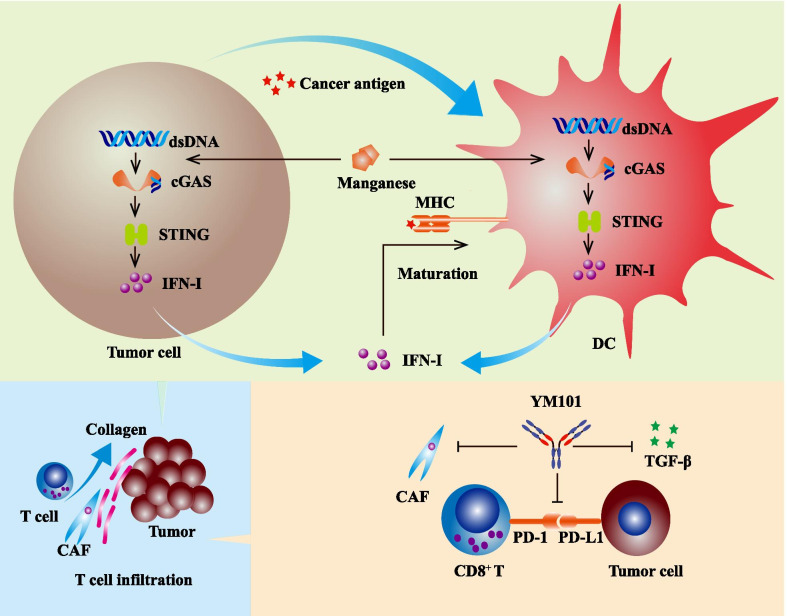
Background: Our previous work showed that the anti-TGF-β/PD-L1 bispecific antibody YM101 effectively overcame anti-PD-L1 resistance in immune-excluded tumor models. However, in immune-desert models, the efficacy of YM101 was limited. Bivalent manganese (Mn 2+) is identified as a natural stimulator of interferon genes (STING) agonist, which might enhance cancer antigen presentation and improve the therapeutic effect of YM101. Methods: The effect of Mn 2+ on STING pathway was validated by western blotting and enzyme-linked immunosorbent assay. Dendritic cell (DC) maturation was measured by flow cytometry. The synergistic effect between Mn 2+ and YM101 in vitro was determined by one-way mixed lymphocyte reaction, CFSE dilution assay, and cytokine detection. The in vivo antitumor effect of Mn 2+ plus YM101 therapy was assessed in CT26, EMT-6, H22, and B16 tumor models. Flow cytometry, RNA-seq, and immunofluorescent staining were adopted to investigate the alterations in the tumor microenvironment. Results: Mn 2+ could activate STING pathway and promote the maturation of human and murine DC. The results of one-way mixed lymphocyte reaction showed that Mn 2+ synergized YM101 in T cell activation. Moreover, in multiple syngeneic murine tumor models, Mn 2+ plus YM101 therapy exhibited a durable antitumor effect and prolonged the survival of tumor-bearing mice. Relative to YM101 monotherapy and Mn 2+ plus anti-PD-L1 therapy, Mn 2+ plus YM101 treatment had a more powerful antitumor effect and a broader antitumor spectrum. Mechanistically, Mn 2+ plus YM101 strategy simultaneously regulated multiple components in the antitumor immunity and drove the shift from immune-excluded or immune-desert to immune-inflamed tumors. The investigation in the TME indicated Mn 2+ plus YM101 strategy activated innate and adaptive immunity, enhanced cancer antigen presentation, and upregulated the density and function of tumor-infiltrating lymphocytes. This normalized TME and reinvigorated antitumor immunity contributed to the superior antitumor effect of the combination therapy. Conclusion: Combining Mn 2+ with YM101 has a synergistic antitumor effect, effectively controlling tumor growth and prolonging the survival of tumor-bearing mice. This novel cocktail strategy has the potential to be a universal regimen for inflamed and non-inflamed tumors.
Overview
The claims and statistics of this paper haven’t been checked yet.
Run the check — free, no account needed. It reads the open-access text and checks the sources it cites.
Integrity signals
Registry
Cites
Statistics
Figures
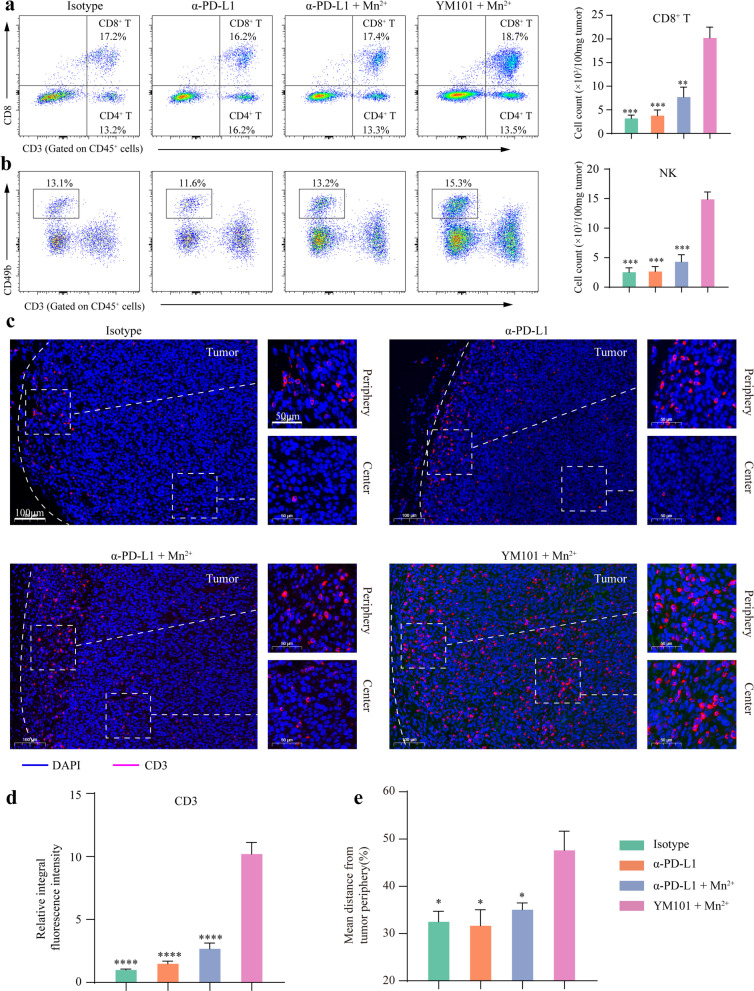
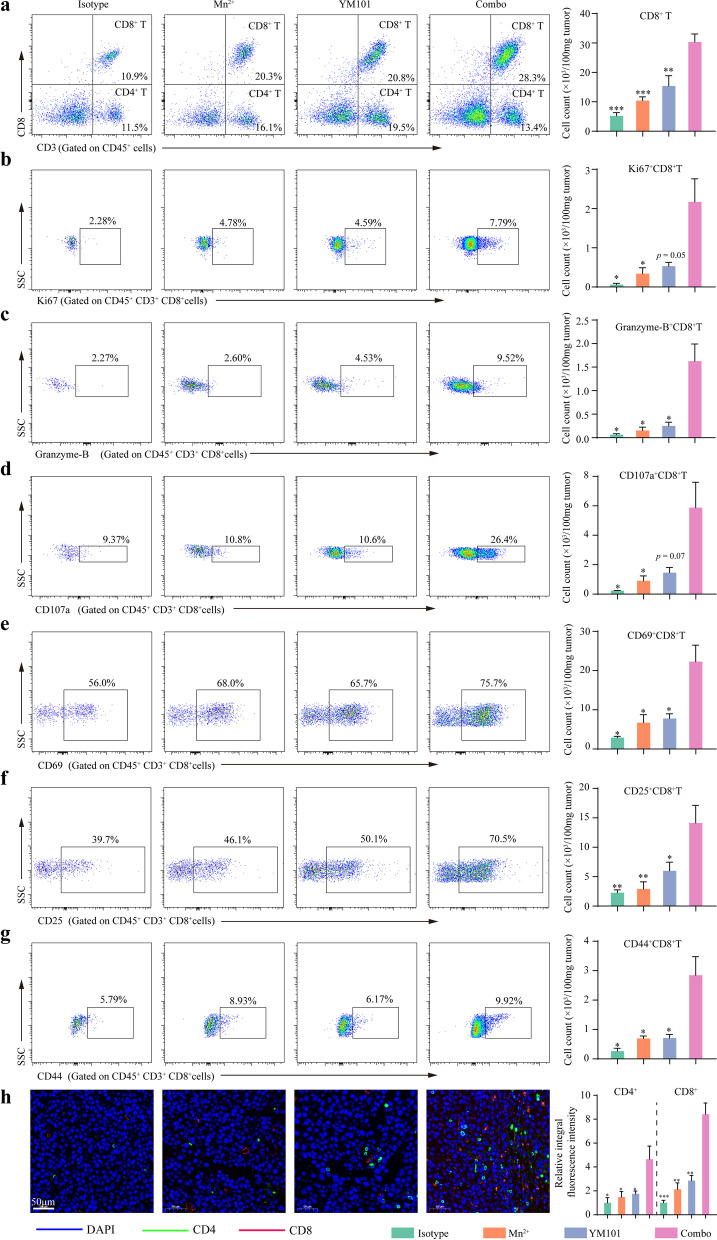
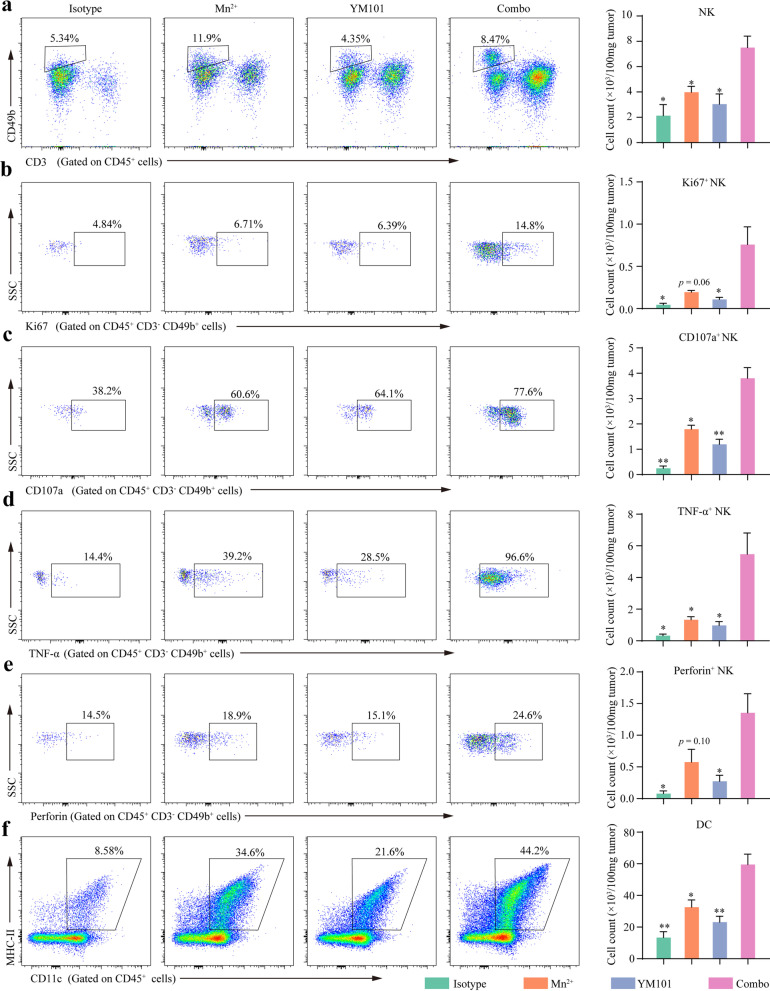
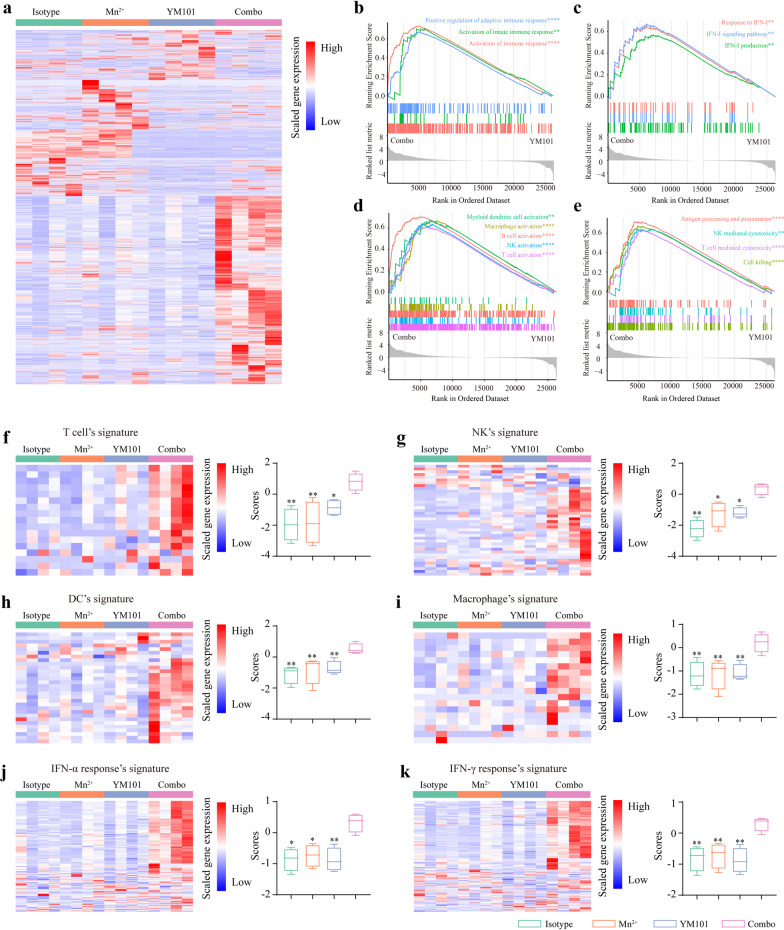
Verification
Claims the paper makes
The claims and statistics of this paper haven’t been checked yet.
Run the check — free, no account needed. It reads the open-access text and checks the sources it cites.
Claims other papers make about this one
Each is checked against this paper’s own text: does it say what the citing paper says it does?
In the citing paper
“On the other hand, α-PD-1/PD-L1 antibodies take advantage of STING agonist-induced PD-L1 upregulation [273].”
From Combination strategies with PD-1/PD-L1 blockade: current advances and future directions (2022) · cites this paper as [273]
Self-check
Percentages, sums and reported differences re-computed from the paper’s own numbers.
The self-check needs the paper’s full text.
Citations
Cites
clusterProfiler: an R Package for Comparing Biological Themes Among Gene Clusters
Yu, G., Wang, L.-G., Han, Y., & He, Q.-Y. (2012) · OMICS: A Journal of Integrative Biology · doi:10.1089/omi.2011.0118 · Cited by 36,259
PD-1 and PD-L1 Immune Checkpoint Blockade to Treat Breast Cancer
Hartkopf, A. D., Taran, F., Wallwiener, M., Walter, C. B., Krämer, B., Grischke, E., & Brucker, S. Y. (2016) · Breast Care · doi:10.1159/000453569 · Cited by 30,989
Adverse Renal Effects of Immune Checkpoint Inhibitors: A Narrative Review
Wanchoo, R., Karam, S., Uppal, N. N., Barta, V. S., Deray, G., Devoe, C., Launay‐Vacher, V., Jhaveri, K. D., & on behalf of Cancer and Kidney International Network Workgroup on Immune Checkpoint Inhibitors (2017) · American Journal of Nephrology · doi:10.1159/000455014 · Cited by 15,320
Oncology meets immunology: the cancer-immunity cycle.
Chen, D. S., & Mellman, I. (2013) · Immunity · doi:10.1016/j.immuni.2013.07.012 · Cited by 6,929
Pembrolizumab versus Ipilimumab in Advanced Melanoma
Robert, C., Schachter, J., Long, G. V., Arance, A., Grob, J. J., Mortier, L., Daud, A., Carlino, M. S., McNeil, C., Lotem, M., et al. (2015) · New England Journal of Medicine · doi:10.1056/nejmoa1503093 · Cited by 5,887
TGFβ attenuates tumour response to PD-L1 blockade by contributing to exclusion of T cells
Mariathasan, S., Turley, S. J., Nickles, D., Castiglioni, A., Yuen, K., Wang, Y., Kadel III, E. E., Koeppen, H., Astarita, J. L., Cubas, R., et al. (2018) · Nature · doi:10.1038/nature25501 · Cited by 5,400
Elements of cancer immunity and the cancer–immune set point
Chen, D. S., & Mellman, I. (2017) · Nature · doi:10.1038/nature21349 · Cited by 5,352
Tumor-associated B7-H1 promotes T-cell apoptosis: A potential mechanism of immune evasion
Dong, H., Strome, S. E., Salomao, D. R., Tamura, H., Hirano, F., Flies, D. B., Roche, P. C., Lu, J., Zhu, G., Tamada, K., et al. (2002) · Nature Medicine · doi:10.1038/nm730 · Cited by 5,025
Avelumab plus Axitinib versus Sunitinib for Advanced Renal-Cell Carcinoma
Motzer, R. J., Penkov, K., Haanen, J. B. A. G., Rini, B. I., Albiges, L. K., Campbell, M. T., Venugopal, B., Kollmannsberger, C., Négrier, S., Uemura, M., et al. (2019) · New England Journal of Medicine · doi:10.1056/nejmoa1816047 · Cited by 2,557
Zou, W., Wolchok, J. D., & Chen, L. (2016) · Science Translational Medicine · doi:10.1126/scitranslmed.aad7118 · Cited by 2,400
Cited by
Sorted by citations
Items 101–163 of 163
Metal-modulated T cell antitumor immunity and emerging metalloimmunotherapy
Liao, P., Zhou, Y., Qiu, Y., Hu, R., Li, H., Sun, H., & Li, Y. (2025) · Cancer and Metastasis Reviews · doi:10.1007/s10555-025-10266-2 · Cited by 6
Knowledge mapping of immunotherapy in cervical carcinoma: a bibliometric analysis (2000-2023)
Song, L., Liang, X., Zhu, M., Su, Q., & Li, F. (2024) · Frontiers in Immunology · doi:10.3389/fimmu.2023.1328103 · Cited by 6
ZHANG, Y., Xiong, S., Zheng, W., Liu, J., Zhao, Y., Lv, J., Zhang, Y., Guo, L., & Liang, T. (2026) · Biochemical Pharmacology · doi:10.1016/j.bcp.2026.117858 · Cited by 6
Xu, Q., Wang, R., Sui, K., Xu, Y., Zhou, Y., He, Y., Hu, Z., Wang, Q., Xie, X., Wang, X., et al. (2025) · Stem Cell Research & Therapy · doi:10.1186/s13287-025-04321-6 · Cited by 5
Yuan, J., Du, J., Wang, Z., Ren, L., Zhang, S., Chen, M., Yang, J. J., Wei, S., Xu, J., Sun, H., et al. (2025) · ACS Applied Materials & Interfaces · doi:10.1021/acsami.5c14273 · Cited by 5
Targeting immune checkpoint therapy: The role of manganese in tumor immunotherapy
Lyu, X., Li, B., & Lin, Z. (2025) · Cancer Pathogenesis and Therapy · doi:10.1016/j.cpt.2025.10.001 · Cited by 4
Jang, Y., Bellier, N., Canlas, K. K. V., Lee, J. Y., Kim, Y., Park, H., & Moon, J. J. (2026) · Nano Convergence · doi:10.1186/s40580-026-00545-1 · Cited by 5
Manganese: biology, physiology and role in disease
Xia, Z., Li, X., Liu, R., Tuschl, K., Min, J., & Wang, F. (2026) · Cell Discovery · doi:10.1038/s41421-026-00894-5 · Cited by 4
Xu, W., Xu, J., Li, P., Xu, D., Cheng, H., Zheng, H., Zhang, L., Liu, M., Ye, S., Jiang, M., et al. (2024) · Frontiers in Immunology · doi:10.3389/fimmu.2024.1479399 · Cited by 5
Yan, H., Cheng, W., Qin, S., Zuo, J., Li, L., Zhang, J., Chang, Q., Yan, Y., Wang, S., Huang, C., et al. (2024) · Chemical Engineering Journal · doi:10.1016/j.cej.2024.157581 · Cited by 4
Self-citationImmune-checkpoint inhibitor resistance in patients with cancer
Cabezón‐Gutiérrez, L., Custodio‐Cabello, S., Palka-Kotlowska, M., Chacón-Ovejero, B., & Pacheco-Barcía, V. (2025) · Exploration of Immunology · doi:10.37349/ei.2025.1003196 · Cited by 4
Bisola, M.-A. I., Ogieuhi, I. J., Ajekiigbe, V. O., Adegbola, M. O., Udojike, C., Adeshina, G. A., Ogidan, A. O., Mohamed, R. G. H., Woldehana, N. A., Akingbola, A., et al. (2025) · Discover Medicine · doi:10.1007/s44337-025-00253-5 · Cited by 3
Gao, H., Liu, Y., Hu, Y., Ge, M., Ding, J., & Ye, Q. (2022) · Frontiers in Genetics · doi:10.3389/fgene.2022.850101 · Cited by 3
Role of renin angiotensin system inhibitors and metformin in Glioblastoma Therapy: a review
Dixon, S., O’Connor, A. T., Brooks-Noreiga, C., Clark, M. A., Levy, A., & Castejon, A. M. (2024) · Cancer Chemotherapy and Pharmacology · doi:10.1007/s00280-024-04686-0 · Cited by 5
Li, S., Yin, K., Wang, Y., Tan, L., Zhao, J., Pan, S., Yang, L., & He, D. (2024) · Biological Trace Element Research · doi:10.1007/s12011-024-04279-1 · Cited by 3
Self-citationZhang, H., Liu, M., Du, G., Yu, B., Ma, X., Gui, Y., Cao, L., Li, X., & Tan, B. (2022) · Journal of Cancer Research and Clinical Oncology · doi:10.1007/s00432-022-03940-3 · Cited by 3
Nie, H., Liu, H., Shi, Y., Yu, T., Liu, X., Lai, W., Tian, L., Xi, Z., & Lin, B. (2025) · Ecotoxicology and Environmental Safety · doi:10.1016/j.ecoenv.2025.119266 · Cited by 2
Zhu, X., Cui, X., Yu, H., Xu, J., Chen, X., Ren, X., Wei, X., Chen, S., Wang, Y., Fei, L., et al. (2026) · Frontiers in Immunology · doi:10.3389/fimmu.2025.1746155 · Cited by 2
Zhou, R., Tong, F., Zhang, Y., Zhang, R., Bin, Y., Zhang, S., Yang, N., & Dong, X. (2023) · Frontiers in Oncology · doi:10.3389/fonc.2023.1231094 · Cited by 2
Application of spatial omics in gastric cancer
Zhu, E., Xie, Q., Huang, X., & Zhang, Z. (2024) · Pathology - Research and Practice · doi:10.1016/j.prp.2024.155503 · Cited by 3
Li, R. M., Dong, Q., Jian, H., & Bai, S. (2025) · Precision medicine and engineering. · doi:10.1016/j.preme.2025.100030 · Cited by 5
Editorial: Harnessing tumor microenvironment for gynecologic cancer therapy
Zhou, L., & Yi, M. (2024) · Frontiers in Immunology · doi:10.3389/fimmu.2024.1407128 · Cited by 2
Self-citationYi, X., Tao, J., Chen, Y., Yuan, Y., Teng, Z., Li, P., & Yu, A. (2025) · Chemical Engineering Journal · doi:10.1016/j.cej.2025.168995 · Cited by 1
Overcoming therapeutic resistance in oncology: The prospects of inorganic nanotheranostics
Zhang, W., Ma, J., Yanagi, Y., Yin, P., Cheng, J., Wang, Y., Hong, N., Ricke, J., Xue, H., & Cheng, S. (2026) · Drug Resistance Updates · doi:10.1016/j.drup.2026.101361 · Cited by 1
Yu, M., Wang, K., Huang, Y., Zhou, Q., Tang, Z., Han, X., Zhang, X., Gong, J., Yang, M., Wang, J., et al. (2026) · ACS Applied Materials & Interfaces · doi:10.1021/acsami.6c00978 · Cited by 1
Ricardo, M.-G., Alberto, M.-G., María, H.-C. Á., García‐Rocha, R., Weiss‐Steider, B., Hernández‐Montes, J., Don‐López, C. A., Antonio, D. R. J., Vadim, P.-K., Molina-Castillo, G., et al. (2026) · Immunology Letters · doi:10.1016/j.imlet.2026.107150 · Cited by 1
Tong, A., Zhou, Y., Ding, Y., Zhao, Y., Han, C., Wei, L., & Zhao, J. (2026) · Materials Today Bio · doi:10.1016/j.mtbio.2026.103514 · Cited by 1
Manganese and IL-12 treatment alters the ovarian tumor microenvironment
Xu, Y., Huang, X., Nie, X., Liu, Y., Zhou, Y., & Niu, J. (2024) · Aging · doi:10.18632/aging.205361 · Cited by 1
Zhu, M., Wang, H., Zhang, Y., & Pan, F. (2024) · Emerging Microbes & Infections · doi:10.1080/22221751.2024.2356144 · Cited by 1
Salama, E. A., Elgammal, Y., Wijeratne, A. B., Lanman, N. A., Utturkar, S. M., Farhangian, A., Li, J., Meunier, B., Hazbun, T. R., & Seleem, M. N. (2024) · Emerging Microbes & Infections · doi:10.1080/22221751.2024.2396869
Abbasifard, M., Taghipoor, M., Talab, M. K., & Khorramdelazad, H. (2025) · Cancer Cell International · doi:10.1186/s12935-025-04040-1
Yi, M., Niu, M., Wu, Y., Ge, H., Jiao, D., Zhu, S., Zhang, J., Yan, Y., Zhou, P., Chu, Q., et al. (2022) · Figshare · doi:10.6084/m9.figshare.21303575
Self-citationYi, M., Niu, M., Wu, Y., Ge, H., Jiao, D., Zhu, S., Zhang, J., Yan, Y., Zhou, P., Chu, Q., et al. (2022) · Figshare · doi:10.6084/m9.figshare.21303590
Self-citationAdditional file 2 of S100A8/A9 as a risk factor for breast cancer negatively regulated by DACH1
Zhang, X., Niu, M., Li, T., Wu, Y., Gao, J., Yi, M., & Wu, K. (2024) · Figshare · doi:10.6084/m9.figshare.26653612
Self-citationYi, M., Niu, M., Wu, Y., Ge, H., Jiao, D., Zhu, S., Zhang, J., Yan, Y., Zhou, P., Chu, Q., et al. (2022) · Figshare · doi:10.6084/m9.figshare.21303563
Self-citationYi, M., Niu, M., Wu, Y., Ge, H., Jiao, D., Zhu, S., Zhang, J., Yan, Y., Zhou, P., Chu, Q., et al. (2022) · Figshare · doi:10.6084/m9.figshare.21303557
Self-citationYi, M., Niu, M., Wu, Y., Ge, H., Jiao, D., Zhu, S., Zhang, J., Yan, Y., Zhou, P., Chu, Q., et al. (2022) · Figshare · doi:10.6084/m9.figshare.21303569
Self-citationYi, M., Niu, M., Wu, Y., Ge, H., Jiao, D., Zhu, S., Zhang, J., Yan, Y., Zhou, P., Chu, Q., et al. (2022) · Figshare · doi:10.6084/m9.figshare.21303581
Self-citationNiu, M., Yi, M., Wu, Y., Lyu, L., He, Q., Yang, R., Zeng, L., Shi, J. Y., Zhang, J., Zhou, P., et al. (2024) · Figshare · doi:10.6084/m9.figshare.26610165
Self-citationYi, M., Niu, M., Wu, Y., Ge, H., Jiao, D., Zhu, S., Zhang, J., Yan, Y., Zhou, P., Chu, Q., et al. (2022) · Figshare · doi:10.6084/m9.figshare.21303560
Self-citationYi, M., Zhang, D., Song, B., Zhao, B., Niu, M., Wu, Y., Dai, Z., & Wu, K. (2023) · Figshare · doi:10.6084/m9.figshare.22601281
Self-citationYi, M., Niu, M., Wu, Y., Ge, H., Jiao, D., Zhu, S., Zhang, J., Yan, Y., Zhou, P., Chu, Q., et al. (2022) · Figshare · doi:10.6084/m9.figshare.21303566
Self-citationAdditional file 3 of S100A8/A9 as a risk factor for breast cancer negatively regulated by DACH1
Zhang, X., Niu, M., Li, T., Wu, Y., Gao, J., Yi, M., & Wu, K. (2024) · Figshare · doi:10.6084/m9.figshare.26653615
Self-citationYi, M., Niu, M., Wu, Y., Ge, H., Jiao, D., Zhu, S., Zhang, J., Yan, Y., Zhou, P., Chu, Q., et al. (2022) · Figshare · doi:10.6084/m9.figshare.21303548
Self-citationYi, M., Niu, M., Wu, Y., Ge, H., Jiao, D., Zhu, S., Zhang, J., Yan, Y., Zhou, P., Chu, Q., et al. (2022) · Figshare · doi:10.6084/m9.figshare.21303578
Self-citationAdditional file 1 of S100A8/A9 as a risk factor for breast cancer negatively regulated by DACH1
Zhang, X., Niu, M., Li, T., Wu, Y., Gao, J., Yi, M., & Wu, K. (2024) · Figshare · doi:10.6084/m9.figshare.26653606
Self-citationYi, M., Niu, M., Wu, Y., Ge, H., Jiao, D., Zhu, S., Zhang, J., Yan, Y., Zhou, P., Chu, Q., et al. (2022) · Figshare · doi:10.6084/m9.figshare.21303572
Self-citationYi, M., Niu, M., Wu, Y., Ge, H., Jiao, D., Zhu, S., Zhang, J., Yan, Y., Zhou, P., Chu, Q., et al. (2022) · Figshare · doi:10.6084/m9.figshare.21303554
Self-citationYi, M., Niu, M., Wu, Y., Ge, H., Jiao, D., Zhu, S., Zhang, J., Yan, Y., Zhou, P., Chu, Q., et al. (2022) · Figshare · doi:10.6084/m9.figshare.21303587
Self-citationYi, M., Niu, M., Wu, Y., Ge, H., Jiao, D., Zhu, S., Zhang, J., Yan, Y., Zhou, P., Chu, Q., et al. (2022) · Figshare · doi:10.6084/m9.figshare.21303584
Self-citationYi, M., Niu, M., Wu, Y., Ge, H., Jiao, D., Zhu, S., Zhang, J., Yan, Y., Zhou, P., Chu, Q., et al. (2022) · Figshare · doi:10.6084/m9.figshare.21303551
Self-citationKhan, S. H., Khan, I., & Sohail, S. (2025) · Research Square · doi:10.21203/rs.3.rs-8421416/v1
Ghaemi, F., Zadeh, A. N., Yekani, F., Malekzadeh, M., Hesaraki, M., & Rajabi, S. (2025) · International journal of basic science in medicine · doi:10.34172/ijbsm.48719
MODERN APPROACHES TO THE TREATMENT OF TRIPLE-NEGATIVE BREAST CANCER
Melekhov, S., Kononchuk, V., Khristin, A., Sidorov, S., Gulyaeva, L. F., & Kushlinskii, N. E. (2026) · Problems of Biological Medical and Pharmaceutical Chemistry · doi:10.29296/25877313-2026-03-01
MAVS in Cancer Therapy: The New STING?
Li, S., Bai, J., Wang, X., Guo, S., Guo, X., Shang, Z., & Shao, Z. (2026) · Cancer Letters · doi:10.1016/j.canlet.2026.218494
Self-citationThe game changer in the cervical cancer therapeutic landscape: immunotherapy
Yarza, R., Fariñas-Madrid, L., García-Durán, C., García-Illescas, D., Mazzeo, R., Giannubilo, I., & Oaknin, A. (2026) · Immunotherapy · doi:10.1080/1750743x.2026.2647581
Research Advances of Metal-Based Immune Adjuvants in Tumor Immunotherapy
杨, 敏. (2026) · World Journal of Cancer Research · doi:10.12677/wjcr.2026.162014
Advances in the role of manganese ions as immunostimulatory agonists in vaccines and immunotherapy
Fu, S., Zhu, C., & Jiang, Z. (2026) · Scientia Sinica Vitae · doi:10.1360/ssv-2026-0081
Jiang, M., Zhang, K., Zheng, X., Bo, Z., & Wei, R. (2026) · Cancer Biome and Targeted Therapy · doi:10.66505/cbtt.v1i2.17
Targeting innate immunity to overcome immune evasion in HPV-associated cancers
Bai, X., Dai, H., Lu, Z., & Yu, S. J. (2026) · Frontiers in Cellular and Infection Microbiology · doi:10.3389/fcimb.2026.1875111
Oryani, M. A., Tabarsa, H., Hatamian, G., Tajaldini, M., Javid, H., Mehri, A., & Karimi‐Shahri, M. (2026) · Immunotherapy · doi:10.1080/1750743x.2026.2697680
Spatial ecotype in tumor immune exclusion: from spatial architecture to therapeutic strategies
Ying, M., Zhang, L., Jia, M., Sun, X., Su, Y., Liu, C., Gong, M., Sun, T., & Zhang, B. (2026) · Molecular Cancer · doi:10.1186/s12943-026-02766-8
Advancing In Vivo Chimeric Antigen Receptor T‐Cell Engineering to Accelerate Clinical Translation
Bai, Z., Yi, M., Hu, S., Xue, D., Wei, L., Zhang, L., & Dai, Z. (2026) · MedComm · doi:10.1002/mco2.71030
Self-citation
Metadata
- Authors
- Yi, M., Niu, M., Zhang, J., Li, S., Zhu, S., Yan, Y., Li, N., Zhou, P., Chu, Q., & Wu, K.
- Affiliations
- Tongji Hospital (CN)
- Wuhan YZY Biopharma (China) (CN)
- Zhengzhou University (CN)
- Corresponding author
- Wu, Kongming
- Venue
- Journal of Hematology & Oncology
- Published
- 2021-09-15
- Volume
- 14
- Issue
- 1
- Pages
- 146-146
- ISSN
- 1756-8722 (ISSN-L)
- PMC
- PMC8442312
- OpenAlex
- W3200648346
- Cited by
- 163
- References
- 67
- Citations by year
- 2026: 23 · 2025: 25 · 2024: 44 · 2023: 32 · 2022: 37 · 2021: 2
- FWCI
- 10.47
- Type
- journal article
- Language
- en
- Open access
- gold
- doi.org
- Locations
- Journal of Hematology & Oncology (publishedVersion, cc-by)
- Europe PMC (PubMed Central) (publishedVersion, other-oa)
- PubMed Central (publishedVersion, cc-by)
- PubMed (publishedVersion)
- DOAJ (DOAJ: Directory of Open Access Journals) (submittedVersion, cc-by-sa)
- Funders
- national natural science foundation of china (82073370, 81874120)
- Topics
- Health Sciences › Medicine › Oncology › Cancer Immunotherapy and Biomarkers
- Life Sciences › Immunology and Microbiology › Immunology › Immunotherapy and Immune Responses
- Life Sciences › Biochemistry, Genetics and Molecular Biology › Molecular Biology › TGF-β signaling in diseases
- Keywords
- manganese, STING pathway, dendritic cell maturation, immune-excluded tumors, immunotherapy resistance, combination immunotherapy, tumor microenvironment, T cell activation, tumor-infiltrating lymphocytes, antitumor immunity, anti-PD-L1 resistance
- MeSH terms
- Antineoplastic Agents, Immunological, Immune Checkpoint Inhibitors, Animals, Drug Synergism, Humans, Immunotherapy, Manganese, Mice, Inbred BALB C, Neoplasms, Transforming Growth Factor beta, Antibodies, Bispecific, Cell Line, Tumor, Mice
About these checks
Registry, retraction, Cites and statistics results are computed, not judged, with one exception: a printed reference that no index lists is read once by a model before it counts as a citation error. Claims are extracted by a model and kept only when their quote appears verbatim in the text; each cited source is then checked, with a model’s help, for whether it says what the claim relies on. Those verdicts can be wrong — read the claim’s quote and the cited source before relying on one.
Statistics and arithmetic are recomputed, not judged.
Confidence bands are shown only for fields calibrated on our annotated test set. None is calibrated yet, so no band is shown.
What counts as a claim ›How we measure confidence ›How we check this ›
Are you an author, or do you see a problem with this page? Request a review
