

The DOI matches its Crossref record; 2 of the 2 references it cites were found in a registry or an index.
Apigenin suppresses PD-L1 expression in melanoma and host dendritic cells to elicit synergistic therapeutic effects
Open accessAbstract
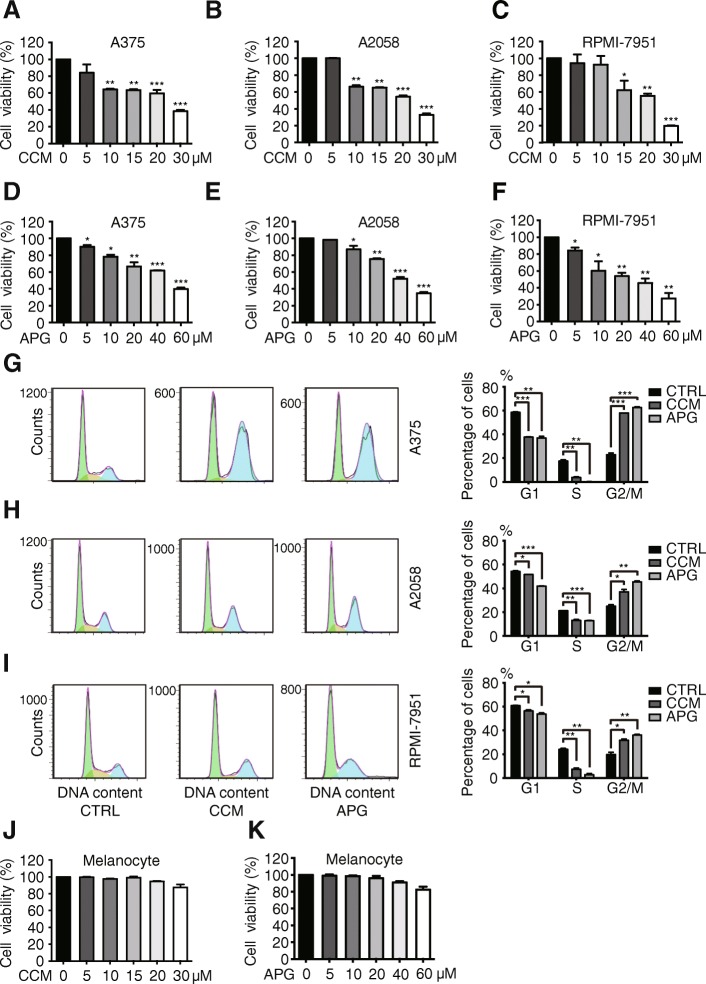
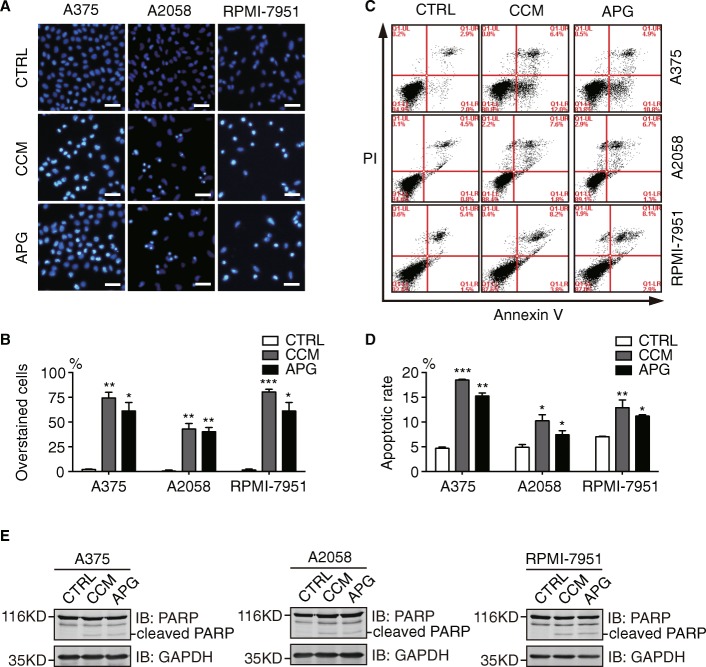
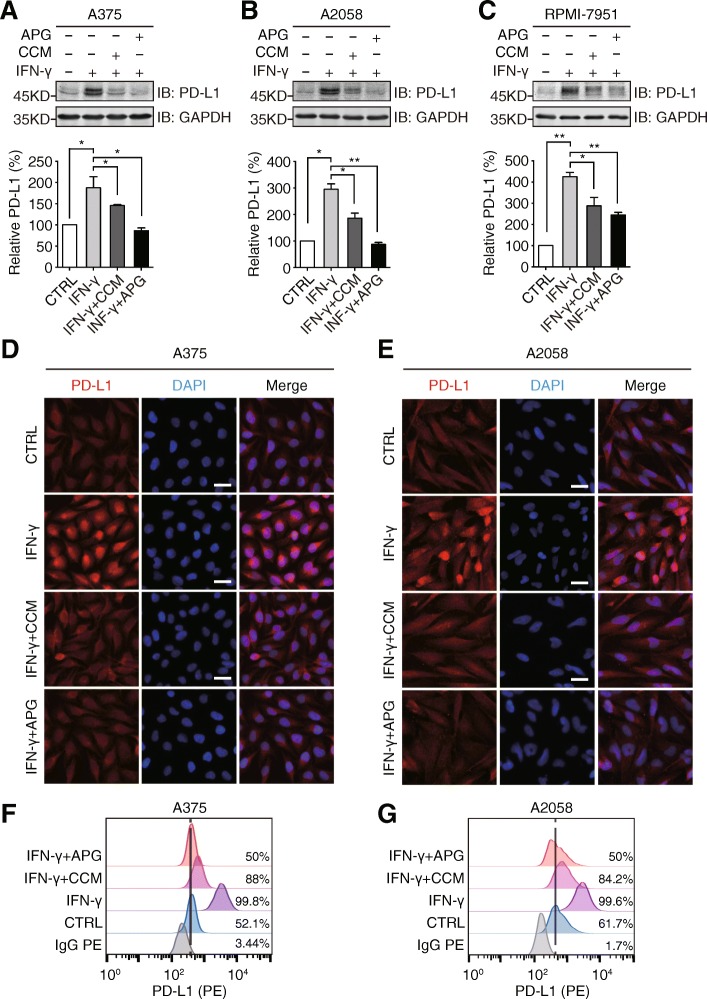
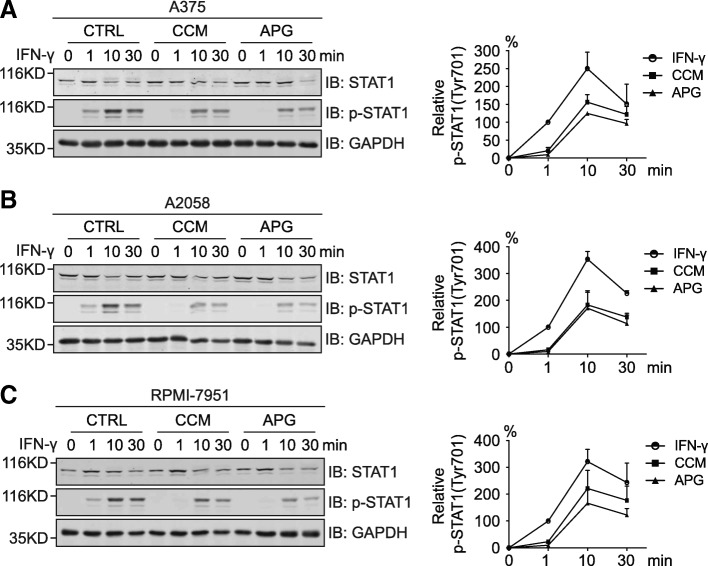
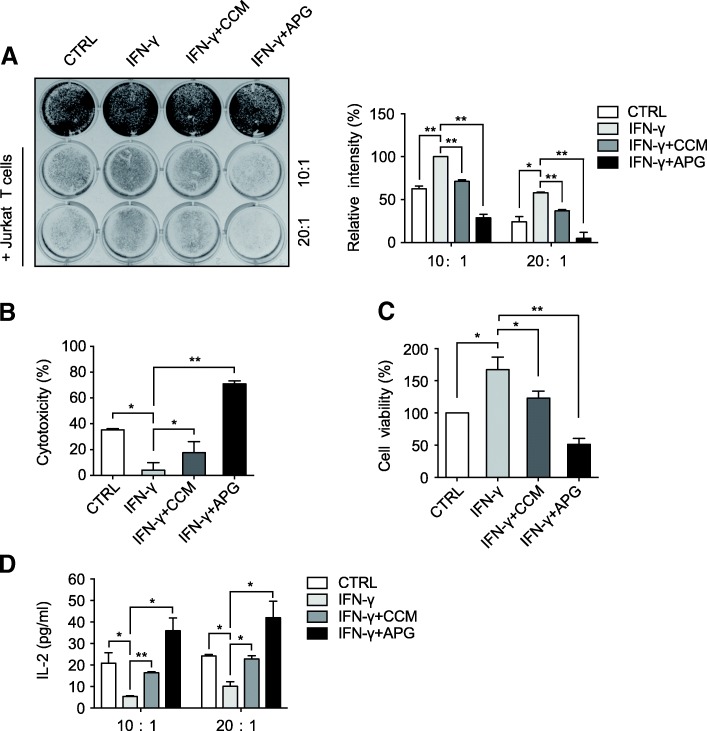
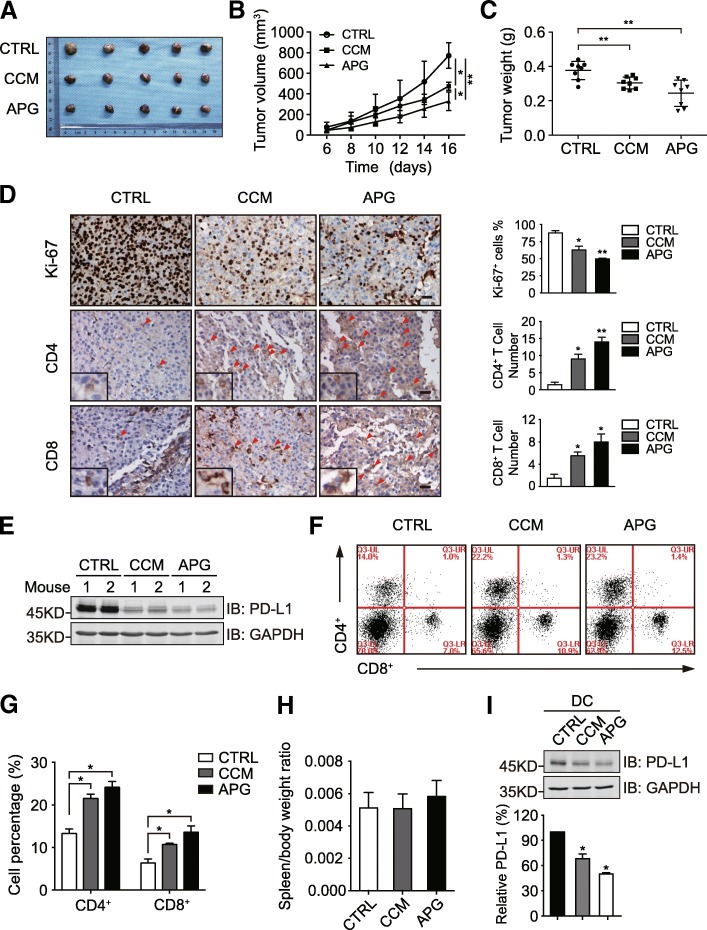
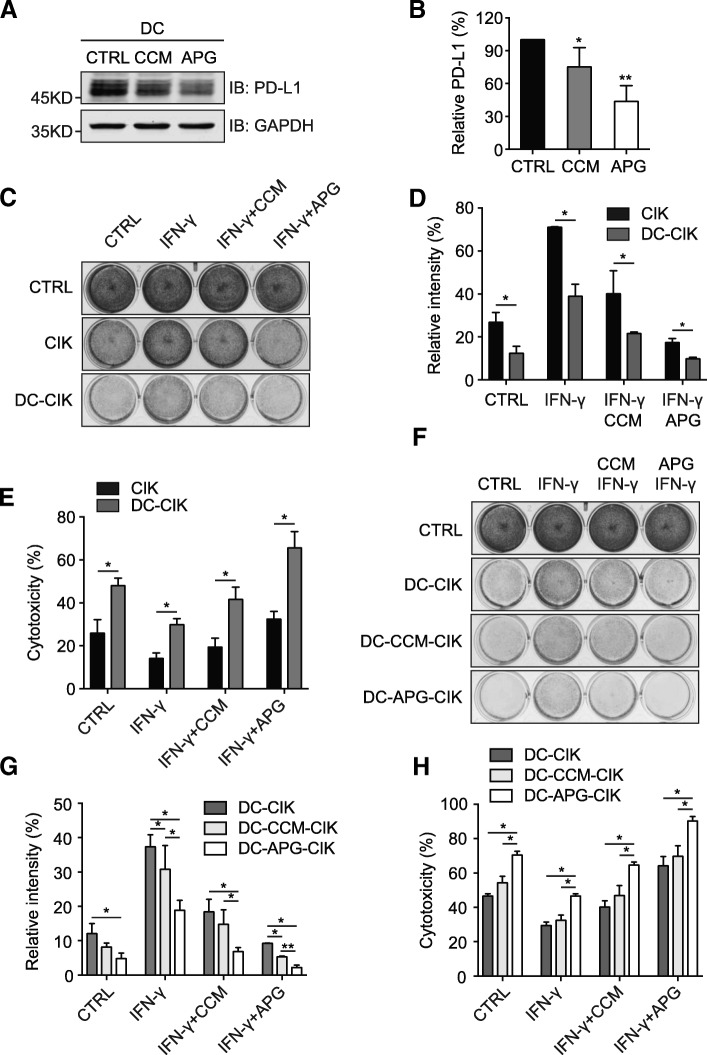
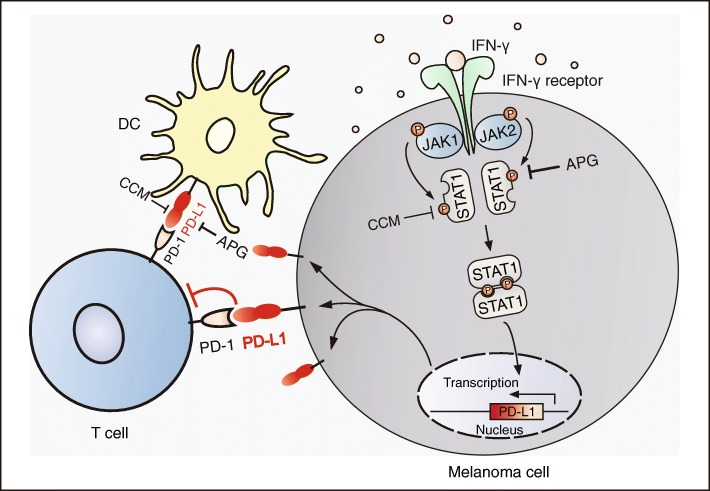
BACKGROUND: The PD-L1/PD-1 pathway blockade-mediated immune therapy has shown promising efficacy in the treatment of multiple cancers including melanoma. The present study investigated the effects of the flavonoid apigenin on the PD-L1 expression and the tumorigenesis of melanoma. METHODS: The influence of flavonoids on melanoma cell growth and apoptosis was investigated using cell proliferation and flow cytometric analyses. The differential IFN-γ-induced PD-L1 expression and STAT1 activation were examined in curcumin and apigenin-treated melanoma cells using immunoblotting or immunofluorescence assays. The effects of flavonoid treatment on melanoma sensitivity towards T cells were investigated using Jurkat cell killing, cytotoxicity, cell viability, and IL-2 secretion assays. Melanoma xenograft mouse model was used to assess the impact of flavonoids on tumorigenesis in vivo. Human peripheral blood mononuclear cells were used to examine the influence of flavonoids on PD-L1 expression in dendritic cells and cytotoxicity of cocultured cytokine-induced killer cells by cell killing assays. RESULTS: Curcumin and apigenin showed growth-suppressive and pro-apoptotic effects on melanoma cells. The IFN-γ-induced PD-L1 upregulation was significantly inhibited by flavonoids, especially apigenin, with correlated reductions in STAT1 phosphorylation. Apigenin-treated A375 cells exhibited increased sensitivity towards T cell-mediated killing. Apigenin also strongly inhibited A375 melanoma xenograft growth in vivo, with enhanced T cell infiltration into tumor tissues. PD-L1 expression in dendritic cells was reduced by apigenin, which potentiated the cytotoxicity of cocultured cytokine-induced killer cells against melanoma cells. CONCLUSIONS: Apigenin restricted melanoma growth through multiple mechanisms, among which its suppression of PD-L1 expression exerted a dual effect via regulating both tumor and antigen presenting cells. Our findings provide novel insights into the anticancer effects of apigenin and might have potential clinical implications.
Overview
The claims and statistics of this paper haven’t been checked yet.
Run the check — free, no account needed. It reads the open-access text and checks the sources it cites.
Integrity signals
Registry
Cites
Statistics
Figures
Verification
Claims the paper makes
The claims and statistics of this paper haven’t been checked yet.
Run the check — free, no account needed. It reads the open-access text and checks the sources it cites.
Claims other papers make about this one
Each is checked against this paper’s own text: does it say what the citing paper says it does?
The source backs part of the claim, not all of it — or backs it for a different population, condition or comparison.
In the citing paper
“This capacity to modulate PD‐L1 has been further confirmed in co-culture settings with Jurkat T cells, where apigenin was shown to not only increase T lymphocyte proliferation, but also promote their apoptosis in breast cancer (MDA‐MB‐468) and melanoma (A375) cells.259,260”
From Drug repurposing for cancer therapy (2024) · cites this paper as [260]
Experimental — accuracy not yet measuredThe source backs part of the claim, not all of it — or backs it for a different population, condition or comparison.
In the citing paper
“For example, in specific breast cancer (MDA‐MB‐468, SK‐BR‐3, and 4T1) and melanoma (A375, A2058, and RPMI‐7951) cell lines, apigenin has shown efficacy in negating the upregulation of PD‐L1, an effect induced by IFN‐γ.”
From Drug repurposing for cancer therapy (2024) · cites this paper as [260]
Experimental — accuracy not yet measured
Self-check
Percentages, sums and reported differences re-computed from the paper’s own numbers.
The self-check needs the paper’s full text.
Citations
Cites
Predictive correlates of response to the anti-PD-L1 antibody MPDL3280A in cancer patients
Herbst, R. S., Soria, J.-C., Kowanetz, M., Fine, G. D., Hamid, O., Gordon, M. S., Sosman, J. A., McDermott, D. F., Powderly, J. D., Gettinger, S. N., et al. (2014) · Nature · doi:10.1038/nature14011 · Cited by 5,231
Spranger, S., Koblish, H. K., Horton, B., Scherle, P. A., Newton, R., & Gajewski, T. F. (2014) · Journal for ImmunoTherapy of Cancer · doi:10.1186/2051-1426-2-3 · Cited by 552
Research works printed but not linked: 44
- Lim SY, Menzies AM, Rizos H. Mechanisms and strategies to overcome resistance to molecularly targeted therapy for melanoma. Cancer. 2017;123:2118–29. · DOI
- Nikolaou VA, Stratigos AJ, Flaherty KT, et al. Melanoma: new insights and new therapies. J Invest Dermatol. 2012;132:854–63. · DOI
- Dankner M, Rose AAN, Rajkumar S, et al. Classifying BRAF alterations in cancer: new rational therapeutic strategies for actionable mutations. Oncogene. 2018;37:3183–99. · DOI
- Greil R, Hutterer E, Hartmann TN, et al. Reactivation of dormant anti-tumor immunity - a clinical perspective of therapeutic immune checkpoint modulation. Cell Commun Signal. 2017;15:5. · DOI
- Zou W, Wolchok JD, Chen L. PD-L1 (B7-H1) and PD-1 pathway blockade for cancer therapy: mechanisms, response biomarkers, and combinations. Sci Transl Med. 2016;8:328rv4. · DOI
- Hamanishi J, Mandai M, Matsumura N, et al. PD-1/PD-L1 blockade in cancer treatment: perspectives and issues. Int J Clin Oncol. 2016;21:462–73. · DOI
- Spranger S, Gajewski TF. Impact of oncogenic pathways on evasion of antitumour immune responses. Nat Rev Cancer. 2018;18:139–47. · DOI
- Catakovic K, Klieser E, Neureiter D, et al. T cell exhaustion: from pathophysiological basics to tumor immunotherapy. Cell Commun Signal. 2017;15(1). · DOI
- Gong J, Chehrazi-Raffle A, Reddi S, et al. Development of PD-1 and PD-L1 inhibitors as a form of cancer immunotherapy: a comprehensive review of registration trials and future considerations. J Immunother Cancer. 2018;6:8. · DOI
- Sun C, Mezzadra R, Schumacher TN. Regulation and function of the PD-L1 checkpoint. Immunity. 2018;48:434–52. · DOI
- Zhou Y, Zheng J, Li Y, et al. Natural polyphenols for prevention and treatment of Cancer. Nutrients. 2016;8. · DOI
- Shukla S, Gupta S. Apigenin: a promising molecule for cancer prevention. Pharm Res. 2010;27:962–78. · DOI
- Papay ZE, Kosa A, Boddi B, et al. Study on the pulmonary delivery system of Apigenin-loaded albumin Nanocarriers with antioxidant activity. J Aerosol Med Pulm Drug Deliv. 2017;30:274–88. · DOI
- Wang YC, Huang KM. In vitro anti-inflammatory effect of apigenin in the helicobacter pylori-infected gastric adenocarcinoma cells. Food Chem Toxicol. 2013;53:376–83. · DOI
- Madunic J, Madunic IV, Gajski G, et al. Apigenin: a dietary flavonoid with diverse anticancer properties. Cancer Lett. 2018;413:11–22. · DOI
- Seo HS, Jo JK, Ku JM, et al. Induction of caspase-dependent extrinsic apoptosis by apigenin through inhibition of signal transducer and activator of transcription 3 (STAT3) signalling in HER2-overexpressing BT-474 breast cancer cells. Biosci Rep. 2015;35. · DOI
- Zhao G, Han X, Cheng W, et al. Apigenin inhibits proliferation and invasion, and induces apoptosis and cell cycle arrest in human melanoma cells. Oncol Rep. 2017;37:2277–85. · DOI
- Ruela-de-Sousa RR, Fuhler GM, Blom N, et al. Cytotoxicity of apigenin on leukemia cell lines: implications for prevention and therapy. Cell Death Dis. 2010;1:e19. · DOI
- Gupta S, Afaq F, Mukhtar H. Involvement of nuclear factor-kappa B, Bax and Bcl-2 in induction of cell cycle arrest and apoptosis by apigenin in human prostate carcinoma cells. Oncogene. 2002;21:3727–38. · DOI
- Granato M, Gilardini Montani MS, Santarelli R, et al. Apigenin, by activating p53 and inhibiting STAT3, modulates the balance between pro-apoptotic and pro-survival pathways to induce PEL cell death. J Exp Clin Cancer Res. 2017;36:167. · DOI
- Zhang Y, Zhang J, Liu C, et al. Neratinib induces ErbB2 ubiquitylation and endocytic degradation via HSP90 dissociation in breast cancer cells. Cancer Lett. 2016;382:176–85. · DOI
- Wang M, Zhang Y, Wang T, et al. The USP7 inhibitor P5091 induces cell death in ovarian cancers with different P53 status. Cell Physiol Biochem. 2017;43:1755–66. · DOI · Paper page
- Wang T, Zhang J, Wang S, et al. The exon 19-deleted EGFR undergoes ubiquitylation-mediated endocytic degradation via dynamin activity-dependent and -independent mechanisms. Cell Commun Signal. 2018;16:40. · DOI
- Yan X, Qi M, Li P, et al. Apigenin in cancer therapy: anti-cancer effects and mechanisms of action. Cell Biosci. 2017;7:50. · DOI
- Mirzaei H, Naseri G, Rezaee R, et al. Curcumin: a new candidate for melanoma therapy? Int J Cancer. 2016;139:1683–95. · DOI
- Platanias LC. Mechanisms of type-I- and type-II-interferon-mediated signalling. Nat Rev Immunol. 2005;5:375–86. · DOI
- Lin H, Wei S, Hurt EM, et al. Host expression of PD-L1 determines efficacy of PD-L1 pathway blockade-mediated tumor regression. J Clin Invest. 2018;128:805–15. · DOI
- Teng F, Meng X, Kong L, et al. Progress and challenges of predictive biomarkers of anti PD-1/PD-L1 immunotherapy: a systematic review. Cancer Lett. 2018;414:166–73. · DOI
- Tang H, Liang Y, Anders RA, et al. PD-L1 on host cells is essential for PD-L1 blockade-mediated tumor regression. J Clin Invest. 2018;128:580–8. · DOI
- Rezai-Zadeh K, Ehrhart J, Bai Y, et al. Apigenin and luteolin modulate microglial activation via inhibition of STAT1-induced CD40 expression. J Neuroinflammation. 2008;5:41. · DOI
- Ginwala R, McTish E, Raman C, et al. Apigenin, a natural flavonoid, attenuates EAE severity through the modulation of dendritic cell and other immune cell functions. J NeuroImmune Pharmacol. 2016;11:36–47. · DOI
- Arango D, Morohashi K, Yilmaz A, et al. Molecular basis for the action of a dietary flavonoid revealed by the comprehensive identification of apigenin human targets. Proc Natl Acad Sci U S A. 2013;110:E2153–62. · DOI
- Schoenborn JR, Wilson CB. Regulation of interferon-gamma during innate and adaptive immune responses. Adv Immunol. 2007;96:41–101. · DOI
- Mandai M, Hamanishi J, Abiko K, et al. Dual faces of IFNgamma in Cancer progression: a role of PD-L1 induction in the determination of pro- and antitumor immunity. Clin Cancer Res. 2016;22:2329–34. · DOI
- Kharma B, Baba T, Matsumura N, et al. STAT1 drives tumor progression in serous papillary endometrial cancer. Cancer Res. 2014;74:6519–30. · DOI
- Ramana CV, Gil MP, Schreiber RD, et al. Stat1-dependent and -independent pathways in IFN-gamma-dependent signaling. Trends Immunol. 2002;23:96–101. · DOI · Paper page
- Schmitt MJ, Philippidou D, Reinsbach SE, et al. Interferon-gamma-induced activation of signal transducer and activator of transcription 1 (STAT1) up-regulates the tumor suppressing microRNA-29 family in melanoma cells. Cell Commun Signal. 2012;10:41. · DOI
- Mezzadra R, Sun C, Jae LT, et al. Identification of CMTM6 and CMTM4 as PD-L1 protein regulators. Nature. 2017;549:106–10. · DOI · Paper page
- Coombs MR, Harrison ME, Hoskin DW. Apigenin inhibits the inducible expression of programmed death ligand 1 by human and mouse mammary carcinoma cells. Cancer Lett. 2016;380:424–33. · DOI · Paper page
- Sheppard KA, Fitz LJ, Lee JM, et al. PD-1 inhibits T-cell receptor induced phosphorylation of the ZAP70/CD3zeta signalosome and downstream signaling to PKCtheta. FEBS Lett. 2004;574:37–41. · DOI · Paper page
- Li CW, Lim SO, Xia W, et al. Glycosylation and stabilization of programmed death ligand-1 suppresses T-cell activity. Nat Commun. 2016;7:12632. · DOI
- Ott PA, Hodi FS, Robert C. CTLA-4 and PD-1/PD-L1 blockade: new immunotherapeutic modalities with durable clinical benefit in melanoma patients. Clin Cancer Res. 2013;19:5300–9. · DOI
- Fujiki H, Watanabe T, Sueoka E, et al. Cancer prevention with green tea and its principal constituent, EGCG: from early investigations to current focus on human Cancer stem cells. Mol Cells. 2018;41:73–82.
- Rawangkan A, Wongsirisin P, Namiki K, et al. Green tea Catechin is an alternative immune checkpoint inhibitor that inhibits PD-L1 expression and lung tumor growth. Molecules. 2018;23. · DOI
Cited by
Sorted by citations
Flavonoids as Anticancer Agents
Kopustinskienė, D. M., Jakštas, V., Savickas, A., & Bernatonienė, J. (2020) · Nutrients · doi:10.3390/nu12020457 · Cited by 1,420
“The studies on flavonoids as possible suppressors of PD-L1/PD-1 immune checkpoint have not been very intense yet, nevertheless the first encouraging results were obtained demonstrating the inhibition of PD-L1 expression by flavone apigenin in A375 melanoma cells [142] and PD-1/PD-L1 inhibition in vitro by flavonols qu…”
ResultDrug repurposing for cancer therapy
Xia, Y., Sun, M., Huang, H., & Jin, W.-L. (2024) · Signal Transduction and Targeted Therapy · doi:10.1038/s41392-024-01808-1 · Cited by 443
“259,260 These fi ndings highlight the intertwined relationship between T cell activation, apigenin-dependent PD-L1 regulation, and subsequent cancer cell demise.”
BackgroundEmerging role of natural products in cancer immunotherapy
Dong, S., Guo, X., Han, F., He, Z., & Wang, Y. (2021) · Acta Pharmaceutica Sinica B · doi:10.1016/j.apsb.2021.08.020 · Cited by 289
Natural products and their derivatives: Promising modulators of tumor immunotherapy
Deng, L., Qi, M., Li, N., Lei, Y., Zhang, D., & Chen, J. (2020) · Journal of Leukocyte Biology · doi:10.1002/jlb.3mr0320-444r · Cited by 196
Ke, M., Zhang, Z., Xu, B.-Y., Zhao, S., Ding, Y., Wu, X., Wu, R., Lv, Y., & Dong, J. (2019) · International Immunopharmacology · doi:10.1016/j.intimp.2019.105824 · Cited by 145
Metadata
- Authors
- Xu, L., Zhang, Y., Tian, K., Chen, X., Zhang, R., Mu, X., Wu, Y., Wang, D., Wang, S., Liu, F., Wang, T., Zhang, J., Liu, S., Zhang, Y., Tu, C., & Liu, H.
- Affiliations
- Dalian Medical University (CN)
- Corresponding author
- Liu, Han
- ORCID
- Venue
- Journal of Experimental & Clinical Cancer Research
- Published
- 2018-10-29
- Volume
- 37
- Issue
- 1
- Pages
- 261-261
- ISSN
- 0392-9078 (ISSN-L)
- 1756-9966
- PMC
- PMC6206930
- OpenAlex
- W2898843431
- Cited by
- 177
- References
- 47
- Citations by year
- 2026: 13 · 2025: 21 · 2024: 29 · 2023: 24 · 2022: 26 · 2021: 30 · 2020: 22 · 2019: 12
- FWCI
- 6.01
- Type
- journal article
- Language
- en
- Open access
- gold
- doi.org
- Licence
- Locations
- Journal of Experimental & Clinical Cancer Research (publishedVersion, cc-by)
- Europe PMC (PubMed Central) (publishedVersion, other-oa)
- PubMed Central (publishedVersion, cc-by)
- PubMed (publishedVersion)
- DOAJ (DOAJ: Directory of Open Access Journals) (submittedVersion, cc-by-sa)
- Funders
- National Natural Science Foundation of China (81273921, 81601901, 81301901)
- Topics
- Health Sciences › Medicine › Oncology › Cancer Immunotherapy and Biomarkers
- Health Sciences › Medicine › Pharmacology (medical) › Flavonoids in Medical Research
- Life Sciences › Immunology and Microbiology › Immunology › Immunotherapy and Immune Responses
- Keywords
- apigenin, melanoma, PD-L1 expression, PD-1/PD-L1 pathway, flavonoids, curcumin, STAT1 phosphorylation, interferon-gamma, apoptosis, T cell cytotoxicity, dendritic cells, cytokine-induced killer cells, tumor xenografts, tumor immune microenvironment, anticancer agents
- MeSH terms
- Animals, Cell Survival, Curcumin, Dendritic Cells, Humans, Interferon-gamma, Interleukin-2, Melanoma, T-Lymphocytes, Down-Regulation, Gene Expression Regulation, Neoplastic, Coculture Techniques, Jurkat Cells, Xenograft Model Antitumor Assays, Cell Line, Tumor, Apigenin, Cell Proliferation, Mice, B7-H1 Antigen
About these checks
Registry, retraction, Cites and statistics results are computed, not judged, with one exception: a printed reference that no index lists is read once by a model before it counts as a citation error. Claims are extracted by a model and kept only when their quote appears verbatim in the text; each cited source is then checked, with a model’s help, for whether it says what the claim relies on. Those verdicts can be wrong — read the claim’s quote and the cited source before relying on one.
Statistics and arithmetic are recomputed, not judged.
Confidence bands are shown only for fields calibrated on our annotated test set. None is calibrated yet, so no band is shown.
What counts as a claim ›How we measure confidence ›How we check this ›
Are you an author, or do you see a problem with this page? Request a review
