

The DOI matches its Crossref record; 58 of the 58 references it cites were found in a registry or an index; 16 of the 16 sources its claims cite were checked for support.
Robust differential expression testing for single-cell CRISPR screens at low multiplicity of infection
Open accessPublished version of a preprint
Abstract
Single-cell CRISPR screens (perturb-seq) link genetic perturbations to phenotypic changes in individual cells. The most fundamental task in perturb-seq analysis is to test for association between a perturbation and a count outcome, such as gene expression. We conduct the first-ever comprehensive benchmarking study of association testing methods for low multiplicity-of-infection (MOI) perturb-seq data, finding that existing methods produce excess false positives. We conduct an extensive empirical investigation of the data, identifying three core analysis challenges: sparsity, confounding, and model misspecification. Finally, we develop an association testing method - SCEPTRE low-MOI - that resolves these analysis challenges and demonstrates improved calibration and power.
Overview
CoChat Summary
TL;DR
This paper benchmarks association-testing methods for low-MOI single-cell CRISPR screens and finds that existing methods produce excess false positives due to sparsity, confounding, and model misspecification. It introduces SCEPTRE low-MOI, a negative-binomial score-statistic permutation test that improves calibration and power across datasets.
Key findings
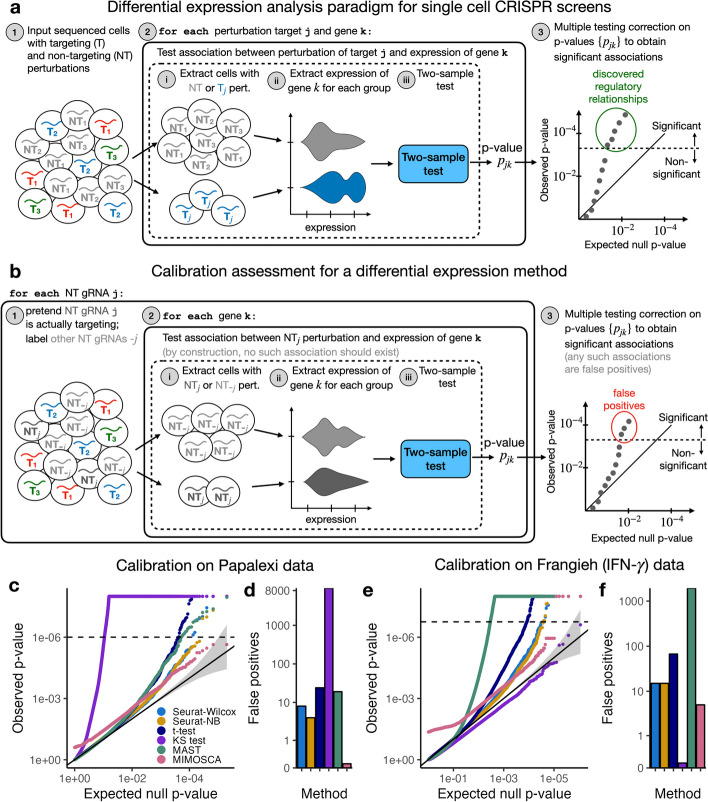
- In the first comprehensive benchmarking study of six methods on six datasets (five real, one simulated), all existing methods showed miscalibration: the KS test produced over 9,000 false Bonferroni discoveries on the Papalexi data, MAST falsely rejected nearly 2,000 null pairs on the Frangieh IFN- data, and MIMOSCA output p-values strictly less than 0.26 across all pairs.
- Three core analysis challenges were identified—sparsity, confounding, and model misspecification—and no existing method addressed more than one of them.
- SCEPTRE low-MOI generally made the fewest false discoveries, averaging 0.7 false discoveries across datasets, roughly a tenfold improvement over the Seurat methods; on the Frangieh IFN- data it made one Bonferroni rejection versus fifteen each for the Seurat methods.
- SCEPTRE matched or outperformed other methods in power on every dataset, and pairwise QC filtering for effective sample size ≥7 was applied; on standard-sparsity datasets, the authors recommend at least 50–65 cells per perturbation to ensure pairs pass pairwise QC.
Methods
- Benchmarking: six methods (Seurat-Wilcox, Seurat-NB, t-test, MAST, KS test, MIMOSCA) were applied to six datasets, including five real datasets from Frangieh 2021, Papalexi 2021, and Schraivogel 2020 plus one simulated dataset. Calibration was assessed by constructing null perturbation-gene pairs from non-targeting gRNAs and counting Bonferroni-significant false discoveries; power was assessed on positive control pairs.
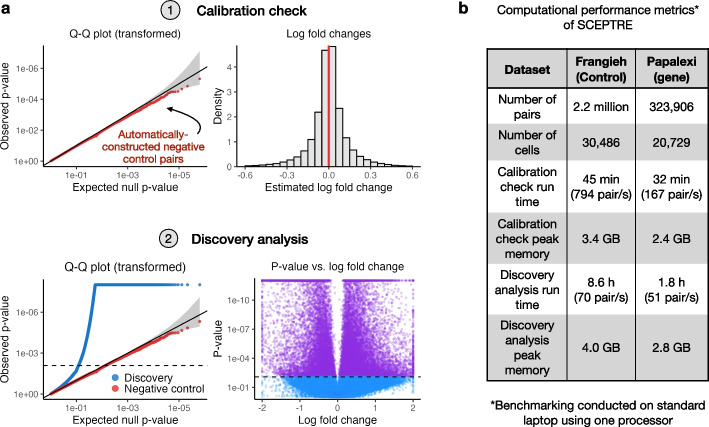
- SCEPTRE low-MOI: for each perturbation-gene pair, gene expression is regressed on perturbation indicators and technical factors via an NB GLM; a GLM score-test z-score is computed, perturbation indicators are permuted B times to generate null z-scores, a skew-normal density is fit to the null z-scores, and a p-value is obtained from the fitted tail. Accelerations include score testing, spectral decomposition for sparse binary treatments, adaptive permutation, skew-normal fitting, and inductive without-replacement sampling.
- Empirical investigation: exact versus asymptotic Wilcoxon null distributions were compared across effective sample sizes; confounding was examined using biological replicate, NT gRNA presence, and gene expression in the Papalexi data; model misspecification was assessed by applying NB regression to Frangieh IFN- negative control data across effective sample size bins.
Limitations
- The paper states that SCEPTRE does not currently address off-target effects of some NT gRNAs, ineffective targeting gRNAs, distinguishing direct from indirect perturbation effects, or pooling information across co-expressed gene modules. It also states that evidence for the CAMP robustness property is empirical and a mathematical proof is left to future work.
- The paper states that GSFA, Normalisr, and scMaGECK were not included in the benchmarking analysis, and that methods with extreme miscalibration on a dataset were excluded from the positive control power analysis.
- Evident from the text: the calibration check relies on NT gRNA-gene pairs as negative controls, so its validity depends on NT gRNAs being truly null; the paper itself notes that off-targeting NT gRNAs could cause loss of error control. SCEPTRE’s stated validity conditions require either unconfoundedness or correct NB specification up to the size parameter with sufficiently large effective sample size.
Model-written summary. Check it against the paper before relying on it.
Integrity signals
Registry
Cites
Statistics
Figures


Verification
Claims the paper makes
10 Valid · 4 Not valid · 0 Not checked · 101 Own results and interpretations
The cited sources that could be checked couldn’t confirm or dispute this claim.
In the paper
“there is no commonly accepted framework for quantifying the statistical validity of single-cell CRISPR screen association testing methods”
§ Robust differential expression testing for single-cell CRISPR screens at low multiplicity of infection > Background
What the sources say
- Could not verifycites [18] Heumos L, Schaar AC, Lance C, Litinetskaya A, Drost F, Zappia L, et al. Best practices for single-cell analysis across modalities. Nat Rev Genet. 2023;24(8):1–23. sourceExperimental — accuracy not yet measured
The Introduction says that a lack of best-practice workflows makes single-cell tools difficult to navigate. The Transcriptome > Revealing mechanisms section discusses perturbation-modelling methods and statistical validity in differential gene-expression testing, but does not address whether a commonly accepted framework exists for assessing the statistical validity of single-cell CRISPR screen association tests. Searched for CRISPR association testing, statistical validity, and benchmarking frameworks; no passage in our copy settles the claim (page numbers unavailable). (LLM, conf=0.73)
plain- Asserted: passes — The authors put it forward as true.
- Checkable: passes — It can be checked against evidence.
- Load-bearing: passes — The paper’s conclusions depend on it.
- Based: passes — The paper gives a reason why it holds.
- Could not verify
Every source the paper cites for this claim was checked and supports it.
In the paper
“we discovered that existing methods for association testing are prone to an excess of false positive hits [13]”
§ Robust differential expression testing for single-cell CRISPR screens at low multiplicity of infection > Background
What the sources say
- Supportedcites [13] Barry T, Wang X, Morris JA, Roeder K, Katsevich E. SCEPTRE improves calibration and sensitivity in single-cell CRISPR screen analysis. Genome Biol. 2021;22(1):1–19. source
The Background states that high-MOI single-cell CRISPR screens have substantial calibration problems and reports excess false-positive hits from an existing association-testing method. The Results (Analysis challenges) document inflated or miscalibrated negative-control p-values for methods used on two such screens. (LLM, conf=0.94)
plainstates a cause- Asserted: passes — The authors put it forward as true.
- Checkable: passes — It can be checked against evidence.
- Load-bearing: passes — The paper’s conclusions depend on it.
- Based: passes — The paper gives a reason why it holds.
- Supported
The cited sources that could be checked couldn’t confirm or dispute this claim.
In the paper
“there does not exist a standard protocol for assessing the calibration of single-cell CRISPR screen association methods”
§ Robust differential expression testing for single-cell CRISPR screens at low multiplicity of infection > Results > Comprehensive benchmarking study of leading analysis methods
What the sources say
- Could not verifycites [15] Schraivogel D, Gschwind AR, Milbank JH, Leonce DR, Jakob P, Mathur L, et al. Targeted Perturb-seq enables genome-scale genetic screens in single cells. Nat Methods. 2020;17(6):629–35. sourceExperimental — accuracy not yet measured
The Results section describes precision–recall analyses, and Extended Data Fig. 7 compares differential-expression testing methods, but neither addresses whether a standard protocol exists for assessing the calibration of single-cell CRISPR screen association methods. Searches for calibration, standardized assessment, and association-method benchmarking found no passage making that claim; page numbers were unavailable in our copy. (LLM, conf=0.76)
plain- Asserted: passes — The authors put it forward as true.
- Checkable: passes — It can be checked against evidence.
- Load-bearing: passes — The paper’s conclusions depend on it.
- Based: passes — The paper gives a reason why it holds.
- Could not verify
The cited sources support only part of this claim — read each source’s verdict below.
In the paper
“technical factors, such as biological replicate, batch, and library size, impact not only a cell’s expression level but also its probability of receiving a perturbation, thereby creating a confounding effect that can lead to spurious associations [13]”
§ Robust differential expression testing for single-cell CRISPR screens at low multiplicity of infection > Results > Systematic identification of core analysis challenges
What the sources say
- Partly supportedcites [13] Barry T, Wang X, Morris JA, Roeder K, Katsevich E. SCEPTRE improves calibration and sensitivity in single-cell CRISPR screen analysis. Genome Biol. 2021;22(1):1–19. sourceExperimental — accuracy not yet measured
The Results section (“Analysis challenges”) says batch and sequencing depth affect both observed gene expression and gRNA detection probability, creating confounding that can produce false associations. That supports the main point, with sequencing depth closely corresponding to library size. The paper does not identify biological replicate as a confounder here, and it concerns whether a perturbation is detected, not whether a cell actually receives one. (LLM, conf=0.88)
plainstates a cause- Asserted: passes — The authors put it forward as true.
- Checkable: passes — It can be checked against evidence.
- Load-bearing: passes — The paper’s conclusions depend on it.
- Based: passes — The paper gives a reason why it holds.
- Partly supported
The cited sources support only part of this claim — read each source’s verdict below.
In the paper
“identified five methods commonly in use: the default Seurat [19] FindMarkers() function based on the Wilcoxon test (Seurat-Wilcox), MIMOSCA [1], a t-test on the library-size-normalized expressions [10], MAST [20], and a Kolmogorov-Smirnov (KS) test on the library-size-normalized expressions [21]”
§ Robust differential expression testing for single-cell CRISPR screens at low multiplicity of infection > Results > A survey of leading analysis methods
What the sources say
- Partly supportedcites [19] Butler A, Hoffman P, Smibert P, Papalexi E, Satija R. Integrating single-cell transcriptomic data across different conditions, technologies, and species. Nat Biotechnol. 2018;36(5):411–20. https://doi.org/10.1038/nbt.4096. sourceExperimental — accuracy not yet measured
The Online Methods section, under “Integrated Analysis Across Datasets” (page unavailable), reports using a Wilcoxon rank-sum test for differential-expression testing in Seurat. It does not identify FindMarkers() or establish that Wilcoxon is that function’s default. The citation [19] is attached to the Seurat method, not to the other four methods in the citing sentence. (LLM, conf=0.82)
- Supportedcites [1] Dixit A, Parnas O, Li B, Chen J, Fulco CP, Jerby-Arnon L, et al. Perturb-Seq: dissecting molecular circuits with scalable single-cell RNA profiling of pooled genetic screens. Cell. 2016;167(7):1853–66. source
The citation [1] is attached to MIMOSCA, not to the entire five-method list. The Introduction states that the authors developed MIMOSCA as a computational framework for analyzing perturbation effects, confirming the cited method's identity. (LLM, conf=0.94)
- Partly supportedcites [10] Liscovitch-Brauer N, Montalbano A, Deng J, Méndez-Mancilla A, Wessels HH, Moss NG, et al. Profiling the genetic determinants of chromatin accessibility with scalable single-cell CRISPR screens. Nat Biotechnol. 2021;39(10):1270–7. sourceExperimental — accuracy not yet measured
The citation is attached to the t-test method, not to the entire list of five methods. The Methods sections on Statistical analysis and Differential accessibility at genomic regions with specific chromatin and DNA modifications report using t-tests, but on group data and chromatin-accessibility Z-scores, respectively—not on library-size-normalized gene expression. No page number is available in our copy. (LLM, conf=0.85)
plain- Asserted: passes — The authors put it forward as true.
- Checkable: passes — It can be checked against evidence.
- Load-bearing: passes — The paper’s conclusions depend on it.
- Based: passes — The paper gives a reason why it holds.
- Partly supported
60 more claims · 2 with their cited sources checked
Create a free account to see all 115 claims and every source verdict.
- Probably not a substantial claim. 25
- It may state two separate claims as one. 32
Self-check
Percentages, sums and reported differences re-computed from the paper’s own numbers.
Each contradiction between two passages listed here was confirmed by an independent check.
Rated minor: it would not touch a result — a value no result rests on, a p-value that stays on the same side of the significance level, or a conflict that is clerical, resolved elsewhere in the paper, or outside its own findings.
In the paper
§ Robust differential expression testing for single-cell CRISPR screens at low multiplicity of infection > Results > Systematic identification of core analysis challenges
“To assess this effect, we monitored p-value calibration of the NB regression method on the Frangieh IFN- data while gradually increasing the effective sample size (Fig. 2f).”
§ Robust differential expression testing for single-cell CRISPR screens at low multiplicity of infection > Results > Systematic identification of core analysis challenges
“f Stratification of the NB regression p-values on the Papalexi (gene expression) negative control data by effective sample size”
Citations
Cites
Moderated estimation of fold change and dispersion for RNA-seq data with DESeq2
Love, M. I., Huber, W., & Anders, S. (2014) · Genome Biology · doi:10.1186/s13059-014-0550-8 · Cited by 95,106
Integrated analysis of multimodal single-cell data
Hao, Y., Hao, S., Andersen-Nissen, E., Mauck, W. M., Zheng, S., Butler, A., Lee, M. J., Wilk, A. J., Darby, C., Zagar, M., et al. (2020) · doi:10.1101/2020.10.12.335331 · Cited by 15,508
Integrating single-cell transcriptomic data across different conditions, technologies, and species
Butler, A., Hoffman, P., Smibert, P., Papalexi, E., & Satija, R. (2018) · Nature Biotechnology · doi:10.1038/nbt.4096 · Cited by 13,174
Anomalous collapses of Nares Strait ice arches leads to enhanced export of Arctic sea ice
Moore, G. W. K., Howell, S. E. L., Brady, M., Xu, X., & McNeil, K. (2021) · Nature Communications · doi:10.1038/s41467-020-20314-w · Cited by 5,155
Systematic Localization of Common Disease-Associated Variation in Regulatory DNA
Maurano, M. T., Humbert, R., Rynes, E., Thurman, R. E., Haugen, E., Wang, H., Reynolds, A. P., Sandstrom, R., Qu, H., Brody, J., et al. (2012) · Science · doi:10.1126/science.1222794 · Cited by 3,716
Finak, G., McDavid, A., Yajima, M., Deng, J., Gersuk, V., Shalek, A. K., Slichter, C. K., Miller, H. W., McElrath, M. J., Prlic, M., et al. (2015) · Genome Biology · doi:10.1186/s13059-015-0844-5 · Cited by 3,159
Partitioning heritability by functional annotation using genome-wide association summary statistics
ReproGen Consortium, Finucane, H. K., Schizophrenia Working Group of the Psychiatric Genomics Consortium, The RACI Consortium, Bulik-Sullivan, B., Gusev, A., Trynka, G., Reshef, Y., Loh, P.-R., Anttila, V., et al. (2015) · Nature Genetics · doi:10.1038/ng.3404 · Cited by 2,604 · cited 1×
“The bulk of genetic risk for diseases lies in noncoding regions, implicating dysregulation of gene expression [31–33].”
Opportunities and challenges in long-read sequencing data analysis
Amarasinghe, S. L., Su, S., Dong, X., Zappia, L., Ritchie, M. E., & Gouil, Q. (2020) · Genome Biology · doi:10.1186/s13059-020-1935-5 · Cited by 2,530
Cui, P., Zhang, S., Ding, F., Ali, S., & Xiong, L. (2014) · Genome Biology · doi:10.1186/gb-2014-15-1-r1 · Cited by 2,294
Dixit, A., Parnas, O., Li, B., Chen, J., Fulco, C. P., Jerby-Arnon, L., Marjanovic, N. D., Dionne, D., Burks, T., Raychowdhury, R., et al. (2016) · Cell · doi:10.1016/j.cell.2016.11.038 · Cited by 1,863
Research works printed but not linked: 1
- Ripley B, Venables B, Bates DM, Hornik K, Gebhardt A, Firth D, et al. Package ‘mass’. Cran R. 2013;538:113–20.
Cited by
Pooled CRISPR screens with joint single-nucleus chromatin accessibility and transcriptome profiling
Yan, R. E., Corman, A., Katgara, L., Xiao, W., Xue, X., Gajic, Z. Z., Sam, R., Farid, M., Friedman, S. M., Choo, J., et al. (2024) · Nature Biotechnology · doi:10.1038/s41587-024-02475-x · Cited by 24
Self-citationGuide assignment in single-cell CRISPR screens using crispat
Braunger, J. M., & Velten, B. (2024) · Bioinformatics · doi:10.1093/bioinformatics/btae535 · Cited by 13
Genetic drivers of Chinese hamster ovary cell proliferation revealed by functional genomics
Marzluf, J., Rattay, M., Goertz, M., Zehe, C., & Leroux, A. (2025) · iScience · doi:10.1016/j.isci.2025.113847 · Cited by 9
Conery, M., Pippin, J. A., Wagley, Y., et al. (2024) · bioRxiv (Cold Spring Harbor Laboratory) · doi:10.1101/2024.03.19.585778 · Cited by 6
Self-citationInterrogating the Regulatory Function of HAQERs during Human Cortical DevelopmentPreprint
Abeykoon, Y., Dzikowski, N., Sinniah, E., Luo, Y., Weaver, S., Pavlovic, B. J., Wallace, J. L., Gozashti, L., Mangan, R. J., Sudmant, P. H., et al. (2025) · bioRxiv (Cold Spring Harbor Laboratory) · doi:10.1101/2025.11.30.691411 · Cited by 7
Metadata
- Authors
- Barry, T., Mason, K., Roeder, K., & Katsevich, E.
- Affiliations
- Harvard University (US)
- University of Pennsylvania (US)
- Carnegie Mellon University (US)
- Corresponding author
- Katsevich, Eugene
- Venue
- Genome Biology
- Published
- 2024-05-17
- Volume
- 25
- Issue
- 1
- Pages
- 124-124
- ISSN
- 1465-6906 (ISSN-L)
- 1474-760X
- PMC
- PMC11100084
- OpenAlex
- W4397012384
- Cited by
- 28
- References
- 50
- Citations by year
- 2026: 13 · 2025: 9 · 2024: 6
- FWCI
- 3.80
- Type
- journal article
- Language
- en
- Open access
- gold
- doi.org
- Licence
- cc-by
- creativecommons.org/licenses/by/4.0 (tdm)
- creativecommons.org/licenses/by/4.0 (vor)
- Locations
- Genome biology (publishedVersion, cc-by)
- bioRxiv (Cold Spring Harbor Laboratory) (acceptedVersion)
- PubMed Central (publishedVersion, cc-by)
- PubMed (publishedVersion)
- PubMed Central (submittedVersion)
- DOAJ (DOAJ: Directory of Open Access Journals) (submittedVersion, cc-by-sa)
- Funders
- Foundation for the National Institutes of Health (R01MH123184)
- National Science Foundation (DMS-2113072)
- Topics
- Life Sciences › Biochemistry, Genetics and Molecular Biology › Molecular Biology › Single-cell and spatial transcriptomics
- Life Sciences › Biochemistry, Genetics and Molecular Biology › Molecular Biology › CRISPR and Genetic Engineering
- Life Sciences › Biochemistry, Genetics and Molecular Biology › Molecular Biology › Gene Regulatory Network Analysis
- Keywords
- single-cell CRISPR screens, Perturb-seq, differential expression analysis, low multiplicity of infection, association testing, false positives, sparsity, confounding, model misspecification, scepter, benchmarking
About these checks
Registry, retraction, Cites and statistics results are computed, not judged, with one exception: a printed reference that no index lists is read once by a model before it counts as a citation error. Claims are extracted by a model and kept only when their quote appears verbatim in the text; each cited source is then checked, with a model’s help, for whether it says what the claim relies on. Those verdicts can be wrong — read the claim’s quote and the cited source before relying on one.
The claim verdicts this report counts are experimental: their accuracy is not yet measured.
A language model drew the claims from the paper on 2026-10-10, under version 3 of the claim definition (model deepseek-v4.1-flash, prompt extract-v3).
A second model labelled each claim on 2026-10-10 (model jev-1.13-20260917, definition revision gold-guideline-v0.2).
Cited sources are checked with a language model’s help (gpt-6-sol).
Statistics and arithmetic are recomputed, not judged.
Confidence bands are shown only for fields calibrated on our annotated test set. None is calibrated yet, so no band is shown.
What counts as a claim ›How we measure confidence ›How we check this ›
Are you an author, or do you see a problem with this page? Request a review
How to cite
Cite CoChat for the checks on this page, and the paper for its own findings.
- This page
- CoChat. (2026). Citation check: Robust differential expression testing for single-cell CRISPR screens at low multiplicity of infection. https://app.cochat.ai/papers/10.1186/s13059-024-03254-2
- The paper
- Barry, T., Mason, K., Roeder, K., & Katsevich, E. (2024). Robust differential expression testing for single-cell CRISPR screens at low multiplicity of infection. Genome Biology. https://doi.org/10.1186/s13059-024-03254-2
Data sources
Bibliographic data: Semantic Scholar, OpenAlex, Crossref.
Contains information from the Semantic Scholar Academic Graph Datasets, made available under the ODC Attribution License (ODC-BY 1.0).
Semantic Scholar’s data is described in: Kinney, R., et al. (2023). The Semantic Scholar Open Data Platform. arXiv:2301.10140.
