

The DOI matches its Crossref record; 1 of the 1 references it cites were found in a registry or an index.
Occurrence of Escherichia coli and faecal coliforms in drinking water at source and household point-of-use in Rohingya camps, Bangladesh
Open accessAbstract
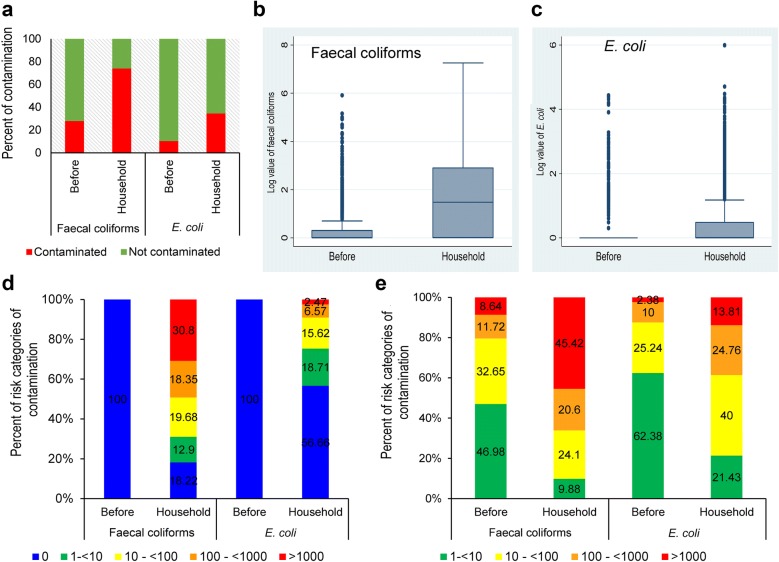
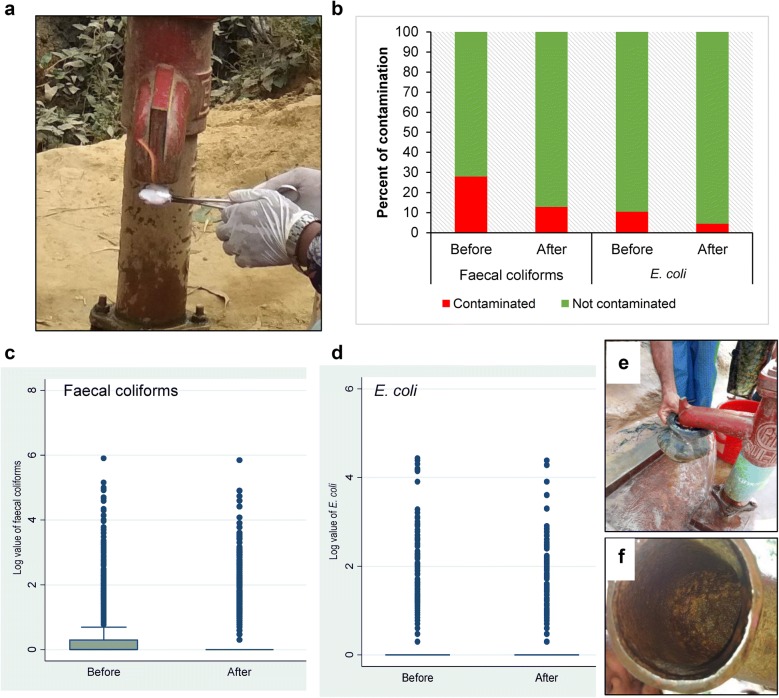
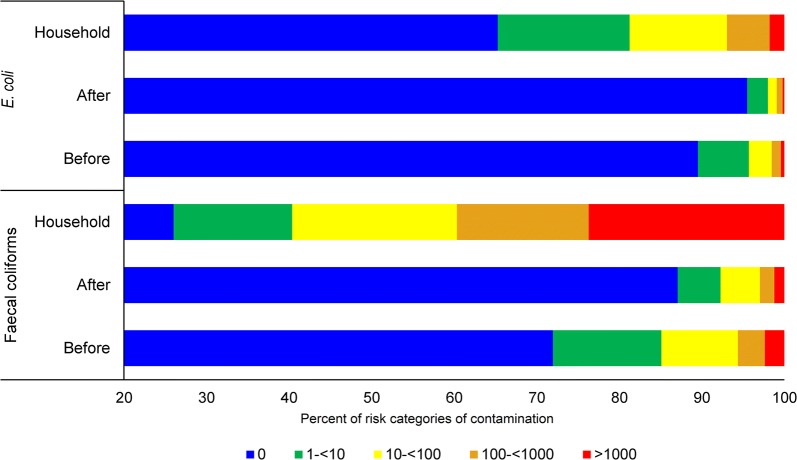
Background: Safe water is essential for life but unsafe for human consumption if it is contaminated with pathogenic microorganisms. An acceptable quality of water supply (adequate, safe and accessible) must be ensured to all human beings for a healthy life. Methods: We collected and analyzed a total of 12,650 drinking water samples, for the presence of Escherichia coli and faecal coliforms, from a large habitation of the displaced Rohingya population comprising of about 1.16 million people living within 4 km 2 . Results: We found that 28% (n = 893) water samples derived from tubewells were contaminated with faecal coliforms and 10.5% (n = 333) were contaminated with E. coli ; also, 73.96% (n = 4644) samples from stored household sources (at point of use—POU) were found contaminated with faecal coliforms while 34.7% (n = 2179) were contaminated with E. coli. It was observed that a higher percentage of POU samples fall in the highest risk category than that of their corresponding sources. Conclusions: From our findings, it appears that secondary contamination could be a function of very high population density and could possibly occur during collection, transportation, and storage of water due to lack of knowledge of personal and domestic hygiene. Hence, awareness campaign is necessary, and the contaminated sources should be replaced. Further, the POU water should be treated by a suitable method.
Overview
The claims and statistics of this paper haven’t been checked yet.
Run the check — free, no account needed. It reads the open-access text and checks the sources it cites.
Integrity signals
Registry
Cites
Statistics
Figures
Verification
Claims the paper makes
The claims and statistics of this paper haven’t been checked yet.
Run the check — free, no account needed. It reads the open-access text and checks the sources it cites.
Claims other papers make about this one
Each is checked against this paper’s own text: does it say what the citing paper says it does?
The cited source says what the claim attributes to it.
In the citing paper
“This suggests that the high-density population in the camps, along with inadequate hygienic practices, is possibly resulting in the secondary contamination of drinking water during collection, transportation, and storage [29].”
From Drinking Water Security Challenges in Rohingya Refugee Camps of Cox’s Bazar, Bangladesh (2020) · cites this paper as [29]
The cited source says what the claim attributes to it.
In the citing paper
“One study analyzed 12,650 drinking water samples from the camps and found fecal contamination in 28% of the source samples and in 73.96% of the storage samples [29].”
From Drinking Water Security Challenges in Rohingya Refugee Camps of Cox’s Bazar, Bangladesh (2020) · cites this paper as [29]
The cited source says what the claim attributes to it.
In the citing paper
“Water, both at source and storage in Rohingya refugee camps, has been found to have high levels of contamination.”
From Drinking Water Security Challenges in Rohingya Refugee Camps of Cox’s Bazar, Bangladesh (2020) · cites this paper as [29]
Self-check
Percentages, sums and reported differences re-computed from the paper’s own numbers.
The self-check needs the paper’s full text.
Citations
Cites
Ensuring Safe Drinking Water in Bangladesh
Ahmed, M. F., Ahuja, S., Alauddin, M., Hug, S. J., Lloyd, J. R., Pfaff, A., Pichler, T., Saltikov, C., Stute, M., & van Geen, A. (2006) · Science · doi:10.1126/science.1133146 · Cited by 298
Research works printed but not linked: 27
- Islam MM, Nuzhath T. Health risks of Rohingya refugee population in Bangladesh: a call for global attention. J Glob Health. 2018;8:20309. · DOI · Paper page
- Mokomane M, Kasvosve I, de Melo E, Pernica JM, Goldfarb DM. The global problem of childhood diarrhoeal diseases: emerging strategies in prevention and management. Ther Adv Infect Dis. 2018;5:29–43.
- Mead PS, Slutsker L, Dietz V, McCaig LF, Bresee JS, Shapiro C, et al. Food-related illness and death in the United States. Emerg Infect Dis. 1999;5:607. · DOI
- Mahbub KR, Nahar A, Ahmed MM, Chakraborty A. Quality analysis of Dhaka WASA drinking water: detection and biochemical characterization of the isolates. J Environ Sci Nat Res. 2011;4:41–9.
- Pande G, Kwesiga B, Bwire G, Kalyebi P, Riolexus A, Matovu JKB, et al. Cholera outbreak caused by drinking contaminated water from a lakeshore water-collection site, Kasese District, south-western Uganda, June-July 2015. PLoS ONE. 2018;13:e0198431. · DOI
- Bennett SD, Lowther SA, Chingoli F, Chilima B, Kabuluzi S, Ayers TL, et al. Assessment of water, sanitation and hygiene interventions in response to an outbreak of typhoid fever in Neno District, Malawi. PLoS ONE. 2018;13:e0193348. · DOI
- Nicholson KN, Neumann K, Dowling C, Sharma SE. E. coli and coliform bacteria as indicators for drinking water quality and handling of drinking water in the Sagarmatha National Park, Nepal. Environ Manag Sustain Dev. 2017;6:411–28. · DOI
- Wright J, Gundry S, Conroy R. Household drinking water in developing countries: a systematic review of microbiological contamination between source and point-of-use. Trop Med Int Health. 2004;9:106–17. · DOI
- National Research Council. Indicators for waterborne pathogens. Washington (DC): National Academies Press; 2004.
- Kuberan A, Singh AK, Kasav JB, Prasad S, Surapaneni KM, Upadhyay V, et al. Water and sanitation hygiene knowledge, attitude, and practices among household members living in rural setting of India. J Nat Sci Biol Med. 2015;6:S69. · DOI
- Ojima M, Toshima Y, Koya E, Ara K, Tokuda H, Kawai S, et al. Hygiene measures considering actual distributions of microorganisms in Japanese households. J Appl Microbiol. 2002;93:800–9. · DOI
- Woroszyło C, Choi B, Profitos JH, Lee J, Garabed R, Rempala GA. Modeling household transmission dynamics: application to waterborne diarrheal disease in Central Africa. PLoS ONE. 2018;13:e0206418. · DOI
- Budeli P, Moropeng RC, Mpenyana-Monyatsi L, Momba MNB. Inhibition of biofilm formation on the surface of water storage containers using biosand zeolite silver-impregnated clay granular and silver impregnated porous pot filtration systems. PLoS ONE. 2018;13:e0194715. · DOI
- Clasen TF, Bastable A. Faecal contamination of drinking water during collection and household storage: the need to extend protection to the point of use. J Water Health. 2003;1:109–15. · DOI
- Fiksdal L, Maki JS, LaCroix SJ, Staley JT. Survival and detection of Bacteroides spp., prospective indicator bacteria. Appl Environ Microbiol. 1985;49:148–50. · DOI
- Allsop K, Stickler DJ. An assessment of Bacteroides fragilis group organisms as indicators of human faecal pollution. J Appl Bacteriol. 1985;58:95–9. · DOI
- Ryu J-H, Beuchat LR. Biofilm formation by Escherichia coli O157: H7 on stainless steel: effect of exopolysaccharide and curli production on its resistance to chlorine. Appl Environ Microbiol. 2005;71:247–54. · DOI
- Escamilla V, Knappett PSK, Yunus M, Streatfield PK, Emch M. Influence of latrine proximity and type on tubewell water quality and diarrheal disease in Bangladesh. Ann Assoc Am Geogr. 2013;103:299–308. · DOI
- Rahman SH, Ahmed S, Jakariya M. Investigation of shallow tube-well water quality considering the influence of nearby latrines in a rural village of Bangladesh. IAHS Publ. 2009;20:299.
- Mal BC, Mishra AP. Low-cost tubewells for developing countries. Int J Dev Technol. 1986;4:197–203.
- Arnold BF, Colford JM Jr. Treating water with chlorine at point-of-use to improve water quality and reduce child diarrhea in developing countries: a systematic review and meta-analysis. Am J Trop Med Hyg. 2007;76:354–64. · DOI
- World Health Organization. Preventing diarrhoea through better water, sanitation and hygiene: exposures and impacts in low-and middle-income countries. Geneva: World Health Organization; 2014.
- Brown J, Clasen T. High adherence is necessary to realize health gains from water quality interventions. PLoS ONE. 2012;7:e36735. · DOI
- Enger KS, Nelson KL, Rose JB, Eisenberg JNS. The joint effects of efficacy and compliance: a study of household water treatment effectiveness against childhood diarrhea. Water Res. 2013;47:1181–90. · DOI
- World Health Organization. Guidelines for drinking-water quality, 4th edition, incorporating the 1st addendum. World Health Organization; 2017.
- Hachich EM, Di Bari M, Christ APG, Lamparelli CC, Ramos SS, Sato MIZ. Comparison of thermotolerant coliforms and Escherichia coli densities in freshwater bodies. Braz J Microbiol. 2012;43:675–81. · DOI
- Mwabi JK, Mamba BB, Momba MNB. Removal of Escherichia coli and faecal coliforms from surface water and groundwater by household water treatment devices/systems: a sustainable solution for improving water quality in rural communities of the Southern African development community region. Int J Environ Res Public Health. 2012;9:139–70. · DOI
Cited by
Sorted by citations
Drinking Water Security Challenges in Rohingya Refugee Camps of Cox’s Bazar, Bangladesh
Akhter, M., Uddin, S. M. N., Rafa, N., Hridi, S. M., Staddon, C., & Powell, W. (2020) · Sustainability · doi:10.3390/su12187325 · Cited by 68
Metadata
- Authors
- Mahmud, Z. H., Islam, M. S., Imran, K. M., Hakim, S. A. I., Worth, M., Ahmed, A., Hossan, S., Haider, M., Islam, M. R., Hossain, F., Johnston, D., & Ahmed, N.
- Affiliations
- International Centre for Diarrhoeal Disease Research (BD)
- United Nations Children's Fund (US)
- Corresponding author
- Mahmud, Zahid Hayat
- ORCID
- Venue
- Gut Pathogens
- Published
- 2019-11-01
- Volume
- 11
- Issue
- 1
- Pages
- 52-52
- ISSN
- 1757-4749 (ISSN-L)
- PMC
- PMC6824040
- OpenAlex
- W2989360098
- Cited by
- 92
- References
- 1
- Citations by year
- 2026: 8 · 2025: 15 · 2024: 18 · 2023: 16 · 2022: 13 · 2021: 12 · 2020: 10
- FWCI
- 3.17
- Type
- journal article
- Language
- en
- Open access
- gold
- doi.org
- Locations
- Gut Pathogens (publishedVersion, cc-by)
- Europe PMC (PubMed Central) (publishedVersion, cc-by)
- PubMed Central (publishedVersion, cc-by)
- PubMed (publishedVersion)
- DOAJ (DOAJ: Directory of Open Access Journals) (submittedVersion, cc-by-sa)
- Funders
- unicef (BCO/PCA/2017/035-2018/001)
- Topics
- Physical Sciences › Environmental Science › Water Science and Technology › Fecal contamination and water quality
- Life Sciences › Agricultural and Biological Sciences › Food Science › Food Safety and Hygiene
- Physical Sciences › Environmental Science › Health, Toxicology and Mutagenesis › Public Health and Environmental Issues
- Keywords
- Escherichia coli, fecal coliforms, drinking water contamination, household water storage, tube wells, Rohingya refugee camps, population density, hygiene awareness, water treatment
About these checks
Registry, retraction, Cites and statistics results are computed, not judged, with one exception: a printed reference that no index lists is read once by a model before it counts as a citation error. Claims are extracted by a model and kept only when their quote appears verbatim in the text; each cited source is then checked, with a model’s help, for whether it says what the claim relies on. Those verdicts can be wrong — read the claim’s quote and the cited source before relying on one.
Statistics and arithmetic are recomputed, not judged.
Confidence bands are shown only for fields calibrated on our annotated test set. None is calibrated yet, so no band is shown.
What counts as a claim ›How we measure confidence ›How we check this ›
Are you an author, or do you see a problem with this page? Request a review
