

The DOI matches its Crossref record; 103 of the 103 references it cites were found in a registry or an index.
Imaging diagnosis and staging of pancreatic ductal adenocarcinoma: a comprehensive review
Open accessAbstract
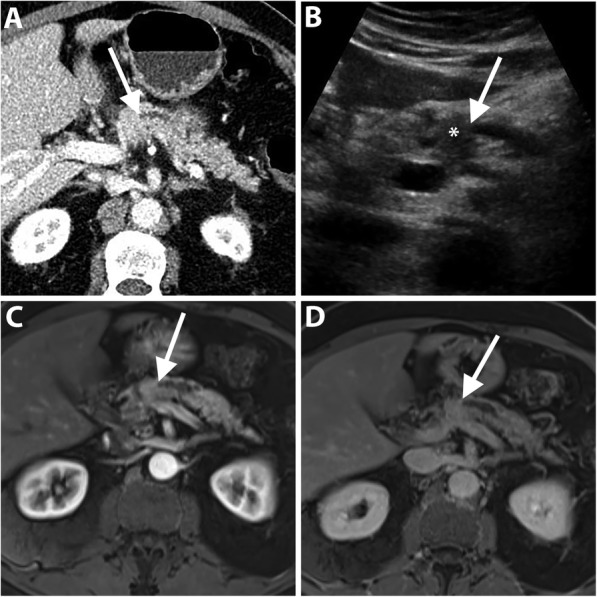
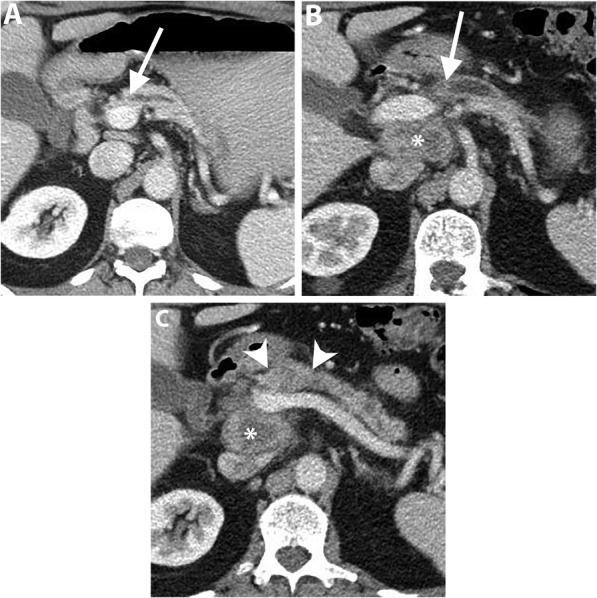
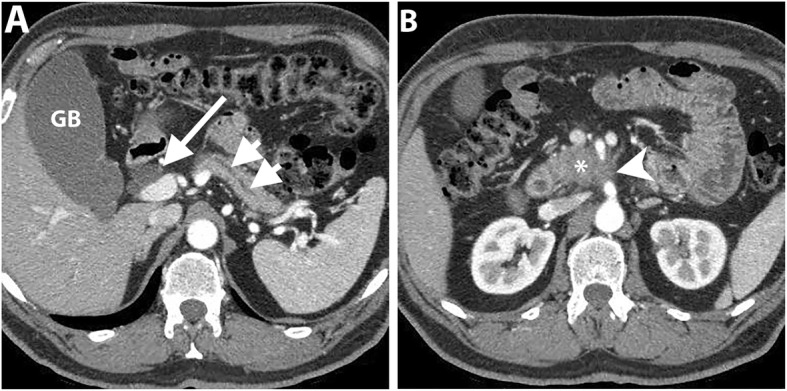
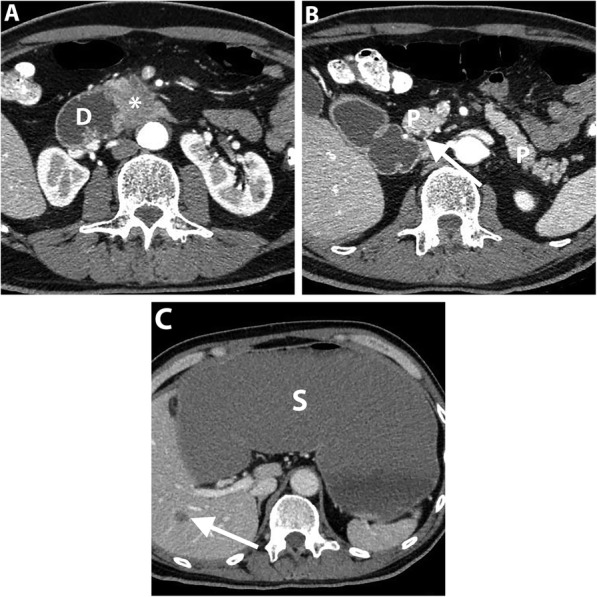
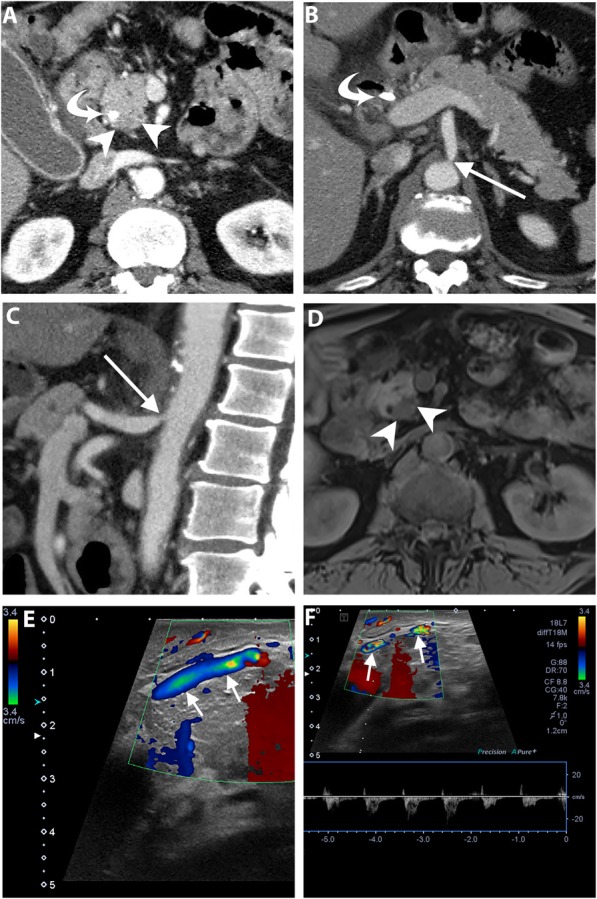
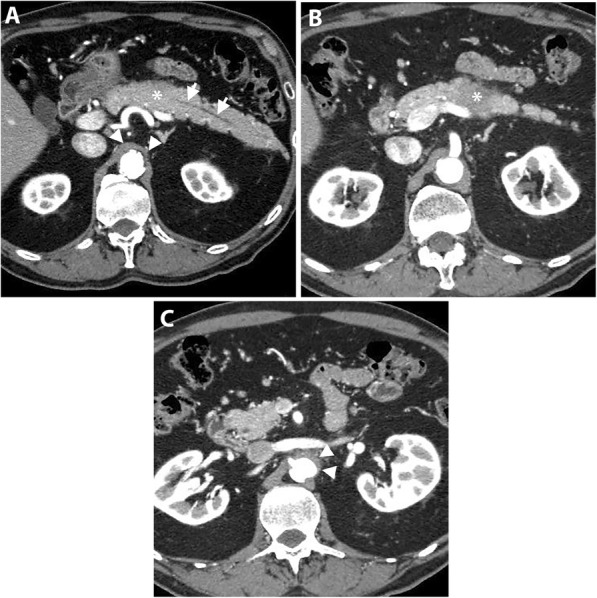
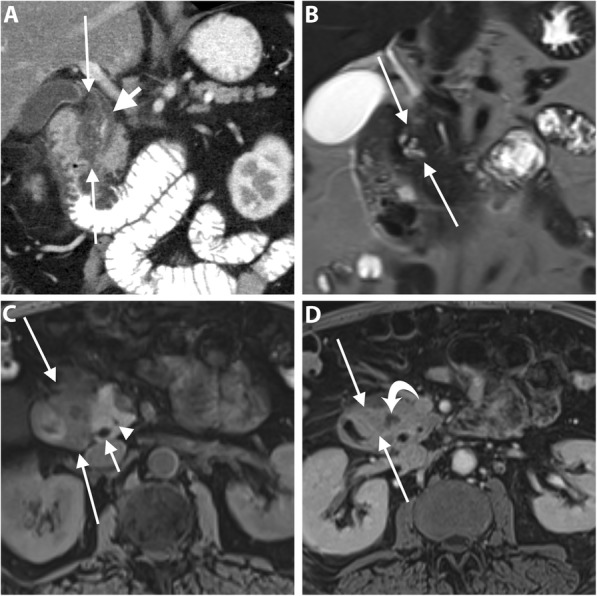
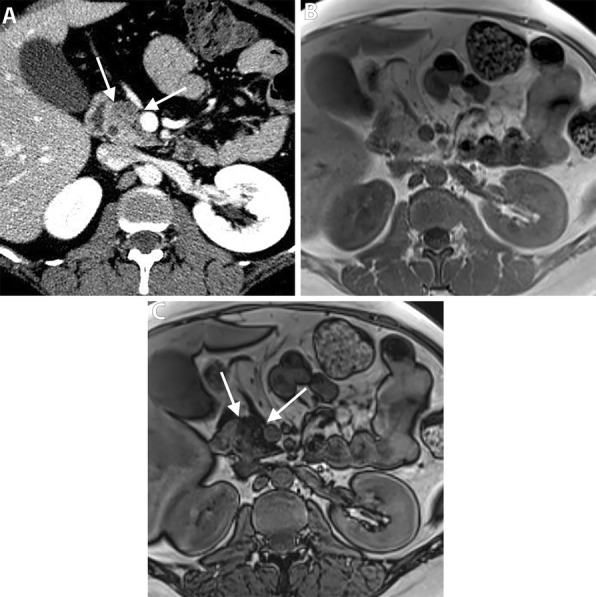
Pancreatic ductal adenocarcinoma (PDAC) has continued to have a poor prognosis for the last few decades in spite of recent advances in different imaging modalities mainly due to difficulty in early diagnosis and aggressive biological behavior. Early PDAC can be missed on CT due to similar attenuation relative to the normal pancreas, small size, or hidden location in the uncinate process. Tumor resectability and its contingency on the vascular invasion most commonly assessed with multi-phasic thin-slice CT is a continuously changing concept, particularly in the era of frequent neoadjuvant therapy. Coexistent celiac artery stenosis may affect the surgical plan in patients undergoing pancreaticoduodenectomy. In this review, we discuss the challenges related to the imaging of PDAC. These include radiological and clinical subtleties of the tumor, evolving imaging criteria for tumor resectability, preoperative diagnosis of accompanying celiac artery stenosis, and post-neoadjuvant therapy imaging. For each category, the key imaging features and potential pitfalls on cross-sectional imaging will be discussed. Also, we will describe the imaging discriminators of potential mimickers of PDAC.
Overview
The claims and statistics of this paper haven’t been checked yet.
Run the check — free, no account needed. It reads the open-access text and checks the sources it cites.
Integrity signals
Registry
Cites
Statistics
Figures
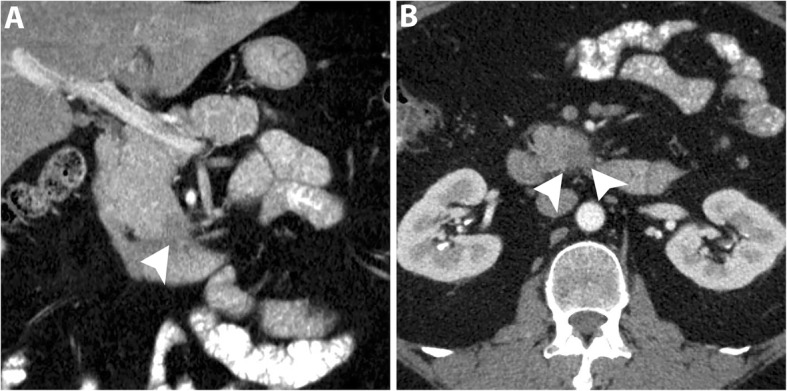
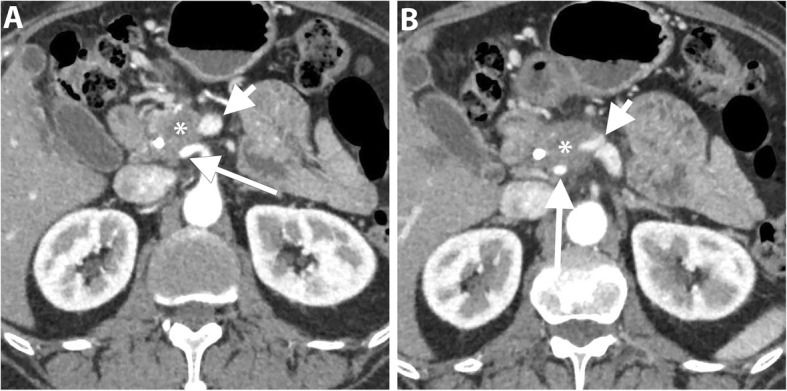
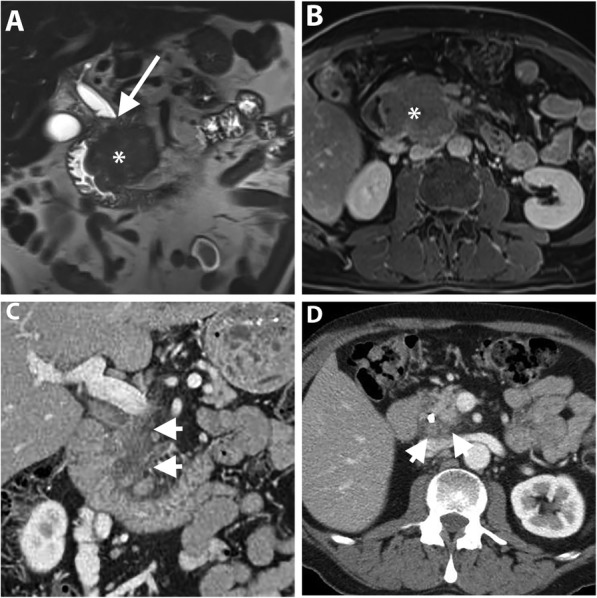
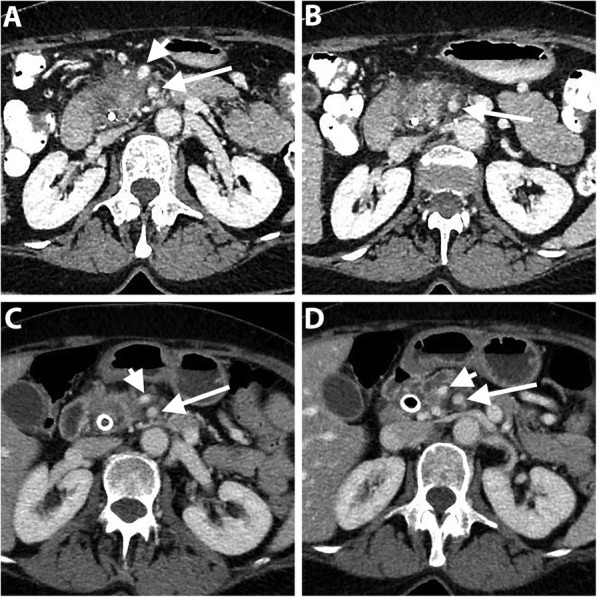
Verification
Claims the paper makes
The claims and statistics of this paper haven’t been checked yet.
Run the check — free, no account needed. It reads the open-access text and checks the sources it cites.
Claims other papers make about this one
Each is checked against this paper’s own text: does it say what the citing paper says it does?
The cited source says what the claim attributes to it.
In the citing paper
“However, MPD abnormalities are not specific to PDAC and are often observed in benign pancreatic diseases.”
Self-check
Percentages, sums and reported differences re-computed from the paper’s own numbers.
The self-check needs the paper’s full text.
Citations
Cites
Siegel, R. L., Miller, K. D., & Jemal, A. (2016) · CA: A Cancer Journal for Clinicians · doi:10.3322/caac.21332 · Cited by 16,003
Spencer, P. M., Cameron, J. L., & Lin, L. (2000) · Cited by 7,202
Vincent, A., Herman, J. M., Schulick, R., Hruban, R. H., & Goggins, M. (2011) · The Lancet · doi:10.1016/s0140-6736(10)62307-0 · Cited by 2,678
Hidalgo, M. (2010) · New England Journal of Medicine · doi:10.1056/nejmra0901557 · Cited by 2,570
Kamisawa, T., Wood, L. D., Itoi, T., & Takaori, K. (2016) · The Lancet · doi:10.1016/s0140-6736(16)00141-0 · Cited by 2,212
Gillen, S., Schuster, T., Büschenfelde, C. M. Z., Frieß, H., & Kleeff, J. H. (2010) · PLoS Medicine · doi:10.1371/journal.pmed.1000267 · Cited by 1,554
International Consensus Diagnostic Criteria for Autoimmune Pancreatitis
Shimosegawa, T., Chari, S. T., Frulloni, L., Kamisawa, T., Kawa, S., Mino-Kenudson, M. A., Kim, M.-H., Klöppel, G., Lerch, M. M., Löhr, M. J., et al. (2011) · Pancreas · doi:10.1097/mpa.0b013e3182142fd2 · Cited by 1,529
Pancreatic Adenocarcinoma, Version 2.2017, NCCN Clinical Practice Guidelines in Oncology
Tempero, M. A., Malafa, M. P., Al-Hawary, M. M., Asbun, H. J., Bain, A. J., Behrman, S. W., Benson, A. B., Binder, E. F., Cardin, D. B., Cha, C. H., et al. (2017) · Journal of the National Comprehensive Cancer Network · doi:10.6004/jnccn.2017.0131 · Cited by 1,037
Callery, M. P., Chang, K. J., Fishman, E. K., Talamonti, M. S., Traverso, L. W., & Linehan, D. C. (2009) · Annals of Surgical Oncology · doi:10.1245/s10434-009-0408-6 · Cited by 901
Borderline Resectable Pancreatic Cancer: Definitions, Management, and Role of Preoperative Therapy
Varadhachary, G. R., Tamm, E. P., Abbruzzese, J. L., Xiong, H. Q., Crane, C. H., Wang, H., Lee, J. E., Pisters, P. W. T., Evans, D. B., & Wolff, R. A. (2006) · Annals of Surgical Oncology · doi:10.1245/aso.2006.08.011 · Cited by 876
Isaji, S., Mizuno, S., Windsor, J. A., Bassi, C., Castillo, C. F. F.-D., Hackert, T., Hayasaki, A., Katz, M. H. G., Kim, S., Kishiwada, M., et al. (2017) · Pancreatology · doi:10.1016/j.pan.2017.11.011 · Cited by 806
Challenges in diagnosis of pancreatic cancer
Zhang, L., Sanagapalli, S., & Stoita, A. (2018) · World Journal of Gastroenterology · doi:10.3748/wjg.v24.i19.2047 · Cited by 600
Lu, D., Reber, H. A., Krasny, R. M., Kadell, B. M., & Sayre, J. W. (1997) · American Journal of Roentgenology · doi:10.2214/ajr.168.6.9168704 · Cited by 543
Al-Hawary, M. M., Francis, I. R., Chari, S. T., Fishman, E. K., Hough, D. M., Lu, D., Macari, M., Megibow, A. J., Miller, F. H., Mortelé, K. J., et al. (2013) · Radiology · doi:10.1148/radiol.13131184 · Cited by 490
Pancreatic tumors: comparison of dual-phase helical CT and endoscopic sonography.
Legmann, P., Vignaux, O., Dousset, B. E., Baraza, A. J., Palazzo, L., Dumontier, I., Coste, J., Louvel, A., Roseau, G., Couturier, D., et al. (1998) · American Journal of Roentgenology · doi:10.2214/ajr.170.5.9574609 · Cited by 423
Isoattenuating Pancreatic Adenocarcinoma at Multi–Detector Row CT: Secondary Signs
Prokesch, R. W., Chow, L. C., Beaulieu, C. F., Bammer, R., & Jeffrey, R. B. (2002) · Radiology · doi:10.1148/radiol.2243011284 · Cited by 337
Multicenter study of early pancreatic cancer in Japan
Kanno, A., Masamune, A., Hanada, K., Maguchi, H., Shimizu, Y., Ueki, T., Hasebe, O., Ohtsuka, T., Nakamura, M., Takenaka, M., et al. (2018) · Pancreatology · doi:10.1016/j.pan.2017.11.007 · Cited by 291
Yoon, S. H., Lee, J. M., Cho, J. Y., Lee, K. B., Kim, J. E., Moon, S. K., Kim, S. J., Baek, J. H., Kim, S. H., Kim, S. H., et al. (2011) · Radiology · doi:10.1148/radiol.11101133 · Cited by 257
Pancreatic ductal adenocarcinoma: preoperative assessment with helical CT versus dynamic MR imaging.
Ichikawa, T., Haradome, H., Hachiya, J., Nitatori, T., Ohtomo, K., Kinoshitá, T., & Araki, T. (1997) · Radiology · doi:10.1148/radiology.202.3.9051012 · Cited by 256
High-b Value Diffusion-Weighted MRI for Detecting Pancreatic Adenocarcinoma: Preliminary Results
Ichikawa, T., Ertürk, Ş. M., Motosugi, U., Sou, H., Iino, H., Araki, T., & Fujii, H. (2007) · American Journal of Roentgenology · doi:10.2214/ajr.05.1918 · Cited by 251
Gangi, S., Fletcher, J. G., Nathan, M. A., Christensen, J. A., Harmsen, W. S., Crownhart, B. S., & Chari, S. T. (2004) · American Journal of Roentgenology · doi:10.2214/ajr.182.4.1820897 · Cited by 249
Kim, J. H., Park, S. H., Yu, E. S., Kim, M., Kim, J., Byun, J. H., Lee, S. S., Hwang, H. J., Hwang, J., Lee, S. S., et al. (2010) · Radiology · doi:10.1148/radiol.10100015 · Cited by 249
Dual-Phase Helical CT of Pancreatic Adenocarcinoma
Valls, C., Andía, E., Sanchez, A., Fabregat, J., Pozuelo, O., Quintero, J. C., Serrano, T., Borobia, F. J. G., & Jorba, R. (2002) · American Journal of Roentgenology · doi:10.2214/ajr.178.4.1780821 · Cited by 245
Pancreatic Endocrine Tumors: Radiologic-Clinicopathologic Correlation
Lewis, R. B., Lattin, G. E., & Paal, E. E. (2010) · Radiographics · doi:10.1148/rg.306105523 · Cited by 244
Multimodality Imaging of Neoplastic and Nonneoplastic Solid Lesions of the Pancreas
Low, G., Panu, A., Millo, N., & Leen, E. L. S. (2011) · Radiographics · doi:10.1148/rg.314105731 · Cited by 240
Detection of Small Pancreatic Tumors with Multiphasic Helical CT
Bronstein, Y., Loyer, E. M., Kaur, H., Choi, H., David, C. L., DuBrow, R. A., Broemeling, L. D., Cleary, K. R., & Charnsangavej, C. (2004) · American Journal of Roentgenology · doi:10.2214/ajr.182.3.1820619 · Cited by 240
IgG4-related Sclerosing Disease: Autoimmune Pancreatitis and Extrapancreatic Manifestations
Vlachou, P. A., Khalili, K., Jang, H., Fischer, S. E., Hirschfield, G. M., & Kim, T. K. (2011) · Radiographics · doi:10.1148/rg.315105735 · Cited by 233
Self-citationDiffusion-weighted MR Imaging of the Pancreas: Current Status and Recommendations
Barral, M., Taouli, B. A., Guiu, B., Koh, D., Luciani, A., Manfredi, R. M., Vilgrain, V., Hoeffel, C. C., Kanematsu, M., & Soyer, P. A. (2014) · Radiology · doi:10.1148/radiol.14130778 · Cited by 208
Ischemic Complications After Pancreaticoduodenectomy
Gaujoux, S., Sauvanet, A., Vullierme, M., Cortès, A., Dokmak, S., Sibert, A., Vilgrain, V., & Belghiti, J. (2008) · Annals of Surgery · doi:10.1097/sla.0b013e3181930249 · Cited by 195
Pancreatic Adenocarcinoma Staging in the Era of Preoperative Chemotherapy and Radiation Therapy
Zins, M., Matos, C., & Cassinotto, C. (2018) · Radiology · doi:10.1148/radiol.2018171670 · Cited by 188
Pelaez-Luna, M., Takahashi, N., Fletcher, J. G., & Chari, S. T. (2007) · The American Journal of Gastroenterology · doi:10.1111/j.1572-0241.2007.01480.x · Cited by 180
Diffusion-weighted MR Imaging of Solid and Cystic Lesions of the Pancreas
Wang, Y., Miller, F. H., Chen, Z. E., Merrick, L., Mortelé, K. J., Hoff, F. L., Hammond, N. A., Yaghmai, V., & Nikolaidis, P. (2011) · Radiographics · doi:10.1148/rg.313105174 · Cited by 176
Collateral Pathways in Patients with Celiac Axis Stenosis: Angiographic–Spiral CT Correlation
Song, S.-Y., Chung, J. W., Kwon, J. W., Joh, J. H., Shin, S. J., Kim, H. B., & Park, J. H. (2002) · Radiographics · doi:10.1148/radiographics.22.4.g02jl13881 · Cited by 171
Diffusion-weighted magnetic resonance imaging of pancreas tumours
Kartalis, N., Lindholm, T. L., Aspelin, P., Permert, J., & Albiin, N. (2009) · European Radiology · doi:10.1007/s00330-009-1384-8 · Cited by 167
Contrast-enhanced EUS for differential diagnosis of pancreatic mass lesions: a meta-analysis
Gong, T., Hu, D., & Zhu, Q. (2012) · Gastrointestinal Endoscopy · doi:10.1016/j.gie.2012.02.051 · Cited by 159
Multidetector CT of Peritoneal Carcinomatosis from Ovarian Cancer
Pannu, H. K., Bristow, R. E., Montz, F. J., & Fishman, E. K. (2003) · Radiographics · doi:10.1148/rg.233025105 · Cited by 159
Uneven fatty replacement of the pancreas: evaluation with CT.
Matsumoto, S., Mori, H., Miyake, H., Takaki, H., Maeda, T., Yamada, Y., & Oga, M. (1995) · Radiology · doi:10.1148/radiology.194.2.7824726 · Cited by 158
Cassinotto, C., Cortade, J., Belleannée, G., Lapuyade, B., Terrebonne, É., Vendrely, V., Laurent, C., & Cunha, A. S. (2012) · European Journal of Radiology · doi:10.1016/j.ejrad.2012.12.002 · Cited by 157
Staging of Pancreatic Adenocarcinoma by Imaging Studies
Wong, J. C., & Lu, D. (2008) · Clinical Gastroenterology and Hepatology · doi:10.1016/j.cgh.2008.09.014 · Cited by 153
Vascular Anomalies Encountered During Pancreatoduodenectomy: Do They Influence Outcomes?
Shukla, P. J., Barreto, S. G., Kulkarni, A. V., Nagarajan, G., & Fingerhut, A. L. (2009) · Annals of Surgical Oncology · doi:10.1245/s10434-009-0757-1 · Cited by 151
Raman, S. P., Horton, K. M., & Fishman, E. K. (2012) · The Cancer Journal · doi:10.1097/ppo.0b013e318274a461 · Cited by 151
Radiology of pancreatic adenocarcinoma: Current status of imaging
Sahani, D. V., Shah, Z. K., Catalano, O. A., Boland, G. W., & Brugge, W. R. (2007) · Journal of Gastroenterology and Hepatology · doi:10.1111/j.1440-1746.2007.05117.x · Cited by 144
Cassinotto, C., Mouries, A., Lafourcade, J.-P., Terrebonne, É., Belleannée, G., Blanc, J., Lapuyade, B., Vendrely, V., Laurent, C., Chiche, L., et al. (2014) · Radiology · doi:10.1148/radiol.14132914 · Cited by 143
Pancreatic Adenocarcinoma: Value of Multidetector CT Angiography in Preoperative Evaluation
Zamboni, G. A., Kruskal, J. B., Vollmer, C. M., Baptista, J., Callery, M. P., & Raptopoulos, V. D. (2007) · Radiology · doi:10.1148/radiol.2453061795 · Cited by 140
Pancreatic head cancer: accuracy of CT in determination of resectability
Karmazanovsky, G. G., Fedorov, V. D., Va, K., & Kotchatkov, A. (2005) · Abdominal Imaging · doi:10.1007/s00261-004-0279-z · Cited by 138
The value of advanced MRI techniques in the assessment of cervical cancer: a review
Dappa, E., Elger, T., Hasenburg, A., Düber, C., Battista, M. J., & Hötker, A. M. (2017) · Insights into Imaging · doi:10.1007/s13244-017-0567-0 · Cited by 133
Anisotropic diffusion in kidney: Apparent diffusion coefficient measurements for clinical use
Fukuda, Y., Ohashi, I., Hanafusa, K., Nakagawa, T., Ohtani, S., Annaka, Y., Hayashi, T., & Shibuya, H. (2000) · Journal of Magnetic Resonance Imaging · doi:10.1002/(sici)1522-2586(200002)11:2 · Cited by 128
Muhi, A., Ichikawa, T., Motosugi, U., Sou, H., Sano, K., Tsukamoto, T., Fatima, Z., & Araki, T. (2011) · Journal of Magnetic Resonance Imaging · doi:10.1002/jmri.22881 · Cited by 126
Imaging preoperatively for pancreatic adenocarcinoma.
Pietryga, J. A., & Morgan, D. E. (2015) · Europe PMC (PubMed Central) · doi:10.3978/j.issn.2078-6891.2015.024 · Cited by 126
Teardrop superior mesenteric vein: CT sign for unresectable carcinoma of the pancreas.
Hough, T. J., Raptopoulos, V., Siewert, B., & Matthews, J. B. (1999) · American Journal of Roentgenology · doi:10.2214/ajr.173.6.10584793 · Cited by 117
MRI Features of Groove Pancreatitis
Blasbalg, R., Baroni, R. H., da Costa, D. N., & Machado, M. C. C. (2007) · American Journal of Roentgenology · doi:10.2214/ajr.06.1244 · Cited by 112
Groove pancreatitis: a diagnostic challenge
Triantopoulou, C., Dervenis, C., Giannakou, N., Papailiou, J. A., & Prassopoulos, P. K. (2009) · European Radiology · doi:10.1007/s00330-009-1332-7 · Cited by 110
Imaging Findings and Clinical Features of Abdominal Vascular Compression Syndromes
Fong, J. K., Poh, A. C. C., Tan, A. G. S., & Taneja, R. (2014) · American Journal of Roentgenology · doi:10.2214/ajr.13.11598 · Cited by 110
Hur, B. Y., Lee, J. M., Lee, J. E., Park, J. Y., Kim, S. J., Joo, I., Shin, C., Baek, J. H., Kim, J. H., Han, J. K., et al. (2012) · Journal of Magnetic Resonance Imaging · doi:10.1002/jmri.23609 · Cited by 109
Groove pancreatic carcinomas: radiological and pathological findings
Gabata, T., Kadoya, M., Terayama, N., Sanada, J., Kobayashi, S., & Matsui, O. (2002) · European Radiology · doi:10.1007/s00330-002-1743-1 · Cited by 106
Imaging Tests for the Diagnosis and Staging of Pancreatic Adenocarcinoma
Treadwell, J. R., Zafar, H. M., Mitchell, M. D., Tipton, K. N., Teitelbaum, U., & Jue, J. J. (2016) · Pancreas · doi:10.1097/mpa.0000000000000524 · Cited by 106
Use of EUS-FNA in diagnosing pancreatic neoplasm without a definitive mass on CT
Wang, W., Shpaner, A., Krishna, S. G., Ross, W. A., Bhutani, M. S., Tamm, E. P., Raju, G. S., Xiao, L., Wolff, R. A., Fleming, J. B., et al. (2013) · Gastrointestinal Endoscopy · doi:10.1016/j.gie.2013.01.040 · Cited by 105
Anomalies, Anatomic Variants, and Sources of Diagnostic Pitfalls in Pancreatic Imaging
Borghei, P., Sokhandon, F., Shirkhoda, A., & Morgan, D. E. (2012) · Radiology · doi:10.1148/radiol.12112469 · Cited by 100
Jeon, S. K., Lee, J. M., Joo, I., Lee, E. S., Park, H. J., Jang, J., Ryu, J. K., Lee, K. B., & Han, J. K. (2017) · Radiology · doi:10.1148/radiol.2016160586 · Cited by 99
Zaky, A. M., Wolfgang, C. L., Weiss, M. J., Javed, A. A., Fishman, E. K., & Zaheer, A. (2016) · Radiographics · doi:10.1148/rg.2017160054 · Cited by 95
Koelblinger, C., Ba‐Ssalamah, A., Goetzinger, P., Puchner, S. B., Weber, M., Sahora, K., Scharitzer, M., Plank, C. M., & Schima, W. (2011) · Radiology · doi:10.1148/radiol.11101189 · Cited by 94
Focal Fatty Replacement of the Pancreas: Usefulness of Chemical Shift MRI
Kim, H. J., Byun, J. H., Park, S. H., Shin, Y. M., Kim, P. N., Ha, H. K., & Lee, M.-G. (2007) · American Journal of Roentgenology · doi:10.2214/ajr.05.1095 · Cited by 90
Kim, Y.-E., Park, M., Hong, H., Kang, C. M., Choi, J., Lim, J. S., Lee, W. J., Kim, M., & Kim, K. W. (2009) · Radiology · doi:10.1148/radiol.2502080501 · Cited by 87
Chang, S. T., Jeffrey, R. B., Patel, B. N., DiMaio, M. A., Rosenberg, J., Willmann, J. K., & Olcott, E. W. (2016) · Radiology · doi:10.1148/radiol.2016152790 · Cited by 85
Marion-Audibert, A.-M., Vullierme, M., Ronot, M., Mabrut, J., Sauvanet, A., Zins, M., Cuilleron, M., Cunha, A. S., Lévy, P., & Rode, A. (2018) · American Journal of Roentgenology · doi:10.2214/ajr.18.19640 · Cited by 85
Paraduodenal Pancreatitis: Clinical Performance of MR Imaging in Distinguishing from Carcinoma
Kalb, B. T., Martín, D. R., Sarmiento, J. M., Erickson, S. H., Gober, D. D., Tapper, E. B., Chen, Z., & Adsay, V. N. (2013) · Radiology · doi:10.1148/radiol.13112056 · Cited by 81
Multidetector CT Angiography of Pancreatic Carcinoma
Horton, K. M., & Fishman, E. K. (2002) · American Journal of Roentgenology · doi:10.2214/ajr.178.4.1780827 · Cited by 81
Pancreatic duct abnormalities in focal autoimmune pancreatitis: MR/MRCP imaging findings
Negrelli, R., Manfredi, R. M., Pedrinolla, B., Boninsegna, E., Ventriglia, A., Mehrabi, S., Frulloni, L., & Mucelli, R. P. (2014) · European Radiology · doi:10.1007/s00330-014-3371-y · Cited by 68
Sakorafas, G. H., Sarr, M. G., & Peros, G. (2007) · Journal of the American College of Surgeons · doi:10.1016/j.jamcollsurg.2007.09.002 · Cited by 68
Diagnostic accuracy of EUS and CT of vascular invasion in pancreatic cancer: a systematic review
Yang, R.-B., lu, M. A. T., Qian, X., Chen, J., Li, L., Wang, J., & Zhang, Y. (2014) · Journal of Cancer Research and Clinical Oncology · doi:10.1007/s00432-014-1728-x · Cited by 67
Lee, J. K., Kim, A. Y., Kim, P. N., Lee, M.-G., & Ha, H. K. (2008) · European Journal of Radiology · doi:10.1016/j.ejrad.2008.10.028 · Cited by 65
Topkan, E., Parlak, C., Kötek, A., Yapar, A. F., & Pehlivan, B. (2011) · BMC Gastroenterology · doi:10.1186/1471-230x-11-123 · Cited by 59
Metastatic disease to the pancreas: an imaging challenge
Triantopoulou, C., Kolliakou, E., Karoumpalis, I., Yarmenitis, S., & Dervenis, C. (2011) · Insights into Imaging · doi:10.1007/s13244-011-0144-x · Cited by 59
Jeon, S. K., Lee, J. M., Joo, I., Lee, D. H., Ahn, S. J., Woo, H., Lee, M. S., Jang, J., & Han, J. K. (2018) · European Radiology · doi:10.1007/s00330-017-5258-1 · Cited by 56
Matsumoto, I., Shirakawa, S., Shinzeki, M., Asari, S., Goto, T., Ajiki, T., Fukumoto, T., Kitajima, K., & Ku, Y. (2013) · Clinical Gastroenterology and Hepatology · doi:10.1016/j.cgh.2012.12.033 · Cited by 55
Nara, S., Sakamoto, Y., Shimada, K., Sano, T., Kosuge, T., Takahashi, Y., Onaya, H., & Yamamoto, J. (2005) · World Journal of Surgery · doi:10.1007/s00268-005-7878-x · Cited by 50
Current update on primary pancreatic lymphoma
Anand, D., Lall, C. G., Bhosale, P., Ganeshan, D., & Qayyum, A. (2016) · Abdominal Radiology · doi:10.1007/s00261-015-0620-8 · Cited by 49
Correlation of ADC With Pathological Treatment Response for Radiation Therapy of Pancreatic Cancer
Dalah, E. Z., Erickson, B. A., Oshima, K., Schött, D., Hall, W. A., Paulson, E. S., Tai, A., Knechtges, P., & Li, X. A. (2018) · Translational Oncology · doi:10.1016/j.tranon.2018.01.018 · Cited by 48
Focal Fatty Infiltration in the Head of the Pancreas
Kawamoto, S., Siegelman, S. S., Bluemke, D. A., Hruban, R. H., & Fishman, E. K. (2009) · Journal of Computer Assisted Tomography · doi:10.1097/rct.0b013e31815cff0d · Cited by 48
18F-fluorodeoxyglucose positron emission tomography in the diagnosis of small pancreatic cancer
Okano, K. (2011) · World Journal of Gastroenterology · doi:10.3748/wjg.v17.i2.231 · Cited by 47
Pancreas: Peritoneal Reflections, Ligamentous Connections, and Pathways of Disease Spread
Vikram, R., Balachandran, A., Bhosale, P., Tamm, E. P., Marcal, L. P., & Charnsangavej, C. (2009) · Radiographics · doi:10.1148/rg.e34 · Cited by 45
Lee, S., Kim, J. H., Kim, S. Y., Byun, J. H., Kim, H. J., Kim, M., Lee, M.-G., & Lee, S. S. (2018) · European Radiology · doi:10.1007/s00330-018-5565-1 · Cited by 45
Atri, M., Nazarnia, S., Mehio, A. R., Reinhold, C., & Bret, P. (1994) · Radiology · doi:10.1148/radiology.190.2.8284396 · Cited by 43
Response assessment in pancreatic ductal adenocarcinoma: role of imaging
Baliyan, V., Kordbacheh, H., Parakh, A., & Kambadakone, A. R. (2017) · Abdominal Radiology · doi:10.1007/s00261-017-1434-7 · Cited by 42
Celiac artery stenosis/occlusion treated by interventional radiology
Ikeda, O., Tamura, Y., Nakasone, Y., & Yamashita, Y. (2008) · European Journal of Radiology · doi:10.1016/j.ejrad.2008.05.005 · Cited by 41
Pizzi, A. D., Basilico, R., Cianci, R., Seccia, B., Timpani, M., Tavoletta, A., Caposiena, D., Faricelli, B., Gabrielli, D., & Caulo, M. (2018) · Insights into Imaging · doi:10.1007/s13244-018-0606-5 · Cited by 41
ACR Appropriateness Criteria® Staging of Pancreatic Ductal Adenocarcinoma
Qayyum, A., Tamm, E. P., Kamel, I. R., Allen, P. J., Arif‐Tiwari, H., Chernyak, V., Gonda, T. A., Grajo, J. R., Hindman, N. M., Horowitz, J. M., et al. (2017) · Journal of the American College of Radiology · doi:10.1016/j.jacr.2017.08.050 · Cited by 40
MR features of primary and secondary malignant lymphoma of the pancreas: a pictorial review
Fujinaga, Y., Lall, C. G., Patel, A. A., Matsushita, T., Sanyal, R., & Kadoya, M. (2013) · Insights into Imaging · doi:10.1007/s13244-013-0242-z · Cited by 40
Pancreatic neuroendocrine tumor: A multivariate analysis of factors influencing survival
Birnbaum, D. J., Turrini, O., Ewald, J., Barbier, L. A., Autret, A., Hardwigsen, J., Brunet, C., Moutardier, V., Treut, Y. P. L., & Delpéro, J. (2014) · European Journal of Surgical Oncology · doi:10.1016/j.ejso.2014.06.004 · Cited by 37
Tamada, T., Ito, K., Kanomata, N., Sone, T., Kanki, A., Higaki, A., Hayashida, M., & Yamamoto, A. (2015) · European Radiology · doi:10.1007/s00330-015-3880-3 · Cited by 37
Padilla-Thornton, A. E., Willmann, J. K., & Jeffrey, R. B. (2011) · European Radiology · doi:10.1007/s00330-011-2339-4 · Cited by 36
Kulkarni, N. M., Mannelli, L., Zins, M., Bhosale, P., Arif‐Tiwari, H., Brook, O. R., Hecht, E. M., Kastrinos, F., Wang, Z. J., Soloff, E. V., et al. (2019) · Abdominal Radiology · doi:10.1007/s00261-019-02290-y · Cited by 33
Paraduodenal pancreatitis: benign and malignant mimics at MRI
Mittal, P., Harri, P. A., Nandwana, S. B., Moreno, C. C., Muraki, T., Adsay, V. N., Cox, K. L., Pehlivanoğlu, B., Alexander, L. F., Chatterjee, A., et al. (2017) · Abdominal Radiology · doi:10.1007/s00261-017-1238-9 · Cited by 30
Seo, S., Doi, R., Machimoto, T., Kami, K., Masui, T., Hatano, E., Ogawa, K., Higashi, T., & Üemoto, S. (2008) · Journal of Hepato-Biliary-Pancreatic Surgery · doi:10.1007/s00534-007-1339-x · Cited by 29
Metastatic disease to the pancreas: pathologic spectrum and CT patterns
Ahmed, S., Johnson, P. T., Hruban, R. H., & Fishman, E. K. (2012) · Abdominal Imaging · doi:10.1007/s00261-012-9856-8 · Cited by 29
Bali, M. A., Pullini, S., Metens, T., Absil, J., Chao, S., Maréchal, R., Matos, C., Peerboccus, M., & Laethem, J. V. (2018) · European Journal of Radiology · doi:10.1016/j.ejrad.2018.04.024 · Cited by 29
Cancer of the uncinate process of the pancreas: surgical anatomy and clinicopathological features.
O’Sullivan, A., Heaton, N. D., & Rela, M. (2009) · PubMed · Cited by 26
Neoadjuvant therapy for resectable pancreatic cancer
Rahman, S. H., Urquhart, R., & Molinari, M. (2017) · World Journal of Gastrointestinal Oncology · doi:10.4251/wjgo.v9.i12.457 · Cited by 23
Kim, M., Jang, K. M., Kim, J., Jeong, W. K., Kim, S. H., Kang, T. W., Kim, Y. K., Cha, D. I., & Kim, K. (2016) · European Radiology · doi:10.1007/s00330-016-4522-0 · Cited by 19
Dual-Energy CT of the Pancreas
Mastrodicasa, D., Pizzi, A. D., & Patel, B. N. (2019) · Seminars in Ultrasound CT and MRI · doi:10.1053/j.sult.2019.05.002 · Cited by 18
Ultrasonographic diagnostic criteria for pancreatic cancer
Terminology and Diagnostic Criteria Committee, J. S. O. U. I. M. (2013) · Journal of Medical Ultrasonics · doi:10.1007/s10396-013-0483-y · Cited by 13
Pancreatic Cancer Within the Uncinate Process
Holländer, S., & Birk, D. (2018) · doi:10.1002/9781119188421.ch95 · Cited by 2
Pancreatic Adenocarcinoma, Version 1.2019.
Tempero, M. A., Malafa, M. P., Chiorean, E. G., Czito, B. G., Scaife, C., Narang, A. K., Fountzilas, C., Wolpin, B. M., Al-Hawary, M., Asbun, H., et al. (2019) · PubMed · doi:10.6004/jnccn.2019.0014
Cited by
Sorted by citations
From Machine Learning to Patient Outcomes: A Comprehensive Review of AI in Pancreatic Cancer
Tripathi, S., Tabari, A., Mansur, A., Dabbara, H., Bridge, C. P., & Daye, D. (2024) · Diagnostics · doi:10.3390/diagnostics14020174 · Cited by 70
Computed tomography-based radiomics approach in pancreatic tumors characterization
Karmazanovsky, G. G., Gruzdev, I. S., Tikhonova, V. S., Kondratyev, E. V., & Revishvili, A. S. (2021) · La radiologia medica · doi:10.1007/s11547-021-01405-0 · Cited by 61
Targeted Nanoparticle-Based Diagnostic and Treatment Options for Pancreatic Cancer
Gu, X., & Minko, T. (2024) · Cancers · doi:10.3390/cancers16081589 · Cited by 60
Gudmundsdottir, H., Yonkus, J. A., Alva‐Ruiz, R., Kendrick, M. L., Smoot, R. L., Warner, S. G., Starlinger, P. P., Thiels, C. A., Nagorney, D. M., Cleary, S. P., et al. (2023) · Journal of the American College of Surgeons · doi:10.1097/xcs.0000000000000704 · Cited by 49
Clinical features and prognostic impact of asymptomatic pancreatic cancer
Takikawa, T., Kikuta, K., Hamada, S., Kume, K., Miura, S., Yoshida, N., Tanaka, Y., Matsumoto, R., Ikeda, M., Kataoka, F., et al. (2022) · Scientific Reports · doi:10.1038/s41598-022-08083-6 · Cited by 47
Metadata
- Authors
- Elbanna, K. Y., Jang, H.-J., & Kim, T. K.
- Affiliations
- Mount Sinai Hospital (CA)
- Corresponding author
- Elbanna, Khaled Y.
- Venue
- Insights into Imaging
- Published
- 2020-04-25
- Volume
- 11
- Issue
- 1
- Pages
- 58-58
- ISSN
- 1869-4101 (ISSN-L)
- PMC
- PMC7183518
- OpenAlex
- W3020216905
- Semantic Scholar
- 39a22c3369f8e93fba45dd757563476bc863f51e
- Cited by
- 162
- References
- 103
- Citations by year
- 2026: 28 · 2025: 31 · 2024: 29 · 2023: 28 · 2022: 21 · 2021: 22 · 2020: 2
- FWCI
- 1.96
- Type
- journal article
- Language
- en
- Open access
- gold
- doi.org
- Locations
- Insights into Imaging (publishedVersion, cc-by)
- PubMed Central (publishedVersion, cc-by)
- PubMed (publishedVersion)
- TSpace (University of Toronto) (submittedVersion, cc-by)
- DOAJ (DOAJ: Directory of Open Access Journals) (submittedVersion, cc-by-sa)
- Topics
- Health Sciences › Medicine › Oncology › Pancreatic and Hepatic Oncology Research
- Health Sciences › Medicine › Radiology, Nuclear Medicine and Imaging › MRI in cancer diagnosis
- Health Sciences › Medicine › Radiology, Nuclear Medicine and Imaging › Medical Imaging Techniques and Applications
- Keywords
- pancreatic ductal adenocarcinoma, tumor resectability, celiac artery stenosis, pancreaticoduodenectomy, neoadjuvant therapy, tumor staging, early diagnosis, vascular invasion, uncinate process
About these checks
Registry, retraction, Cites and statistics results are computed, not judged, with one exception: a printed reference that no index lists is read once by a model before it counts as a citation error. Claims are extracted by a model and kept only when their quote appears verbatim in the text; each cited source is then checked, with a model’s help, for whether it says what the claim relies on. Those verdicts can be wrong — read the claim’s quote and the cited source before relying on one.
Statistics and arithmetic are recomputed, not judged.
Confidence bands are shown only for fields calibrated on our annotated test set. None is calibrated yet, so no band is shown.
What counts as a claim ›How we measure confidence ›How we check this ›
Are you an author, or do you see a problem with this page? Request a review
