Cited by 67

The DOI matches its Crossref record.

On the hepatic mechanism of HDL assembly by the ABCA1/apoA-I pathway

Tsujita, Maki, Wu, Cheng-Ai, Abe-Dohmae, Sumiko, Usui, Shinichi, Okazaki, Mitsuyo, Yokoyama, Shinji·2005·Journal of Lipid Research

Overview

The claims and statistics of this paper haven’t been checked yet.

Run the check — free, no account needed. It reads the open-access text and checks the sources it cites.

A few free checks a day · papers already verified open instantly · results are public

Integrity signals

Registry

Crossref · 10.1194/jlr.m400402-jlr200

Cites

Statistics

Figures

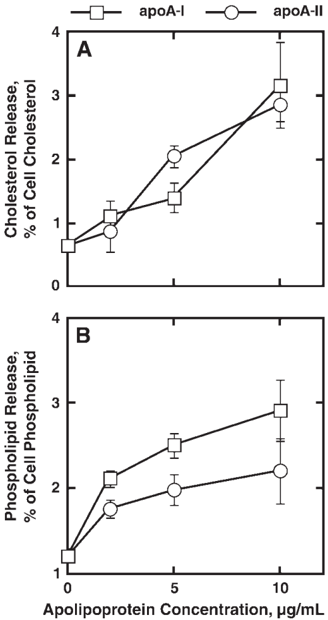
Fig. 1 Apolipoprotein-mediated lipid release from HepG2 cell. Cells were incubated for 16 h with minimum essential medium Eagle 𝛂 modification (MEM𝛂 ) containing 0.02% BSA and the indicated concentration of apolipoprotein A-I (apoA-I) or apoA-II. Cellular lipid released into the conditioned medium was extracted by organic solvent and analyzed by colorimetric enzymatic assay for cholesterol and choline-phospholipid as described. The values represent means ± SEM for three determinations. Open circles, exogenous human apoA-I; open squares, exogenous human apoA-II.
Fig. 1 Apolipoprotein-mediated lipid release from HepG2 cell. Cells were incubated for 16 h with minimum essential medium Eagle 𝛂 modification (MEM𝛂 ) containing 0.02% BSA and the indicated concentration of apolipoprotein A-I (apoA-I) or apoA-II. Cellular lipid released into the conditioned medium was extracted by organic solvent and analyzed by colorimetric enzymatic assay for cholesterol and choline-phospholipid as described. The values represent means ± SEM for three determinations. Open circles, exogenous human apoA-I; open squares, exogenous human apoA-II.CC-BY · From the PDF
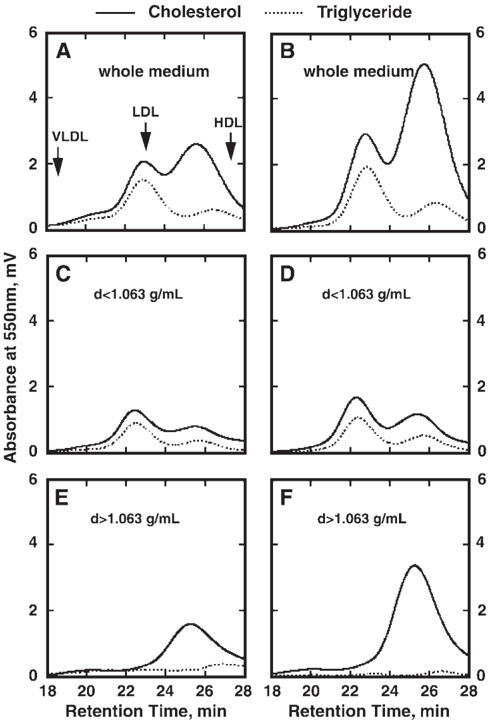
Fig. 2 Lipoprotein analysis of the culture medium of HepG2 cells by HPLC. Cells were incubated with MEM𝛂 containing 0.02% BSA with (B, D, F) or without (A, C, E) 10 𝛍 g/ml human apoA-I for 16 h. The conditioned medium of HepG2 cells (100 𝛍 l) was analyzed by the HPLC lipoprotein analysis system using two tandem gel-permeation columns (Lipopropak XL; 7.8 mm × 300 mm; Tosoh). The elution profile was monitored by an online assay system for total cholesterol (solid lines) and triacylglycerol (dotted lines). A and B: Whole conditioned medium. C and D: d > 1.063 g/ml fraction. E and F: d < 1.063 g/ml fraction. The eluting positions of human plasma VLDL, LDL, and HDL are indicated by arrows in A.
Fig. 2 Lipoprotein analysis of the culture medium of HepG2 cells by HPLC. Cells were incubated with MEM𝛂 containing 0.02% BSA with (B, D, F) or without (A, C, E) 10 𝛍 g/ml human apoA-I for 16 h. The conditioned medium of HepG2 cells (100 𝛍 l) was analyzed by the HPLC lipoprotein analysis system using two tandem gel-permeation columns (Lipopropak XL; 7.8 mm × 300 mm; Tosoh). The elution profile was monitored by an online assay system for total cholesterol (solid lines) and triacylglycerol (dotted lines). A and B: Whole conditioned medium. C and D: d > 1.063 g/ml fraction. E and F: d < 1.063 g/ml fraction. The eluting positions of human plasma VLDL, LDL, and HDL are indicated by arrows in A.CC-BY · From the PDF
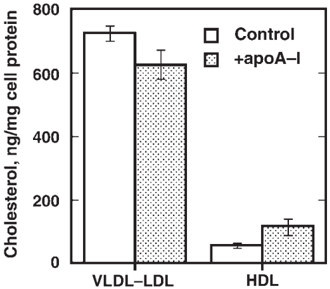
Fig. 3 Analysis of lipoprotein generated by mouse primary culture hepatocytes. Primary culture hepatocytes of C57Bl/6 mice were harvested using the Hanks'-EDTA and collagenase two-medium method described in Materials and Methods. The cells were incubated in DMEM (high glucose)/BSA medium with or without human apoA-I for 16 h. The conditioned medium was separated by ultracentrifugation at a density 1.063 g/ml. The data represent means ± SEM of three determinations. Difference in HDL between control and apoA-I ( + ) is significant by P < 0.005.
Fig. 3 Analysis of lipoprotein generated by mouse primary culture hepatocytes. Primary culture hepatocytes of C57Bl/6 mice were harvested using the Hanks'-EDTA and collagenase two-medium method described in Materials and Methods. The cells were incubated in DMEM (high glucose)/BSA medium with or without human apoA-I for 16 h. The conditioned medium was separated by ultracentrifugation at a density 1.063 g/ml. The data represent means ± SEM of three determinations. Difference in HDL between control and apoA-I ( + ) is significant by P < 0.005.CC-BY · From the PDF
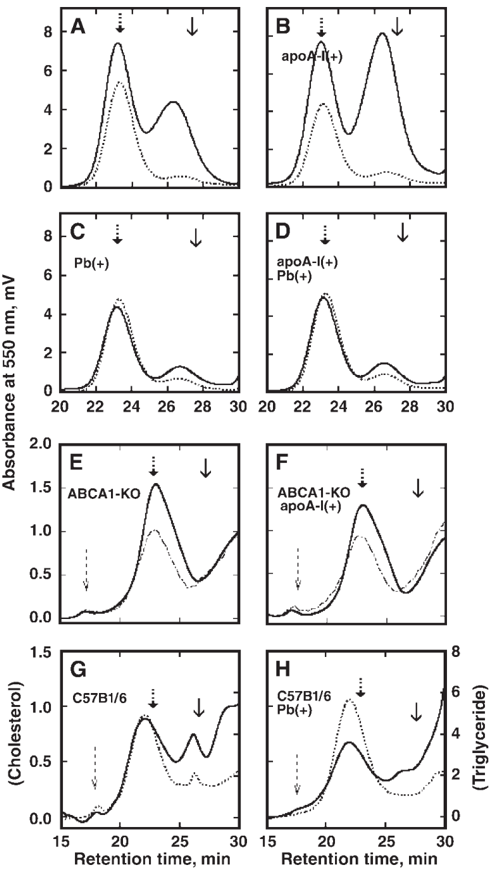
Fig. 4 The effect of ABCA1 inactivation on the generation of HDL by hepatocytes as analyzed by HPLC. A-D: HepG2 cells. A: The conditioned medium of HepG2 cells after 16 h. B: The conditioned medium incubated with apoA-I (10 𝛍 g/ml) for 16 h. C: The conditioned medium of probucol-loaded HepG2 cells after 16 h. D: The conditioned medium of probucol-loaded HepG2 cells with apoA-I (10 𝛍 g/ml) for 16 h. E-F: Primary cultured hepatocytes. E: The conditioned medium of the hepatocytes isolated from an ABCA1deficient mouse after 16 h of incubation. F: The conditioned medium of the hepatocytes of an ABCA1-deficient mouse after incubation with apoA-I (10 𝛍 g/ml) for 16 h. G: The conditioned medium of the hepatocytes obtained from C57Bl/6 mice fed with control chow after 16 h of incubation. H: The conditioned medium of the hepatocytes obtained from C57Bl/6 mice fed with 0.5% probucolcontaining chow. The medium was analyzed by HPLC using two tandem gel-permeation columns (Lipopropak XL; 7.8 mm × 300 mm; Tosoh) to yield the lipoprotein profiles as described in the text. Solid lines represent cholesterol, dotted lines represent triglyceride, and dot-and-broken lines (in E and F) represent cholinephospholipid. Arrows with a solid line, a thick broken line, and a thin broken line indicate the eluting positions of plasma HDL, LDL, and VLDL, respectively. Pseudopeaks generated by the color of the medium caused baseline shifts in the analysis of the primary culture medium as the sensitivity of the monitoring lipid was increased. KO, knockout.
Fig. 4 The effect of ABCA1 inactivation on the generation of HDL by hepatocytes as analyzed by HPLC. A-D: HepG2 cells. A: The conditioned medium of HepG2 cells after 16 h. B: The conditioned medium incubated with apoA-I (10 𝛍 g/ml) for 16 h. C: The conditioned medium of probucol-loaded HepG2 cells after 16 h. D: The conditioned medium of probucol-loaded HepG2 cells with apoA-I (10 𝛍 g/ml) for 16 h. E-F: Primary cultured hepatocytes. E: The conditioned medium of the hepatocytes isolated from an ABCA1deficient mouse after 16 h of incubation. F: The conditioned medium of the hepatocytes of an ABCA1-deficient mouse after incubation with apoA-I (10 𝛍 g/ml) for 16 h. G: The conditioned medium of the hepatocytes obtained from C57Bl/6 mice fed with control chow after 16 h of incubation. H: The conditioned medium of the hepatocytes obtained from C57Bl/6 mice fed with 0.5% probucolcontaining chow. The medium was analyzed by HPLC using two tandem gel-permeation columns (Lipopropak XL; 7.8 mm × 300 mm; Tosoh) to yield the lipoprotein profiles as described in the text. Solid lines represent cholesterol, dotted lines represent triglyceride, and dot-and-broken lines (in E and F) represent cholinephospholipid. Arrows with a solid line, a thick broken line, and a thin broken line indicate the eluting positions of plasma HDL, LDL, and VLDL, respectively. Pseudopeaks generated by the color of the medium caused baseline shifts in the analysis of the primary culture medium as the sensitivity of the monitoring lipid was increased. KO, knockout.CC-BY · From the PDF
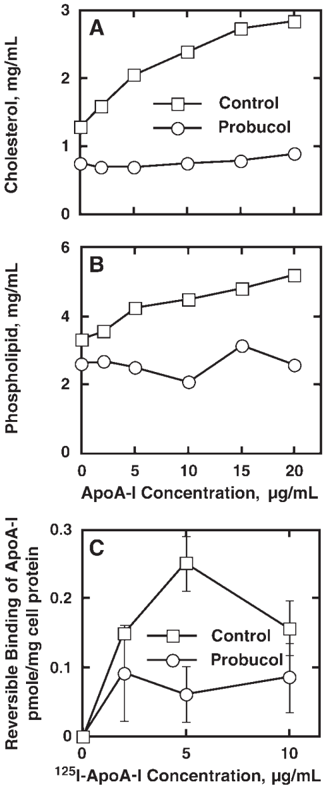
Fig. 5 Effect of probucol loading on apoA-I-mediated cellular lipid release from HepG2 cells and exchangeable binding apoA-I to HepG2 cells. A and B: Lipid release. HepG2 cells were incubated with either control LDL or probucol-containing LDL for 24 h. Cellular cholesterol and phospholipid release were measured after incubation for 16 h with various amounts of apoA-I. HDL-cholesterol (A) and HDL-phospholipid (B) were determined by an HPLC system. Open squares, control LDL-loaded cells; open circles, probucol-LDL loaded cells. C: ApoA-I binding. The indicated amounts of 125 I-apoA-I-incubated HepG2 cells were preloaded with control LDL or probucol-containing LDL for 2 h at 4 ° C. The cells were washed two times with ice-cold PBS, and the bound 125 I-apoA-I was displaced two times by 50 𝛍 g/ml nonlabeled apoA-I for 9 h. The difference in the total radioactivity after the first washing and after the second displacement was calculated as displaceable or exchangeable binding of apoA-I to the cells. Squares, binding to the cells loaded with control LDL; circles, binding to the cells loaded with probucol-containing LDL. Error bars indicate ± SEM.
Fig. 5 Effect of probucol loading on apoA-I-mediated cellular lipid release from HepG2 cells and exchangeable binding apoA-I to HepG2 cells. A and B: Lipid release. HepG2 cells were incubated with either control LDL or probucol-containing LDL for 24 h. Cellular cholesterol and phospholipid release were measured after incubation for 16 h with various amounts of apoA-I. HDL-cholesterol (A) and HDL-phospholipid (B) were determined by an HPLC system. Open squares, control LDL-loaded cells; open circles, probucol-LDL loaded cells. C: ApoA-I binding. The indicated amounts of 125 I-apoA-I-incubated HepG2 cells were preloaded with control LDL or probucol-containing LDL for 2 h at 4 ° C. The cells were washed two times with ice-cold PBS, and the bound 125 I-apoA-I was displaced two times by 50 𝛍 g/ml nonlabeled apoA-I for 9 h. The difference in the total radioactivity after the first washing and after the second displacement was calculated as displaceable or exchangeable binding of apoA-I to the cells. Squares, binding to the cells loaded with control LDL; circles, binding to the cells loaded with probucol-containing LDL. Error bars indicate ± SEM.CC-BY · From the PDF
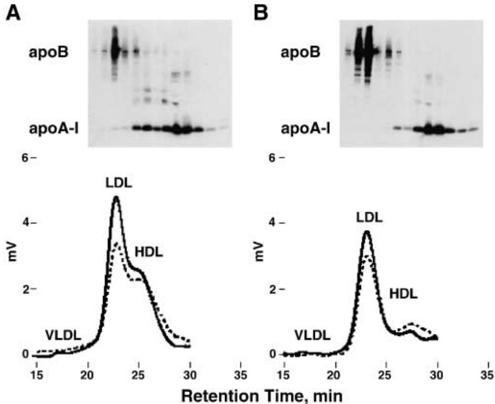
Fig. 6 Analysis of apolipoproteins in the HPLC fractions of the HepG2 conditioned medium. The conditioned medium of HepG2 cells (A) and probucol-loaded HepG2 cells (B) was tested after 16 h of incubation. The medium was analyzed by HPLC and fractionated as described in the text. The upper panels show immunoblot analysis of the fractions for apoB and apoA-I, and the lower panels represent HPLC elution profiles of lipids (solid lines, cholesterol; dotted lines, choline-phospholipid). Positions of lanes in the immunoblot analysis are adjusted for the HPLC elution times. VLDL, LDL, and HDL indicate the eluting positions for plasma lipoproteins.
Fig. 6 Analysis of apolipoproteins in the HPLC fractions of the HepG2 conditioned medium. The conditioned medium of HepG2 cells (A) and probucol-loaded HepG2 cells (B) was tested after 16 h of incubation. The medium was analyzed by HPLC and fractionated as described in the text. The upper panels show immunoblot analysis of the fractions for apoB and apoA-I, and the lower panels represent HPLC elution profiles of lipids (solid lines, cholesterol; dotted lines, choline-phospholipid). Positions of lanes in the immunoblot analysis are adjusted for the HPLC elution times. VLDL, LDL, and HDL indicate the eluting positions for plasma lipoproteins.CC-BY · From the PDF
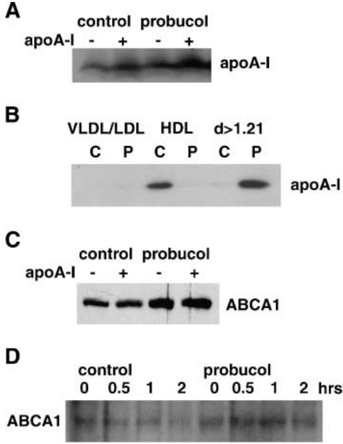
Fig. 7 Immunoblot analysis of apoA-I and ABCA1. A: ApoA-I in the conditioned medium of HepG2 cells was analyzed after preincubation with control LDL and probucol-containing LDL and subsequent incubation in the presence and absence of 10 𝛍 g/ml apoA-I for 16 h. B: Density distribution of apoA-I in the medium. ApoA-I was analyzed in density subfractions of the conditioned medium of HepG2 cells preincubated with 50 𝛍 g/ml control LDL (C) or probucol-containing LDL (P) for 24 h and then incubated for 16 h. The medium was fractionated by sequential ultracentrifugation for the VLDL/LDL fraction (d < 1.063 g/ml), the HDL fraction (1.063 < d < 1.21 g/ml), and the bottom fraction (d > 1.21 g/ml). Each fraction, corresponding to 10 𝛍 l of the original medium, was dialyzed and analyzed for apoA-I. C: ABCA1 in the plasma membrane of HepG2 cells prepared as described for A. D: Clearance of ABCA1 in HepG2 cells. The cells were preloaded with control or probucol-containing LDL, and ABCA1 was examined after incubation with 71 𝛍 M cycloheximide.
Fig. 7 Immunoblot analysis of apoA-I and ABCA1. A: ApoA-I in the conditioned medium of HepG2 cells was analyzed after preincubation with control LDL and probucol-containing LDL and subsequent incubation in the presence and absence of 10 𝛍 g/ml apoA-I for 16 h. B: Density distribution of apoA-I in the medium. ApoA-I was analyzed in density subfractions of the conditioned medium of HepG2 cells preincubated with 50 𝛍 g/ml control LDL (C) or probucol-containing LDL (P) for 24 h and then incubated for 16 h. The medium was fractionated by sequential ultracentrifugation for the VLDL/LDL fraction (d < 1.063 g/ml), the HDL fraction (1.063 < d < 1.21 g/ml), and the bottom fraction (d > 1.21 g/ml). Each fraction, corresponding to 10 𝛍 l of the original medium, was dialyzed and analyzed for apoA-I. C: ABCA1 in the plasma membrane of HepG2 cells prepared as described for A. D: Clearance of ABCA1 in HepG2 cells. The cells were preloaded with control or probucol-containing LDL, and ABCA1 was examined after incubation with 71 𝛍 M cycloheximide.CC-BY · From the PDF
Image 8
CC-BY · From the PDF
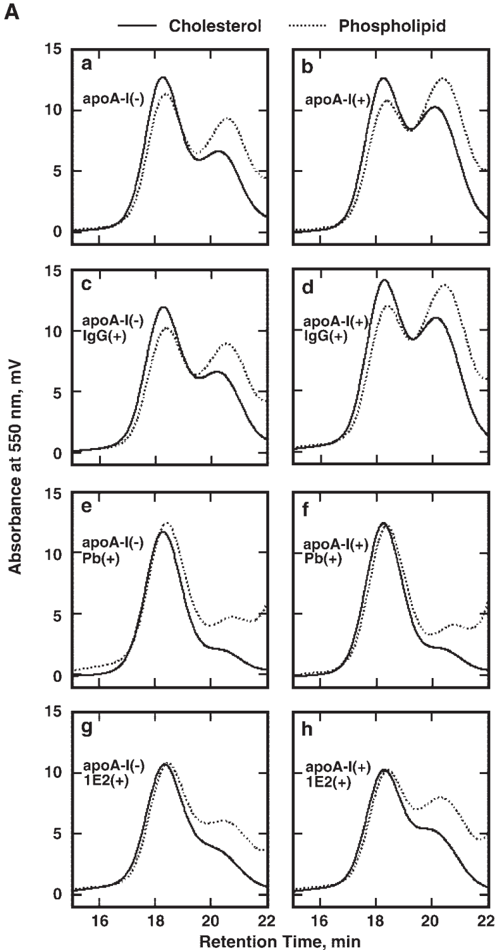
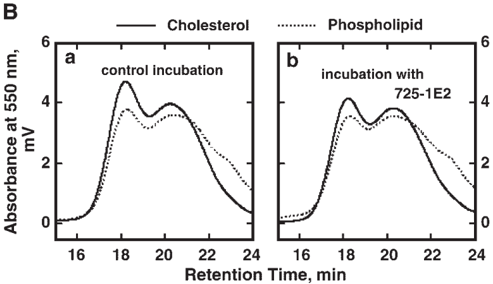
Fig. 8 Inhibition of HDL production by HepG2 cells by a monoclonal antibody against lipid-free apoA-I. A: HepG2 cells were incubated with 0.02% BSA-containing MEM𝛂 medium in the presence of 1 mg/ml monoclonal antibody 725-1E2 specific to lipid-free apoA-I and 10 𝛍 g/ml apoA-I for 16 h, and the medium was analyzed for its lipoprotein profile using HPLC with one gel-permeation column (Lipopropak XL; 7.8 mm × 300 mm; Tosoh). A-a: The medium of the cells by plain incubation. A-b: The medium of the cells incubated in the presence of apoA-I. A-c: The medium after incubation in the presence of control mouse IgG. A-d: The medium incubated in the presence of apoA-I and control IgG. A-e: The medium of the probucol (Pb)-preloaded cells. A-f: The medium of the cell preloaded with probucol after incubation in the presence of apoA-I. A-g: The medium of the cells incubated in the presence of the free apoA-I-specific antibody 725-1E2. A-h: The medium of the cells incubated with the antibody 725-1E2 in the presence of apoA-I. B: The conditioned medium of HepG2 cells was incubated for 16 h in the absence (B-a) and presence (B-b) of the antibody, and the lipoprotein profile was analyzed by HPLC. Solid lines, cholesterol; dotted lines, choline-phospholipid.
Fig. 8 Inhibition of HDL production by HepG2 cells by a monoclonal antibody against lipid-free apoA-I. A: HepG2 cells were incubated with 0.02% BSA-containing MEM𝛂 medium in the presence of 1 mg/ml monoclonal antibody 725-1E2 specific to lipid-free apoA-I and 10 𝛍 g/ml apoA-I for 16 h, and the medium was analyzed for its lipoprotein profile using HPLC with one gel-permeation column (Lipopropak XL; 7.8 mm × 300 mm; Tosoh). A-a: The medium of the cells by plain incubation. A-b: The medium of the cells incubated in the presence of apoA-I. A-c: The medium after incubation in the presence of control mouse IgG. A-d: The medium incubated in the presence of apoA-I and control IgG. A-e: The medium of the probucol (Pb)-preloaded cells. A-f: The medium of the cell preloaded with probucol after incubation in the presence of apoA-I. A-g: The medium of the cells incubated in the presence of the free apoA-I-specific antibody 725-1E2. A-h: The medium of the cells incubated with the antibody 725-1E2 in the presence of apoA-I. B: The conditioned medium of HepG2 cells was incubated for 16 h in the absence (B-a) and presence (B-b) of the antibody, and the lipoprotein profile was analyzed by HPLC. Solid lines, cholesterol; dotted lines, choline-phospholipid.CC-BY · From the PDF
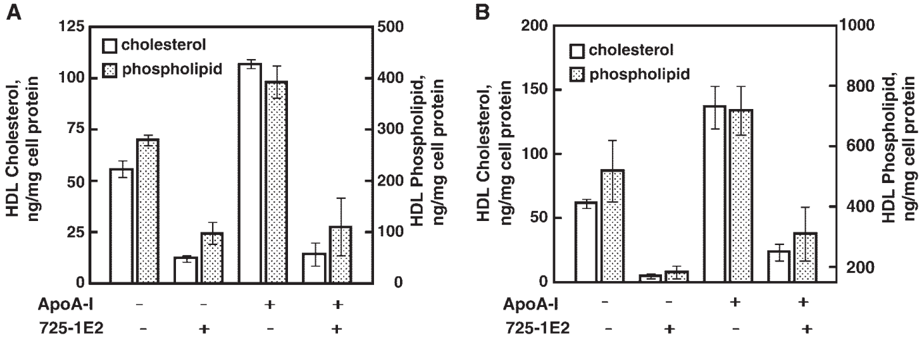
Fig. 9 Effect of free apoA-I-specific monoclonal antibody on HDL production by HepG2 cells. A: Cholesterol and phospholipid in HDL in the medium of HepG2 cells incubated in the presence of the antibody 725-1E2 and apoA-I, based on HPLC analysis. The data represent means ± SEM of triplicate assays. B: Cholesterol and phospholipid in HDL in the medium of HepG2 cells incubated in the presence of the antibody 725-1E2 and apoA-I, based on ultracentrifugal analysis. Data represent means ± SEM of triplicate assays.
Fig. 9 Effect of free apoA-I-specific monoclonal antibody on HDL production by HepG2 cells. A: Cholesterol and phospholipid in HDL in the medium of HepG2 cells incubated in the presence of the antibody 725-1E2 and apoA-I, based on HPLC analysis. The data represent means ± SEM of triplicate assays. B: Cholesterol and phospholipid in HDL in the medium of HepG2 cells incubated in the presence of the antibody 725-1E2 and apoA-I, based on ultracentrifugal analysis. Data represent means ± SEM of triplicate assays.CC-BY · From the PDF

Verification

Claims the paper makes

The claims and statistics of this paper haven’t been checked yet.

Run the check — free, no account needed. It reads the open-access text and checks the sources it cites.

A few free checks a day · papers already verified open instantly · results are public

Claims other papers make about this one

Each is checked against this paper’s own text: does it say what the citing paper says it does?

Self-check

Percentages, sums and reported differences re-computed from the paper’s own numbers.

The self-check needs the paper’s full text.

Citations

Cites

No references could be resolved yet.

Research works printed but not linked: 27

  1. Yokoyama, 2000, Release of cellular cholesterol: molecular mechanism for cholesterol homeostasis in cells and in the body, Biochim. Biophys. Acta., 1529, 231, 10.1016/S1388-1981(00)00152-9 · DOI
  2. Francis, 1995, Defective removal of cellular cholesterol and phospholipids by apolipoprotein A-I in Tangier disease, J. Clin. Invest., 96, 78, 10.1172/JCI118082 · DOI
  3. Brooks-Wilson, 1999, Mutations in ABC1 in Tangier disease and familial high-density lipoprotein deficiency, Nat. Genet., 22, 336, 10.1038/11905 · DOI · Paper page
  4. Bodzioch, 1999, The gene encoding ATP-binding cassette transporter 1 is mutated in Tangier disease, Nat. Genet., 22, 347, 10.1038/11914 · DOI · Paper page
  5. Rust, 1999, Tangier disease is caused by mutations in the gene encoding ATP-binding cassette transporter 1, Nat. Genet., 22, 352, 10.1038/11921 · DOI · Paper page
  6. Wellington, 2003, Alterations of plasma lipids in mice via adenoviral-mediated hepatic overexpression of human ABCA1, J. Lipid Res., 44, 1470, 10.1194/jlr.M300110-JLR200 · DOI
  7. Francone, 2003, Abnormal phospholipid composition impairs HDL biogenesis and maturation in mice lacking Abca1, Biochemistry., 42, 8569, 10.1021/bi034540v · DOI
  8. Kiss, 2003, The lipidation by hepatocytes of human apolipoprotein A-I occurs by both ABCA1-dependent and -independent pathways, J. Biol. Chem., 278, 10119, 10.1074/jbc.M300137200 · DOI
  9. Tsujita, 1996, Selective inhibition of free apolipoprotein-mediated cellular lipid efflux by probucol, Biochemistry., 35, 13011, 10.1021/bi960734h · DOI
  10. Tsujita, 2000, Apolipoprotein-mediated cellular cholesterol/phospholipid efflux and plasma high density lipoprotein level in mice, Biochim. Biophys. Acta., 1485, 199, 10.1016/S1388-1981(00)00061-5 · DOI
  11. Wu, 2004, Probucol inactivates ABCA1 in plasma membrane for its function to mediate apolipoprotein binding and HDL assembly and for its proteolytic degradation, J. Biol. Chem., 279, 30168, 10.1074/jbc.M403765200 · DOI
  12. Tomimoto, 2001, Effect of probucol in lecithin-cholesterol acyltransferase-deficient mice: inhibition of 2 independent cellular cholesterol-releasing pathways in vivo, Arterioscler. Thromb. Vasc. Biol., 21, 394, 10.1161/01.ATV.21.3.394 · DOI
  13. Yokoyama, 1982, The process of dissolving apolipoprotein A-I in an aqueous buffer, J. Biochem. (Tokyo)., 91, 1267, 10.1093/oxfordjournals.jbchem.a133811 · DOI
  14. Yokoyama, 1984, Association of apolipoprotein A-II with egg phosphatidylcholine unilamellar vesicles, J. Biochem. (Tokyo)., 96, 871, 10.1093/oxfordjournals.jbchem.a134905 · DOI
  15. Okuhira, 2004, Potential involvement of dissociated apoA-I in the ABCA1-dependent cellular lipid release by HDL, J. Lipid Res., 45, 645, 10.1194/jlr.M300257-JLR200 · DOI
  16. Noga, 2003, Plasma homocysteine is regulated by phospholipid methylation, J. Biol. Chem., 278, 5952, 10.1074/jbc.M212194200 · DOI
  17. Wu, 2002, Cholesteryl ester transfer protein expressed in lecithin cholesterol acyltransferase-deficient mice, Arterioscler. Thromb. Vasc. Biol., 22, 1347, 10.1161/01.ATV.0000026297.50542.62 · DOI
  18. Usui, 2002, A new on-line dual enzymatic method for simultaneous quantification of cholesterol and triglycerides in lipoproteins by HPLC, J. Lipid Res., 43, 805, 10.1016/S0022-2275(20)30123-1 · DOI
  19. Abe-Dohmae, 2000, Characterization of apolipoprotein-mediated HDL generation induced by cAMP in a murine macrophage cell line, Biochemistry., 39, 11092, 10.1021/bi0008175 · DOI
  20. Arakawa, 2002, Helical apolipoproteins stabilize ATP-binding cassette transporter A1 by protecting it from thiol protease-mediated degradation, J. Biol. Chem., 277, 22426, 10.1074/jbc.M202996200 · DOI
  21. Satonin, 1986, Comparison of gas chromatography and high-performance liquid chromatography for the analysis of probucol in plasma, J. Chromatogr., 380, 401, 10.1016/S0378-4347(00)83670-1 · DOI
  22. Thrift, 1986, Characterization of lipoproteins produced by the human liver cell line, Hep G2, under defined conditions, J. Lipid Res., 27, 236, 10.1016/S0022-2275(20)38829-5 · DOI
  23. McCall, 1988, Heterogeneity of nascent high density lipoproteins secreted by the hepatoma-derived cell line, Hep G2, J. Lipid Res., 29, 1127, 10.1016/S0022-2275(20)38448-0 · DOI
  24. Forte, 1989, Isolation and characterization of lipoproteins produced by human hepatoma-derived cell lines other than HepG2, J. Lipid Res., 30, 817, 10.1016/S0022-2275(20)38309-7 · DOI
  25. Sahoo, 2004, ABCA1-dependent lipid efflux to apolipoprotein A-I mediates HDL particle formation and decreases VLDL secretion from primary rat and mouse hepatocytes, J. Lipid Res., 45, 1122, 10.1194/jlr.M300529-JLR200 · DOI
  26. Chisholm, 2002, ApoA-I secretion from HepG2 cells: evidence for the secretion of both lipid-poor apoA-I and intracellularly assembled nascent HDL, J. Lipid Res., 43, 36, 10.1016/S0022-2275(20)30184-X · DOI
  27. Edelstein, 1983, In vitro conversion of proapoprotein A-I to apoprotein A-I. Partial characterization of an extracellular enzyme activity, J. Biol. Chem., 258, 11430, 10.1016/S0021-9258(17)44242-6 · DOI

Cited by

Sorted by citations

See all 67

Metadata

Authors
Tsujita, M., Wu, C.-A., Abe-Dohmae, S., Usui, S., Okazaki, M., & Yokoyama, S.
Venue
Journal of Lipid Research
Publisher
Elsevier BV
Published
2005-01
Volume
46
Issue
1
Pages
154-162
ISSN
0022-2275
Cited by
67
References
0
Language
en

About these checks

Registry, retraction, Cites and statistics results are computed, not judged, with one exception: a printed reference that no index lists is read once by a model before it counts as a citation error. Claims are extracted by a model and kept only when their quote appears verbatim in the text; each cited source is then checked, with a model’s help, for whether it says what the claim relies on. Those verdicts can be wrong — read the claim’s quote and the cited source before relying on one.

Statistics and arithmetic are recomputed, not judged.

Confidence bands are shown only for fields calibrated on our annotated test set. None is calibrated yet, so no band is shown.

What counts as a claim ›How we measure confidence ›How we check this ›

Are you an author, or do you see a problem with this page? Request a review

How to cite

Cite CoChat for the checks on this page, and the paper for its own findings.

This page
CoChat. (2026). Citation check: On the hepatic mechanism of HDL assembly by the ABCA1/apoA-I pathway. https://app.cochat.ai/papers/10.1194/jlr.m400402-jlr200
The paper
Tsujita, M., Wu, C.-A., Abe-Dohmae, S., Usui, S., Okazaki, M., & Yokoyama, S. (2005). On the hepatic mechanism of HDL assembly by the ABCA1/apoA-I pathway. Journal of Lipid Research. https://doi.org/10.1194/jlr.m400402-jlr200