

The DOI matches its Crossref record, with a small difference in title or year; 1 of the 1 references it cites were found in a registry or an index.
A 37-Year-Old Man With Intellectual Disability Discovered to Have Aspartylglucosaminuria: Implications for the Diagnosis of Genetic Causes
Open accessAbstract
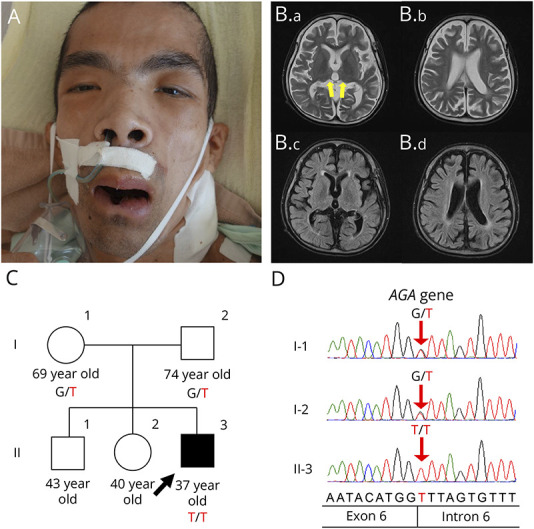
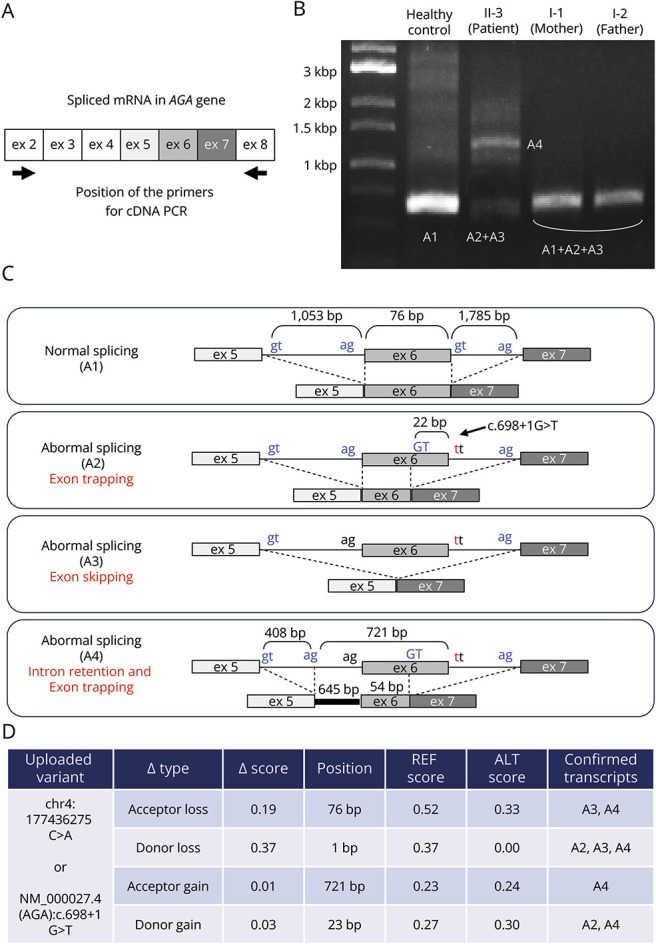
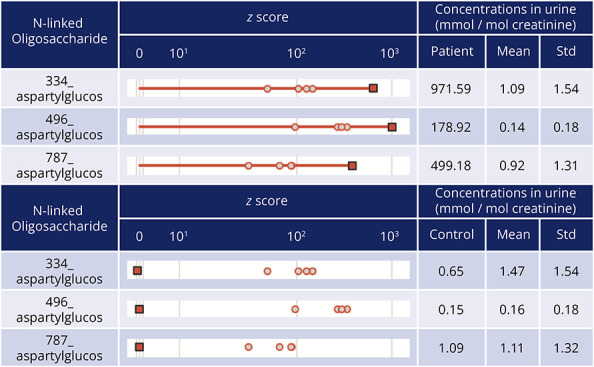
Objectives: The causes of intellectual disability (ID) are varied, with as many as 1,400 causative genes. We attempted to identify the causative gene in a patient with long-standing undiagnosed ID. Methods: Although this was an isolated case with no family history, we searched for the causative gene using trio-based whole-exome sequencing (trio-WES), because severe ID is often caused by genetic variations, and inherited metabolic disorders (IMDs) are assumed to be the cause when regression and epilepsy occur. Results: gene (aspartylglucosaminidase; NM_000027.4) Chr4(GRCh38):g. 177436275C>A, c.698+1G>T. This gene is implicated in aspartylglucosaminuria (AGU; OMIM #208400) and originated from both of the patient's parents. We confirmed the pathogenicity of the variant by detecting the splicing defect in cDNA from the patient's blood and accumulation of aberrant metabolites in the patient's urine. Discussion: We discuss how to more readily achieve an accurate diagnosis for patients with undiagnosed intellectual disabilities. Medical practitioners' awareness of the characteristics of the disease leading to clinical suspicion in patients with matching presentations, and the performance of newborn screening when possible, is important for the diagnosis of ID. In addition, the characteristic symptoms and course of the disease give rise to suspicion of IMDs. Given our results, we consider trio-WES to be a powerful method for identifying the causative genes in cases of ID with genetic causes.
Overview
The claims and statistics of this paper haven’t been checked yet.
Run the check — free, no account needed. It reads the open-access text and checks the sources it cites.
Integrity signals
Registry
Cites
Statistics
Figures
Verification
Claims the paper makes
The claims and statistics of this paper haven’t been checked yet.
Run the check — free, no account needed. It reads the open-access text and checks the sources it cites.
Claims other papers make about this one
Each is checked against this paper’s own text: does it say what the citing paper says it does?
The check wasn’t confident either way, so it gives no verdict — never disputed.
In the citing paper
“The associated childhood disorders highlight the variety of processes in which the lysosome is involved, from myelination (TMEM106B, hypomyelinating leukodystrophy) to cell growth (TSC1, tuberous sclerosis) and bone resorption (SQSTM1).89–91”
From The lysosome and proteostatic stress at the intersection of pediatric neurological disorders and adult neurodegenerative diseases (2025) · cites this paper as [91]
Experimental — accuracy not yet measured
Self-check
Percentages, sums and reported differences re-computed from the paper’s own numbers.
The self-check needs the paper’s full text.
Citations
Cites
A genomic mutational constraint map using variation in 76,156 human genomes
Chen, S., Francioli, L. C., Goodrich, J. K., Collins, R. L., Kanai, M., Wang, Q., Alföldi, J., Watts, N. A., Vittal, C., Gauthier, L. D., et al. (2024) · Nature · doi:10.1038/s41586-023-06045-0 · Cited by 1,727
Research works printed but not linked: 14
- 10.1177/0883073820980904 · DOI
- 10.1093/nar/gkad989 · DOI · Paper page
- 10.1002/jimd.12597 · DOI
- 10.1096/fasebj.7.13.8405810 · DOI
- 10.1080/02841850802065000 · DOI
- 10.1038/srep37583 · DOI
- 10.1016/j.ymthe.2020.11.012 · DOI
- 10.1016/j.omtn.2023.07.011 · DOI
- Kliegman RM, Geme JWS. Nelson Textbook of Pediatrics, 21st Edition; Elsevier, 2019.
- 10.3389/fped.2021.526779 · DOI
- 10.1016/j.ymgme.2011.11.191 · DOI
- 10.3390/ijms18071384 · DOI
- 10.12688/f1000research.16315.1 · DOI
- 10.1038/nature21062 · DOI · Paper page
Cited by
Sorted by citations
Lane-Donovan, C., Paredes, M., & Kao, A. W. (2025) · Progress in Neurobiology · doi:10.1016/j.pneurobio.2025.102854 · Cited by 3
Metadata
- Authors
- Kouhashi, M., Yukawa, K., Yano, N., Hagemeijer, M. C., Hirata, S., Kambe, D., Yokoyama, A., Yoshida, A., Kora, K., de Ronde, C. J., Vrieswijk, S., van der Meijden, E., Yoshida, T., & Yamashita, H.
- Affiliations
- Kyoto University (JP)
- Corresponding author
- Yamashita, Hirofumi
- ORCID
- Venue
- Neurology Genetics
- Published
- 2024-06
- Volume
- 10
- Issue
- 3
- Pages
- e200161-e200161
- ISSN
- 2376-7839 (ISSN-L)
- PMC
- PMC11145746
- OpenAlex
- W4399117454
- Cited by
- 3
- References
- 1
- Citations by year
- 2026: 2 · 2025: 1
- FWCI
- 0.85
- Type
- journal article
- Language
- en
- Open access
- gold
- doi.org
- Licence
- cc-by-nc-nd
- Locations
- Neurology Genetics (publishedVersion, cc-by-nc-nd)
- PubMed Central (publishedVersion, cc-by-nc-nd)
- PubMed (publishedVersion)
- Funders
- Erasmus Universitair Medisch Centrum Rotterdam
- Topics
- Health Sciences › Medicine › Genetics (clinical) › Lysosomal Storage Disorders Research
- Life Sciences › Biochemistry, Genetics and Molecular Biology › Clinical Biochemistry › Metabolism and Genetic Disorders
- Life Sciences › Biochemistry, Genetics and Molecular Biology › Genetics › Genomics and Rare Diseases
- Keywords
- aspartylglucosaminuria, intellectual disability, aspartylglucosaminidase, aberrant splicing, inborn errors of metabolism, causal gene identification, newborn screening
About these checks
Registry, retraction, Cites and statistics results are computed, not judged, with one exception: a printed reference that no index lists is read once by a model before it counts as a citation error. Claims are extracted by a model and kept only when their quote appears verbatim in the text; each cited source is then checked, with a model’s help, for whether it says what the claim relies on. Those verdicts can be wrong — read the claim’s quote and the cited source before relying on one.
Statistics and arithmetic are recomputed, not judged.
Confidence bands are shown only for fields calibrated on our annotated test set. None is calibrated yet, so no band is shown.
What counts as a claim ›How we measure confidence ›How we check this ›
Are you an author, or do you see a problem with this page? Request a review
