Student or educator? Sign up with your school email and get 6 months of Pro free.
Cited by 0RNA and protein synthesis mechanismsRNA modifications and cancerRNA regulation and disease

The DOI matches its Crossref record; 58 of the 58 references it cites were found in a registry or an index.

Two dynamic N-terminal regions are required for function in ribosomal RNA adenine dimethylase family members

Open access

Published version of a preprint

Abstract

Prominent members of the ribosomal RNA adenine dimethylase (RRAD) family of enzymes facilitate ribosome maturation by dimethylating 2 nt of small subunit rRNA, including the human DIMT1 and bacterial KsgA enzymes. A subgroup of RRAD enzymes, named erythromycin resistance methyltransferases (Erm), dimethylate a specific nucleotide in large subunit rRNA to confer antibiotic resistance. How these enzymes regulate methylation so that it only occurs on the specific substrate is not fully understood. While performing random mutagenesis on the catalytic domain of ErmE, we discovered that mutants in an N-terminal region of the protein that is disordered in the ErmE crystal structure are associated with a loss of antibiotic resistance. By subjecting site-directed mutants of ErmE and KsgA to phenotypic and in vitro assays, we found that the N-terminal region is critical for activity in RRAD enzymes: The N-terminal basic region promotes rRNA binding, and the conserved motif likely assists in juxtaposing the adenosine substrate and the S -adenosylmethionine cofactor. Our results and emerging structural data suggest that this dynamic, N-terminal region of RRAD enzymes becomes ordered upon rRNA binding, forming a cap on the active site required for methylation.

Overview

The claims and statistics of this paper haven’t been checked yet.

Run the check — free, no account needed. It reads the open-access text and checks the sources it cites.

A few free checks a day · papers already verified open instantly · results are public

Integrity signals

Registry

Crossref · 10.1261/rna.080068.124

Cites

58 of 58 references verified0 citation errors · 0 not checkable

Statistics

Figures

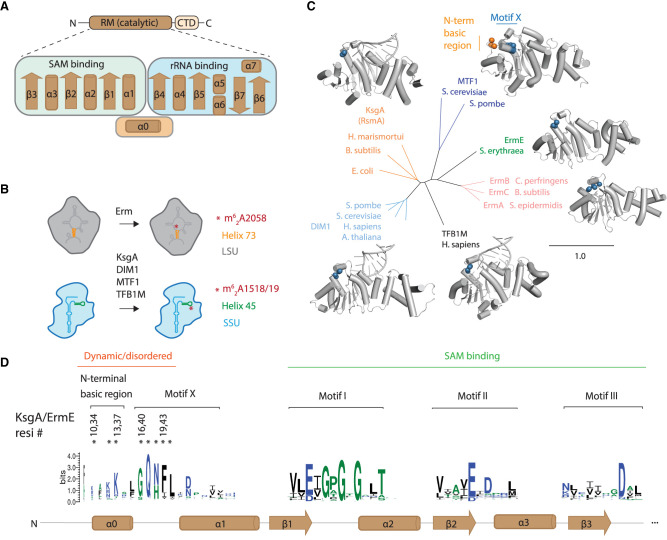
FIGURE 1. The structure and activity of RRAD family members. (A) RRAD enzymes consist of a Rossmann-like methyltransferase (RM) catalytic domain and a C-terminal domain. The secondary structure of the RM domain is shown indicating that α1–β3 are predominantly involved in SAM while β4–β7 are involved in rRNA binding. (B) RRAD family members dimethylate rRNA of either the large ribosomal subunit (LSU) or small ribosomal subunit (SSU). (C) Experimentally determined structures are available for each RRAD family member in some cases bound to rRNA (MTF1, PDB code 1i4w; ErmE, 6nvm; ErmC, 1qao; TFB1M, 6aax; DIM1, 7wtm; KsgA, 7o5h). An N-terminal basic region (orange) is disordered in these structures (except for MTF1), while the adjacent motif X (blue) is partially ordered. (D) The conservation of RRAD family members at key motifs throughout the α0–β3 region of the protein family is shown as a sequence logo. Residues in the N-terminal basic region and motif X investigated by site-directed mutagenesis in this study are marked with an asterisk (*).
FIGURE 1. The structure and activity of RRAD family members. (A) RRAD enzymes consist of a Rossmann-like methyltransferase (RM) catalytic domain and a C-terminal domain. The secondary structure of the RM domain is shown indicating that α1–β3 are predominantly involved in SAM while β4–β7 are involved in rRNA binding. (B) RRAD family members dimethylate rRNA of either the large ribosomal subunit (LSU) or small ribosomal subunit (SSU). (C) Experimentally determined structures are available for each RRAD family member in some cases bound to rRNA (MTF1, PDB code 1i4w; ErmE, 6nvm; ErmC, 1qao; TFB1M, 6aax; DIM1, 7wtm; KsgA, 7o5h). An N-terminal basic region (orange) is disordered in these structures (except for MTF1), while the adjacent motif X (blue) is partially ordered. (D) The conservation of RRAD family members at key motifs throughout the α0–β3 region of the protein family is shown as a sequence logo. Residues in the N-terminal basic region and motif X investigated by site-directed mutagenesis in this study are marked with an asterisk (*).CC BY-NC · PubMed Central
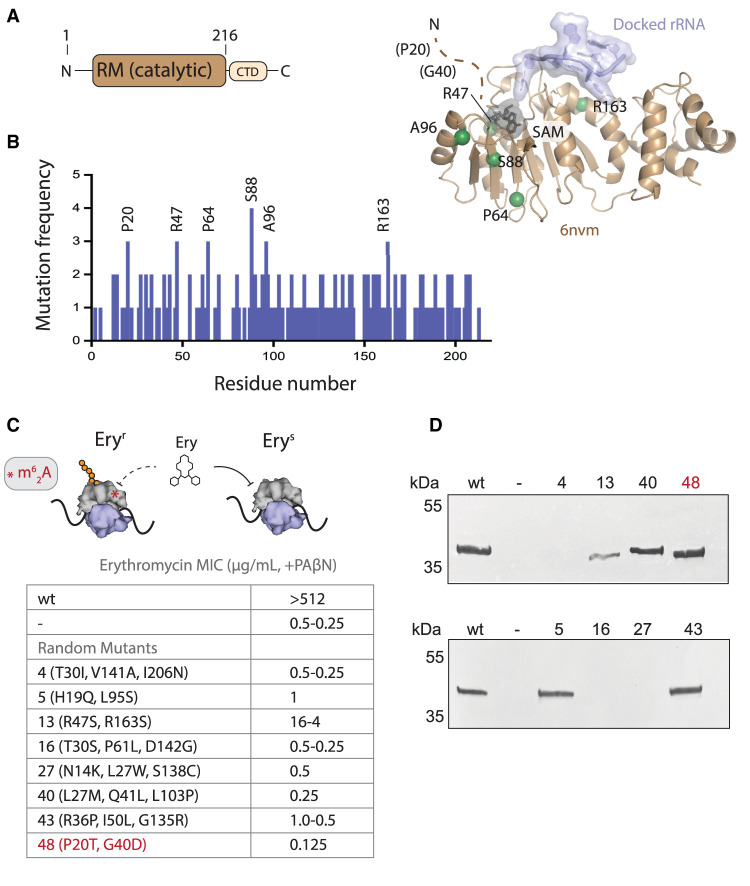
FIGURE 2. Random mutagenesis reveals that mutations in the dynamic, N-terminal region of ErmE are associated with an erythromycin-sensitive phenotype. (A) The crystal structure of the RRAD family member ErmE lacks the dynamic, N-terminal region. Docking of SAM onto the crystal structure and rRNA via Rosetta modeling gives the approximate positions of the substrates. The residues most frequently associated with an erythromycin-sensitive phenotype in random mutagenesis screens are shown as spheres. Residues P20 and G40 were not present in the coordinate model. (B) Random mutagenesis of the catalytic, Rossmann-like methyltransferase (RM) domain of ermE was performed. A histogram shows how often specific ermE residues were mutated among clones that were erythromycin sensitive. (C) Minimal inhibitory concentrations (MIC) for erythromycin were measured in E. coli cells expressing ermE mutants in the presence of the antibiotic adjuvant phenyl-arginyl-β-napthylamide (PAβΝ). Random mutagenesis produced variants with two to four mutations per clone. MIC values were measured from three replicates. The range of MIC values observed is reported. Where one value is listed, all replicates possessed this value. (D) Western blotting of cell lysates was used to detect whether ermE mutants produced a soluble and stable protein. Mutant 48 is highlighted in red to denote it is the sole mutant composed of only N-terminal changes.
FIGURE 2. Random mutagenesis reveals that mutations in the dynamic, N-terminal region of ErmE are associated with an erythromycin-sensitive phenotype. (A) The crystal structure of the RRAD family member ErmE lacks the dynamic, N-terminal region. Docking of SAM onto the crystal structure and rRNA via Rosetta modeling gives the approximate positions of the substrates. The residues most frequently associated with an erythromycin-sensitive phenotype in random mutagenesis screens are shown as spheres. Residues P20 and G40 were not present in the coordinate model. (B) Random mutagenesis of the catalytic, Rossmann-like methyltransferase (RM) domain of ermE was performed. A histogram shows how often specific ermE residues were mutated among clones that were erythromycin sensitive. (C) Minimal inhibitory concentrations (MIC) for erythromycin were measured in E. coli cells expressing ermE mutants in the presence of the antibiotic adjuvant phenyl-arginyl-β-napthylamide (PAβΝ). Random mutagenesis produced variants with two to four mutations per clone. MIC values were measured from three replicates. The range of MIC values observed is reported. Where one value is listed, all replicates possessed this value. (D) Western blotting of cell lysates was used to detect whether ermE mutants produced a soluble and stable protein. Mutant 48 is highlighted in red to denote it is the sole mutant composed of only N-terminal changes.CC BY-NC · PubMed Central
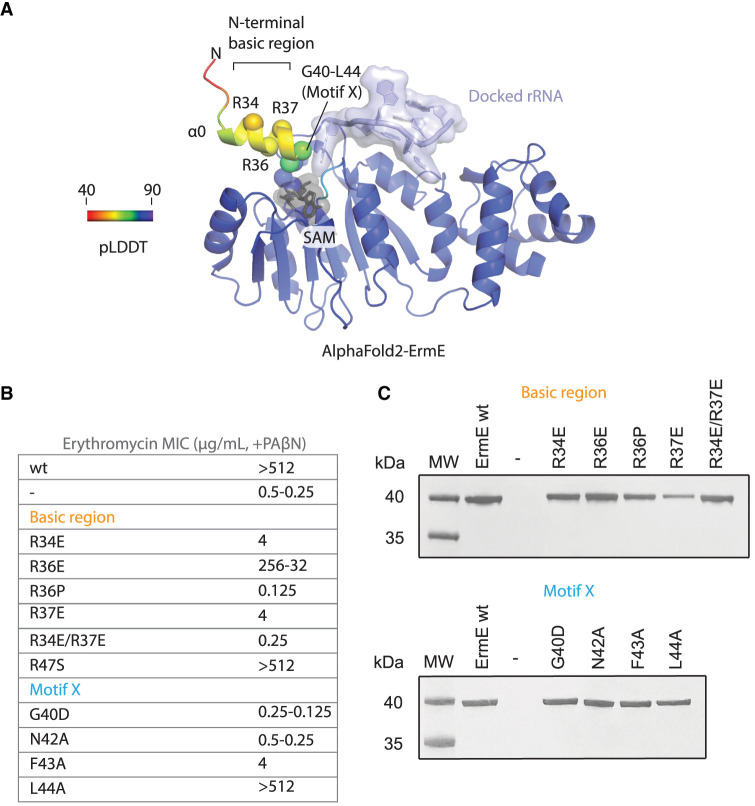
FIGURE 3. Site-directed mutants in the N-terminal basic region and motif X are associated with altered phenotypes in ErmE. (A) An AlphaFold2 model of ErmE suggests that some of the dynamic N-terminal residues form α-helix 0. Superposition of the AlphaFold2 ErmE model onto the model given in Figure 2A indicates α0 forms one wall of the active site. (B) MIC values for erythromycin were measured for E. coli cells expressing ermE site-directed mutants in the basic region and motif X. MIC values were measured from three replicates. The range of MIC values observed is reported. Where one value is listed, all replicates possessed this value. (C) Western blotting of cell lysates was used to detect whether ermE site-directed mutants produced a soluble and stable protein.
FIGURE 3. Site-directed mutants in the N-terminal basic region and motif X are associated with altered phenotypes in ErmE. (A) An AlphaFold2 model of ErmE suggests that some of the dynamic N-terminal residues form α-helix 0. Superposition of the AlphaFold2 ErmE model onto the model given in Figure 2A indicates α0 forms one wall of the active site. (B) MIC values for erythromycin were measured for E. coli cells expressing ermE site-directed mutants in the basic region and motif X. MIC values were measured from three replicates. The range of MIC values observed is reported. Where one value is listed, all replicates possessed this value. (C) Western blotting of cell lysates was used to detect whether ermE site-directed mutants produced a soluble and stable protein.CC BY-NC · PubMed Central
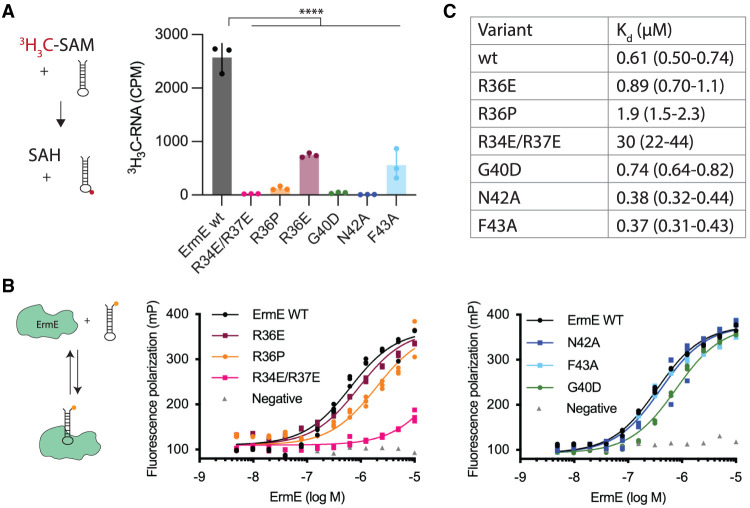
FIGURE 4. The N-terminal basic patch and motif X contribute to rRNA methylation, and the basic patch contributes to rRNA binding. (A) Methylation reactions under single-turnover conditions were conducted using site-directed mutants in the N-terminal basic region or motif X of ErmE. (B) Affinity binding of ErmE site-directed mutants to an analog of helix 73 of 23S rRNA was measured by fluorescence polarization. Three independent binding reactions were performed for each variant, and replicate measurements are shown as a scatter plot. A cartoon depicting the assays is given. The fluorescein label on the 48 nt rRNA analog is indicated by an orange circle. (C) Dissociation constant (Kd) values of ErmE variants for RNA. Parentheses indicate 95% confidence interval. (****) P ≤ 0.001.
FIGURE 4. The N-terminal basic patch and motif X contribute to rRNA methylation, and the basic patch contributes to rRNA binding. (A) Methylation reactions under single-turnover conditions were conducted using site-directed mutants in the N-terminal basic region or motif X of ErmE. (B) Affinity binding of ErmE site-directed mutants to an analog of helix 73 of 23S rRNA was measured by fluorescence polarization. Three independent binding reactions were performed for each variant, and replicate measurements are shown as a scatter plot. A cartoon depicting the assays is given. The fluorescein label on the 48 nt rRNA analog is indicated by an orange circle. (C) Dissociation constant (Kd) values of ErmE variants for RNA. Parentheses indicate 95% confidence interval. (****) P ≤ 0.001.CC BY-NC · PubMed Central
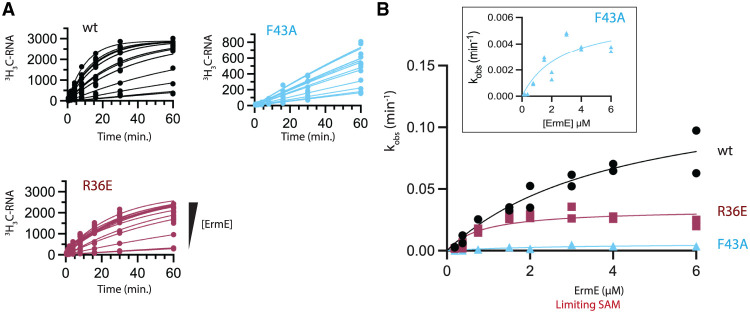
FIGURE 5. Single turnover kinetics. (A) Methylated RNA versus time plots for increasing concentration of wild-type (wt) ErmE and site-directed mutants. (B) Methylation rates (kobs) are plotted versus ErmE concentration under limiting SAM and excess RNA conditions and fit to a model for single-turnover kinetics to extract kchem and K1/2,SAM values. An inset is shown of the F43 data with a y-axis range of 0–0.006 min−1.
FIGURE 5. Single turnover kinetics. (A) Methylated RNA versus time plots for increasing concentration of wild-type (wt) ErmE and site-directed mutants. (B) Methylation rates (kobs) are plotted versus ErmE concentration under limiting SAM and excess RNA conditions and fit to a model for single-turnover kinetics to extract kchem and K1/2,SAM values. An inset is shown of the F43 data with a y-axis range of 0–0.006 min−1.CC BY-NC · PubMed Central
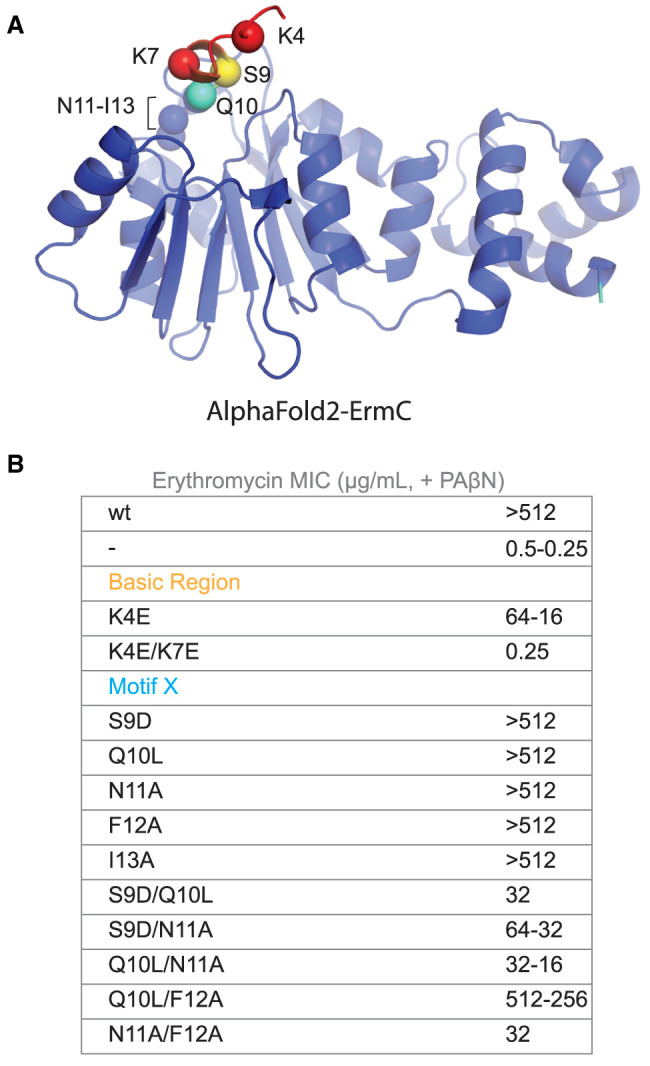
FIGURE 6. Site-directed mutants in the N-terminal basic region and motif X are associated with altered phenotypes in ErmC. (A) An AlphaFold2 model of ErmC demonstrating the predicted location of basic region residues K4 and K7 and motif X residues S9-I13. (B) MIC values for erythromycin were measured for E. coli cells expressing ermC site-directed mutants in the basic region and motif X. MIC values were measured from three replicates. The range of MIC values observed is reported. Where one value is listed, all replicates possessed this value.
FIGURE 6. Site-directed mutants in the N-terminal basic region and motif X are associated with altered phenotypes in ErmC. (A) An AlphaFold2 model of ErmC demonstrating the predicted location of basic region residues K4 and K7 and motif X residues S9-I13. (B) MIC values for erythromycin were measured for E. coli cells expressing ermC site-directed mutants in the basic region and motif X. MIC values were measured from three replicates. The range of MIC values observed is reported. Where one value is listed, all replicates possessed this value.CC BY-NC · PubMed Central
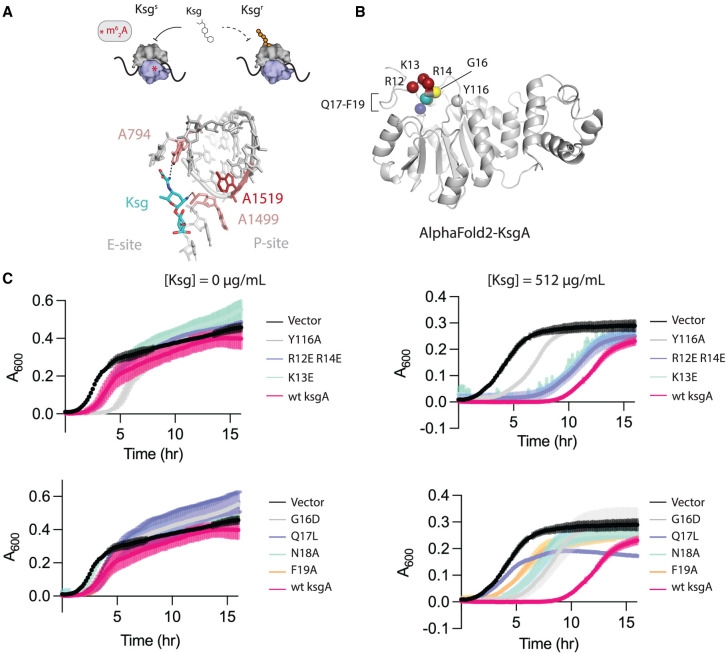
FIGURE 7. The N-terminal basic patch and motif X of RRAD family member, KsgA, contribute to function in vivo. (A) Kasugamycin (Ksg) inhibits protein synthesis by binding to ribosomes that possess the m62A1519 modification on 16S rRNA. Methylation is indicated by the red asterisk. The structure of Ksg bound to the E. coli ribosome is shown (PDB code 1vs5). A loss of methylation on 16S rRNA residue A1519 affects the local conformation leading to partial Ksg resistance. (B) An AlphaFold2 model of E. coli KsgA shows the predicted location of the basic region R12-R14 and motif X residues G16-F19. (C) Growth curves of E. coli ΔksgA in the absence or presence of kasugamycin. The cells are transformed with wild-type wt ksgA, a site-directed mutant of ksgA or empty vector (Vector). Y116A is included as a control because it is defective in methylation. Three independent cultures were monitored for each variant, and the mean and standard deviation of each time point is plotted.
FIGURE 7. The N-terminal basic patch and motif X of RRAD family member, KsgA, contribute to function in vivo. (A) Kasugamycin (Ksg) inhibits protein synthesis by binding to ribosomes that possess the m62A1519 modification on 16S rRNA. Methylation is indicated by the red asterisk. The structure of Ksg bound to the E. coli ribosome is shown (PDB code 1vs5). A loss of methylation on 16S rRNA residue A1519 affects the local conformation leading to partial Ksg resistance. (B) An AlphaFold2 model of E. coli KsgA shows the predicted location of the basic region R12-R14 and motif X residues G16-F19. (C) Growth curves of E. coli ΔksgA in the absence or presence of kasugamycin. The cells are transformed with wild-type wt ksgA, a site-directed mutant of ksgA or empty vector (Vector). Y116A is included as a control because it is defective in methylation. Three independent cultures were monitored for each variant, and the mean and standard deviation of each time point is plotted.CC BY-NC · PubMed Central
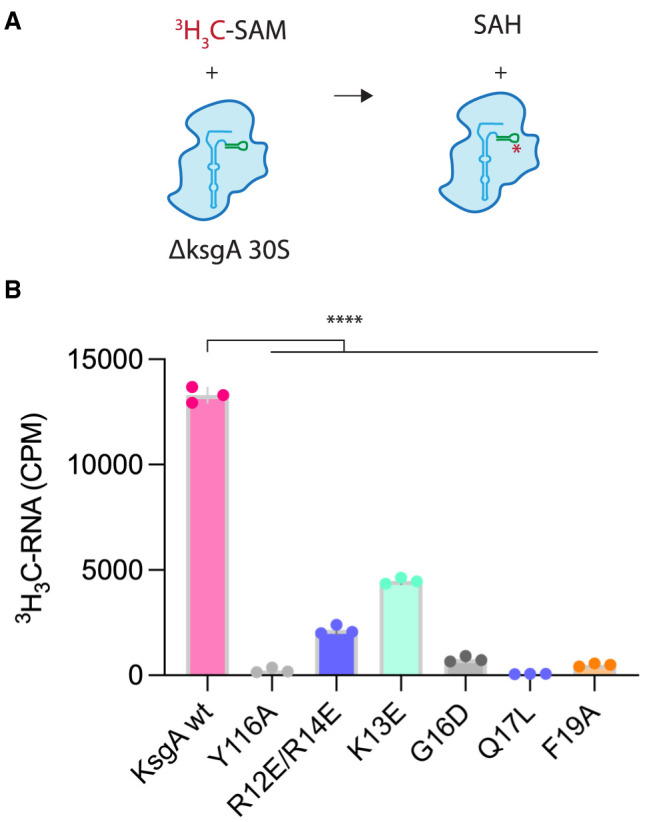
FIGURE 8. The N-terminal basic region and motif X of KsgA contribute to 16S rRNA methylation in vitro. (A) KsgA catalyzed methylation of 16S rRNA in vitro was measured using 30S ribosomes devoid of m62A1518 and m62A1519 (ΔksgA strain) and a radiolabeled SAM cofactor. (B) Wt KsgA robustly methylates 30S ribosomes in vitro. The Y116A active site mutant is methylation deficient and serves as a negative control. (****) P ≤ 0.001.
FIGURE 8. The N-terminal basic region and motif X of KsgA contribute to 16S rRNA methylation in vitro. (A) KsgA catalyzed methylation of 16S rRNA in vitro was measured using 30S ribosomes devoid of m62A1518 and m62A1519 (ΔksgA strain) and a radiolabeled SAM cofactor. (B) Wt KsgA robustly methylates 30S ribosomes in vitro. The Y116A active site mutant is methylation deficient and serves as a negative control. (****) P ≤ 0.001.CC BY-NC · PubMed Central
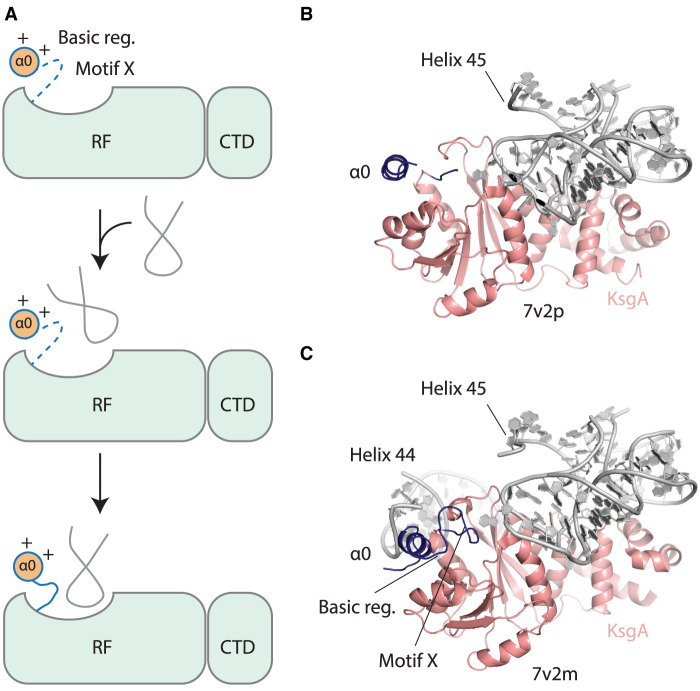
FIGURE 9. A model for the contribution of the basic region and motif X to rRNA methylation. (A) In the absence of rRNA, motif X is disordered. The electrostatic interaction of the basic region (Basic reg.) with rRNA promotes an initial encounter complex that then matures into a structure with an ordered motif X contributing to the active site of the RRAD methyltransferase. (B) In the KsgA-30S ribosome structure reported in PDB code 7v2p, helix 44 of 16S rRNA is disordered, as is the basic region and motif X of KsgA, but in C the structure reported in 7v2m helix 44 is ordered along with the basic region and motif X. The basic region is positioned to make electrostatic contacts to helix 44 of 16S rRNA.
FIGURE 9. A model for the contribution of the basic region and motif X to rRNA methylation. (A) In the absence of rRNA, motif X is disordered. The electrostatic interaction of the basic region (Basic reg.) with rRNA promotes an initial encounter complex that then matures into a structure with an ordered motif X contributing to the active site of the RRAD methyltransferase. (B) In the KsgA-30S ribosome structure reported in PDB code 7v2p, helix 44 of 16S rRNA is disordered, as is the basic region and motif X of KsgA, but in C the structure reported in 7v2m helix 44 is ordered along with the basic region and motif X. The basic region is positioned to make electrostatic contacts to helix 44 of 16S rRNA.CC BY-NC · PubMed Central
Danielle McGaha
Danielle McGaha CC BY-NC · PubMed Central

Verification

Claims the paper makes

The claims and statistics of this paper haven’t been checked yet.

Run the check — free, no account needed. It reads the open-access text and checks the sources it cites.

A few free checks a day · papers already verified open instantly · results are public

Self-check

Percentages, sums and reported differences re-computed from the paper’s own numbers.

The self-check needs the paper’s full text.

Citations

Cites

Show all 58 references

Research works printed but not linked: 1

  1. Czerwoniec A , Kasprzak JM , Kaminska KH , Rother K , Purta E , Bujnicki JM . 2009. Folds and functions of domains in RNA modification enzymes. In DNA and RNA modification enzymes: structure, mechanism, function and evolution (ed. Grosjean H ), pp. 289–302. Landes Bioscience, Austin, TX.

Metadata

Authors
McGaha, D. A., Collins, A., Ajisafe, L. O., Perdigao, C. C., Bondrowski, J. L., Fetsch, K., & Dunkle, J. A.
Affiliations
University of Alabama (US)
Corresponding author
Dunkle, Jack A.
Venue
RNA
Published
2024-11-08
Volume
31
Issue
2
Pages
164-180
ISSN
  • 1355-8382 (ISSN-L)
  • 1469-9001
OpenAlex
W4404174051
Cited by
0
References
58
FWCI
0.00
Type
journal article
Language
en
Open access
Licence
cc-by-nd
Locations
  • RNA (publishedVersion)
  • bioRxiv (Cold Spring Harbor Laboratory) (acceptedVersion, cc-by-nd)
  • Europe PMC (PubMed Central) (publishedVersion, cc-by-nc)
  • PubMed (publishedVersion)
  • PubMed Central (publishedVersion, cc-by-nc)
Funders
National Institute of General Medical Sciences of the National Institutes of Health (R35GM142966)
Topics
  • Life Sciences › Biochemistry, Genetics and Molecular Biology › Molecular Biology › RNA and protein synthesis mechanisms
  • Life Sciences › Biochemistry, Genetics and Molecular Biology › Molecular Biology › RNA modifications and cancer
  • Life Sciences › Biochemistry, Genetics and Molecular Biology › Molecular Biology › RNA regulation and disease
Keywords
KsgA, rRNA methylation, ribosome maturation, N-terminal disordered region, rRNA binding, antibiotic resistance, protein conformational change, active site
MeSH terms
Humans, Methylation, Methyltransferases, Models, Molecular, Mutation, RNA, Ribosomal, Mutagenesis, Site-Directed, Catalytic Domain

About these checks

Registry, retraction, Cites and statistics results are computed, not judged, with one exception: a printed reference that no index lists is read once by a model before it counts as a citation error. Claims are extracted by a model and kept only when their quote appears verbatim in the text; each cited source is then checked, with a model’s help, for whether it says what the claim relies on. Those verdicts can be wrong — read the claim’s quote and the cited source before relying on one.

Statistics and arithmetic are recomputed, not judged.

Confidence bands are shown only for fields calibrated on our annotated test set. None is calibrated yet, so no band is shown.

What counts as a claim ›How we measure confidence ›How we check this ›

Are you an author, or do you see a problem with this page? Request a review

How to cite

Cite CoChat for the checks on this page, and the paper for its own findings.

This page
CoChat. (2026). Citation check: Two dynamic N-terminal regions are required for function in ribosomal RNA adenine dimethylase family members. https://app.cochat.ai/papers/10.1261/rna.080068.124
The paper
McGaha, D. A., Collins, A., Ajisafe, L. O., Perdigao, C. C., Bondrowski, J. L., Fetsch, K., & Dunkle, J. A. (2025). Two dynamic N-terminal regions are required for function in ribosomal RNA adenine dimethylase family members. RNA. https://doi.org/10.1261/rna.080068.124

Data sources

Bibliographic data: Semantic Scholar, OpenAlex, Crossref.

Contains information from the Semantic Scholar Academic Graph Datasets, made available under the ODC Attribution License (ODC-BY 1.0).

Semantic Scholar’s data is described in: Kinney, R., et al. (2023). The Semantic Scholar Open Data Platform. arXiv:2301.10140.