

The DOI matches its Crossref record; 48 of the 49 references it cites were found in a registry or an index, and 1 are not checked yet; none of the 20 sources its claims cite is checked for support yet.
Association of maternal educational attainment with preterm birth and low birth weight: A systematic review and meta-analysis
Open accessAbstract
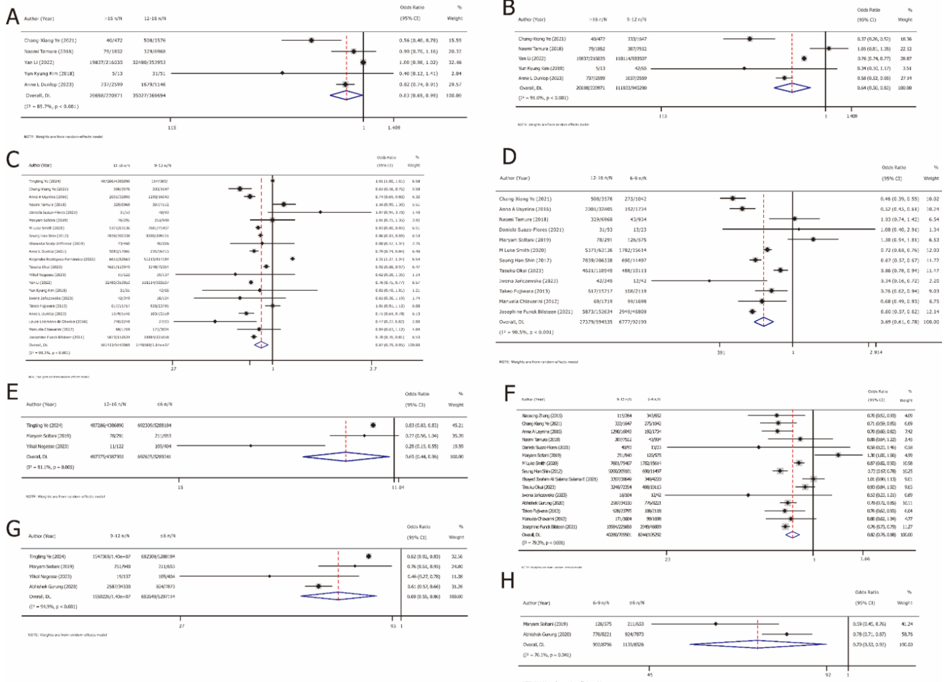
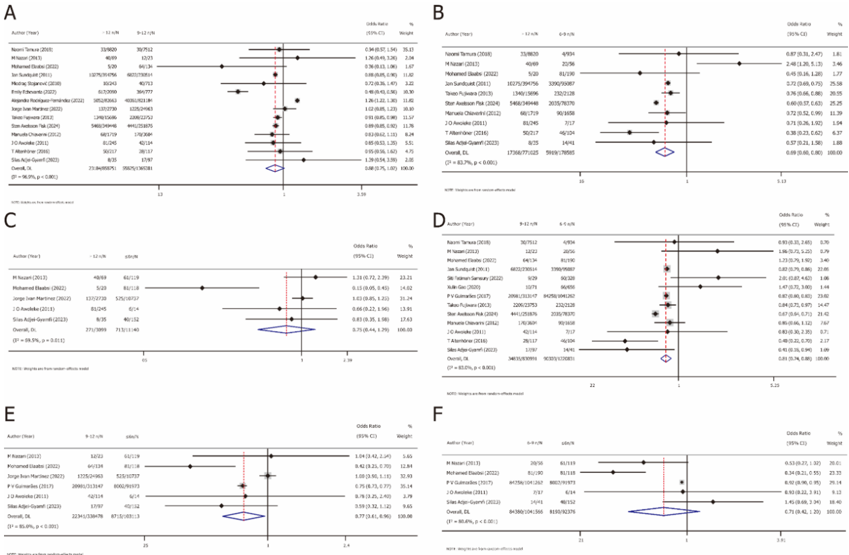
BACKGROUNDMaternal educational attainment is an important socioeconomic indicator associated with health literacy, healthcare access, and health-related behaviors.However, its association with preterm birth and low birth weight (LBW) varies across populations, educational classifications, and study settings. AIMTo determine the associations of maternal educational attainment with preterm birth and LBW. METHODSPubMed, Web of Science, EMBASE, and the Cochrane Library were searched from inception to August 6, 2026, for observational studies examining maternal education in relation to preterm birth or LBW.Study quality was assessed using the Newcastle-Ottawa Scale.Random-effects models pooled odds ratios (OR) and 95% confidence intervals (CI).Heterogeneity, subgroup analyses, leave-one-out sensitivity analyses, and potential small-study effects were evaluated.The protocol was registered in PROSPERO (CRD42024576198). RESULTSThirty-seven studies involving 30432601 births were included; 24 contributed to preterm birth analyses and 17 to LBW analyses, with four reporting both outcomes.For ≥ 12 years vs < 12 years of maternal education, higher attainment was associated with lower odds of preterm birth (OR = 0.82, 95%CI: 0.75-0.89)and LBW (OR = 0.83, 95%CI: 0.71-0.98).Heterogeneity was considerable for preterm birth (I² = 99.3%) and LBW (I² = 5 / 55 97.9%).Subgroup estimates varied by region, economic setting, and study design.Leave-one-out analyses did not materially alter the overall direction of associations. CONCLUSIONHigher maternal educational attainment was associated with lower odds of preterm birth and LBW, although substantial heterogeneity limits causal interpretation and generalizability.
Checked 2026-11-13 · 1 reference not checked yet
Overview
CoChat Summary
TL;DR
Higher maternal educational attainment was associated with lower odds of preterm birth and low birth weight in a meta-analysis of 37 observational studies. However, considerable heterogeneity and heterogeneous education definitions limit causal interpretation and generalizability.
Key findings
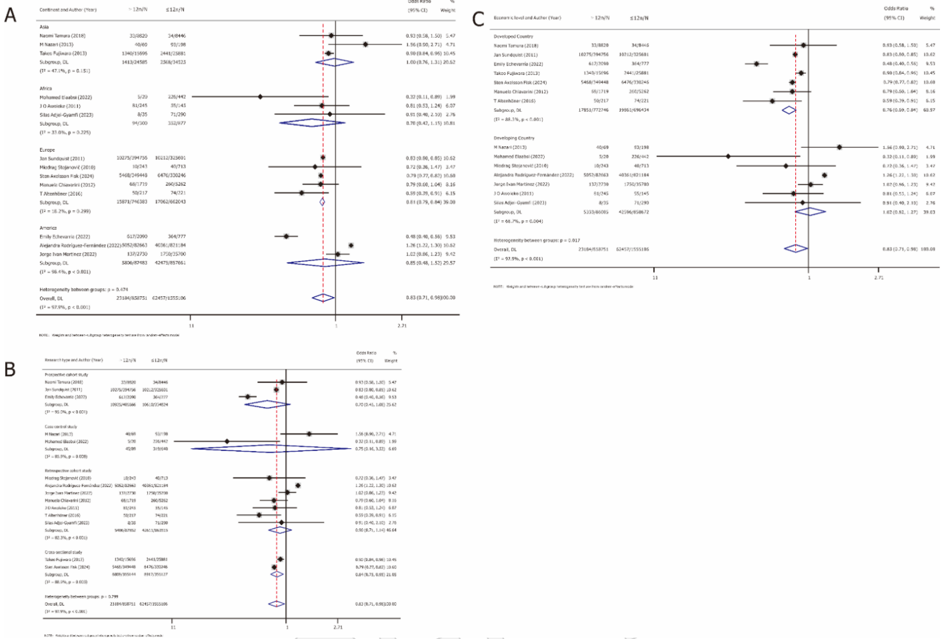
- Among 37 studies representing 30,432,601 births, maternal education ≥ 12 years vs < 12 years was associated with lower odds of preterm birth (OR = 0.82, 95%CI: 0.75–0.89; I² = 99.3%) and low birth weight (OR = 0.83, 95%CI: 0.71–0.98; I² = 97.9%).
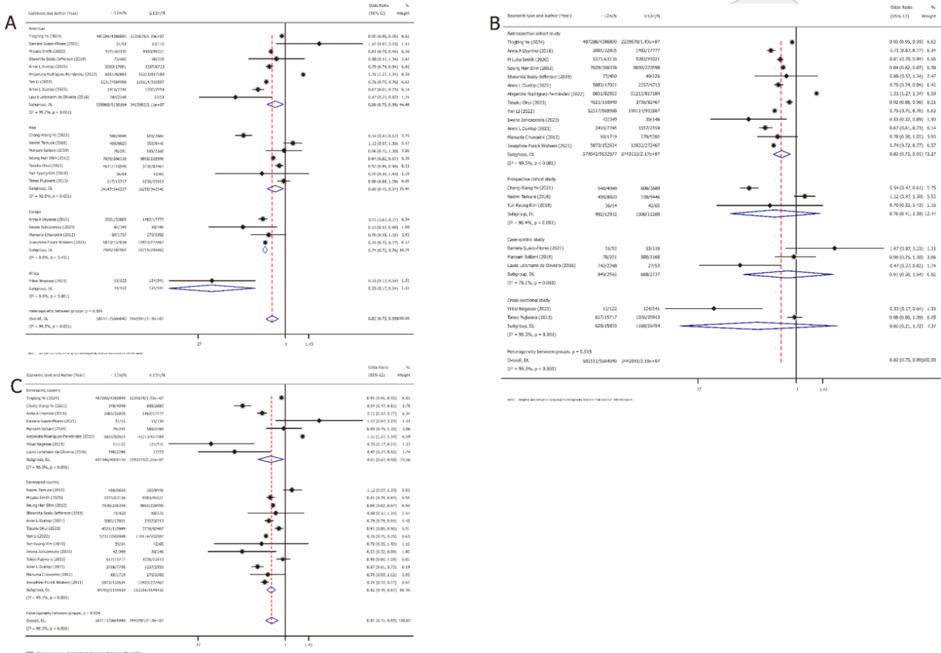
- Preterm birth subgroup estimates were significant in the Americas (OR = 0.86, 95%CI: 0.75–0.98; I² = 99.7%), Asia (OR = 0.86, 95%CI: 0.76–0.97; I² = 92.8%), and Europe (OR = 0.74, 95%CI: 0.72–0.76; I² = 0.0%).
- Low birth weight subgroup estimates were significant in Europe (OR = 0.81, 95%CI: 0.79–0.84; I² = 18.2%) and developed countries (OR = 0.76, 95%CI: 0.69–0.84), but not in developing countries (OR = 1.02, 95%CI: 0.82–1.27).
- Leave-one-out analyses did not materially alter the direction or statistical interpretation of the overall pooled associations.
Methods
- Systematic review and meta-analysis of observational studies (cohort, case-control, cross-sectional) published from 2010 onward, identified from PubMed, Web of Science, EMBASE, and the Cochrane Library through August 6, 2026; protocol registered in PROSPERO (CRD42024576198).
- Thirty-seven studies were included; 24 contributed to preterm birth analyses and 17 to low birth weight analyses, with 4 reporting both outcomes.
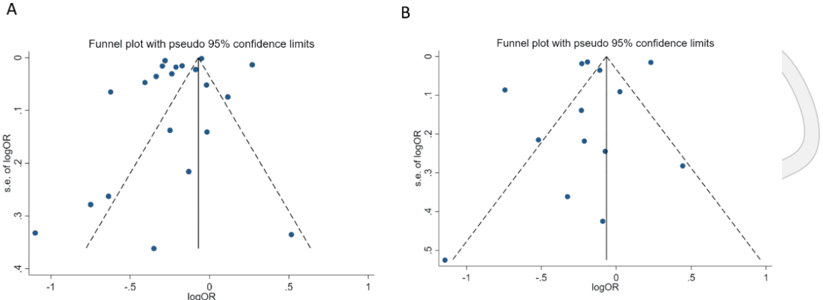
- Random-effects models pooled odds ratios and 95% confidence intervals; heterogeneity was assessed with I² and Cochran’s Q, with subgroup analyses by region, study design, and national economic level, plus leave-one-out sensitivity analyses and Egger’s tests.
Limitations
- The paper states that all included studies were observational, so residual or unmeasured confounding cannot be excluded and causal inference is not warranted.
- The paper states that differences in maternal educational attainment classification limited comparability and precluded a definitive dose-response assessment; methodological quality varied, and substantial residual heterogeneity persisted.
- The paper states that some subgroup analyses included few studies, subgroup differences in statistical significance should not be interpreted as formal between-subgroup differences, and publication bias cannot be excluded because funnel plots and Egger’s tests had limited power.
Model-written summary. Check it against the paper before relying on it.
Integrity signals
Registry
Cites
Statistics
Figures
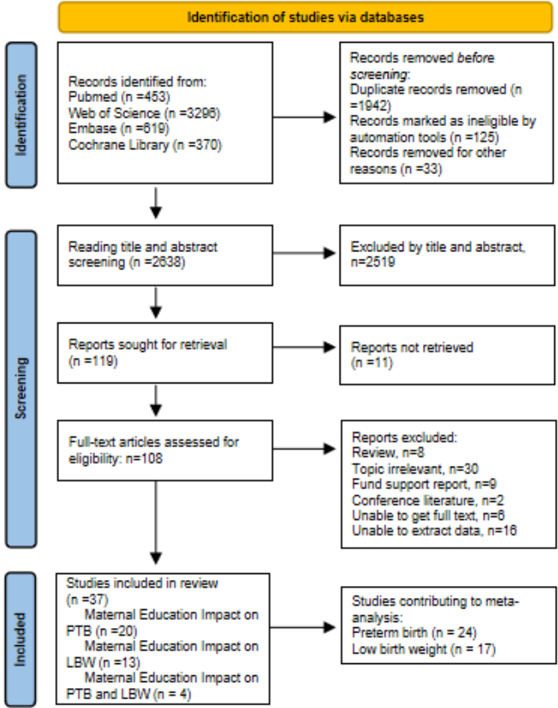
Verification
Claims the paper makes
0 Valid · 0 Not valid · 15 Not checked · 130 Own results and interpretations
A result the paper reports from its own data — it cites no other source for it, so there is none to check. The quote shows it is in the paper.
In the paper
“and LBW (OR = 0.83, 95%CI: 0.71-0.98).”
- Also stated in: § Subgroup and sensitivity analyses · plain
“the overall pooled analysis likewise showed lower odds among mothers with ≥ 12 years of education than among those with < 12 years of education (OR = 0.83, 95%CI: 0.71-0.98)”
§ Association of maternal educational attainment with preterm birth and low birth weight: A systematic review and meta-analysis > Abstract
plainstates an association- Asserted: passes — The authors put it forward as true.
- Checkable: passes — It can be checked against evidence.
- Load-bearing: passes — The paper’s conclusions depend on it.
- Based: passes — The paper gives a reason why it holds.
- Also stated in: § Subgroup and sensitivity analyses · plain
A result the paper reports from its own data — it cites no other source for it, so there is none to check. The quote shows it is in the paper.
In the paper
“For ≥ 12 years vs < 12 years of maternal education, higher attainment was associated with lower odds of preterm birth (OR = 0.82, 95%CI: 0.75-0.89)”
- Also stated in: § Subgroup and sensitivity analyses · plain
“maternal educational attainment ≥ 12 years was associated with lower odds of preterm birth compared with < 12 years of education in the overall analysis (OR = 0.82, 95%CI: 0.75-0.89)”
§ Association of maternal educational attainment with preterm birth and low birth weight: A systematic review and meta-analysis > Abstract
plainstates an association- Asserted: passes — The authors put it forward as true.
- Checkable: passes — It can be checked against evidence.
- Load-bearing: passes — The paper’s conclusions depend on it.
- Based: passes — The paper gives a reason why it holds.
- Also stated in: § Subgroup and sensitivity analyses · plain
A result the paper reports from its own data — it cites no other source for it, so there is none to check. The quote shows it is in the paper.
In the paper
“with considerable heterogeneity (I² = 97.9%)”
§ Association of maternal educational attainment with preterm birth and low birth weight: A systematic review and meta-analysis > Subgroup and sensitivity analyses
plain- Asserted: passes — The authors put it forward as true.
- Checkable: passes — It can be checked against evidence.
- Load-bearing: unclear — It is unclear whether the paper’s conclusions depend on it.
- Based: passes — The paper gives a reason why it holds.
A result the paper reports from its own data — it cites no other source for it, so there is none to check. The quote shows it is in the paper.
In the paper
“Subgroup estimates varied by region, economic setting, and study design.”
§ Association of maternal educational attainment with preterm birth and low birth weight: A systematic review and meta-analysis > Abstract
plainstates an association- Asserted: passes — The authors put it forward as true.
- Checkable: passes — It can be checked against evidence.
- Load-bearing: unclear — It is unclear whether the paper’s conclusions depend on it.
- Based: passes — The paper gives a reason why it holds.
A result the paper reports from its own data — it cites no other source for it, so there is none to check. The quote shows it is in the paper.
In the paper
“Leave-one-out analyses did not materially alter the overall direction of associations.”
- Also stated in: § Subgroup and sensitivity analyses · plain
“Exclusion of individual studies did not materially alter the direction or statistical interpretation of the overall pooled associations”
§ Association of maternal educational attainment with preterm birth and low birth weight: A systematic review and meta-analysis > Abstract
plain- Asserted: passes — The authors put it forward as true.
- Checkable: passes — It can be checked against evidence.
- Load-bearing: unclear — It is unclear whether the paper’s conclusions depend on it.
- Based: passes — The paper gives a reason why it holds.
- Also stated in: § Subgroup and sensitivity analyses · plain
74 more claims
Create a free account to see all 145 claims and every source verdict.
- It may state two separate claims as one. 45
- Probably not a substantial claim. 33
- The quote only partly states this claim. 1
Citations
Cites
Measuring inconsistency in meta-analyses
Higgins, J. P. T., Thompson, S. G., Deeks, J. J., & Altman, D. G. (2003) · BMJ · doi:10.1136/bmj.327.7414.557 · Cited by 63,139
Meta-analysis in clinical trials
DerSimonian, R., & Laird, N. (1986) · Controlled Clinical Trials · doi:10.1016/0197-2456(86)90046-2 · Cited by 39,552
The combination of estimates from different experiments
Cochran, W. G. (1954) · Biometrics · doi:10.2307/3001666 · Cited by 5,380
Chawanpaiboon, S., Vogel, J. P., Moller, A.-B., Lumbiganon, P., Petzold, M., Hogan, D., Landoulsi, S., Jampathong, N., Kongwattanakul, K., Laopaiboon, M., et al. (2019) · The Lancet Global Health · doi:10.1016/s2214-109x(18)30451-0 · Cited by 2,572
Blencowe, H., Krasevec, J., de Onis, M., Black, R. E., An, X., Stevens, G. A., Borghi, E., Hayashi, C., Estevez, D., Cegolon, L., et al. (2019) · The Lancet Global Health · doi:10.1016/s2214-109x(18)30565-5 · Cited by 1,242
Maternal and neonatal factors related to prematurity
de Oliveira, L. L., Gonçalves, A. D. C., da Costa, J. S. D., & Bonilha, A. L. D. L. (2016) · Revista da Escola de Enfermagem da USP · doi:10.1590/s0080-623420160000400002 · Cited by 124
Association of Health Literacy Among Nulliparous Individuals and Maternal and Neonatal Outcomes
Yee, L. M., Silver, R. M., Haas, D. M., Parry, S. I., Mercer, B. M., Wing, D. A., Reddy, U. M., Saade, G. R., Simhan, H. N., & Grobman, W. A. (2021) · JAMA Network Open · doi:10.1001/jamanetworkopen.2021.22576 · Cited by 85
Gurung, A., Wrammert, J., Sunny, A. K., Gurung, R., Rana, N., Basaula, Y. N., Paudel, P., Pokhrel, A., & Ashish, K. C. (2020) · Archives of Public Health · doi:10.1186/s13690-020-00446-7 · Cited by 79
Rogne, T., Gill, D., Liew, Z., Shi, X., Stensrud, V. H., Nilsen, T. I. L., & Burgess, S. (2024) · JAMA Network Open · doi:10.1001/jamanetworkopen.2023.51166 · Cited by 72
Income Inequality, Parental Socioeconomic Status, and Birth Outcomes in Japan
Fujiwara, T., Ito, J., & Kawachi, I. I. (2013) · American Journal of Epidemiology · doi:10.1093/aje/kws355 · Cited by 69
Heaman, M. I., Martens, P. J., Brownell, M. D., Chartier, M., Thiessen, K. R., Derksen, S. A., & Helewa, M. E. (2018) · BMC Pregnancy and Childbirth · doi:10.1186/s12884-018-2061-1 · Cited by 68
Tamura, N., Hanaoka, T., Ito, K., Araki, A., Miyashita, C., Ito, S., Minakami, H., Cho, K., Endo, T., Sengoku, K., et al. (2018) · International Journal of Environmental Research and Public Health · doi:10.3390/ijerph15020369 · Cited by 60
Chiavarini, M., Bartolucci, F., Gili, A., Pieroni, L., & Minelli, L. (2011) · International Journal of Public Health · doi:10.1007/s00038-011-0311-3 · Cited by 43
Barchitta, M., Maugeri, A., Lio, R. M. S., Favara, G., Mastra, C. L., Rosa, M. C. L., & Agodi, A. (2020) · International Journal of Environmental Research and Public Health · doi:10.3390/ijerph17020638 · Cited by 40
Smith, M. L., & Hardeman, R. R. (2020) · International Journal of Environmental Research and Public Health · doi:10.3390/ijerph17176391 · Cited by 38
Soltani, M., Tabatabaee, H. R., Saeidinejat, S., Eslahi, M., Yaghoobi, H., Mazloumi, E., Rajabi, A., Ghasemi, A., Keyghobadi, N., Enayatrad, M., et al. (2019) · BMC Pregnancy and Childbirth · doi:10.1186/s12884-019-2183-0 · Cited by 35
Risk factors for preterm birth: a prospective cohort study.
Ye, C., Chen, S., Wang, T., Zhang, S., Qin, J., & Chen, L. (2021) · PubMed Central · doi:10.7499/j.issn.1008-8830.2108015 · Cited by 32
Self-citationDunlop, A. L., Essalmi, A. G., Alvalos, L., Breton, C., Camargo, C. A., Cowell, W. J., Dabelea, D., Dager, S. R., Duarte, C., Elliott, A., et al. (2021) · PLOS ONE · doi:10.1371/journal.pone.0245064 · Cited by 31
Maternal risk factors for low birth weight babies in Lagos, Nigeria
Awoleke, J. O. (2011) · Archives of Gynecology and Obstetrics · doi:10.1007/s00404-011-1885-y · Cited by 30
Nakamura, A., Pryor, L., Ballon, M., Lioret, S., Heude, B., Charles, M.-A., Melchior, M., & El-Khoury Lesueur, F. (2020) · European Journal of Public Health · doi:10.1093/eurpub/ckaa076 · Cited by 29
Adjei-Gyamfi, S., Musah, B., Asirifi, A., Hammond, J., Aryee, P. A., Miho, S., & Aiga, H. (2023) · Journal of Health Population and Nutrition · doi:10.1186/s41043-023-00431-0 · Cited by 29
Comparison of maternal characteristics in low birth weight and normal birth weight infants
Nazari, M., Zainiyah, S. Y. S., Lye, M. S., Zalilah, M. S., & Heidarzadeh, M. (2013) · Eastern Mediterranean Health Journal · doi:10.26719/2013.19.9.775 · Cited by 24
Temporal Changes in Socioeconomic Influences on Health: Maternal Education and Preterm Birth
El-Sayed, A. M., & Galea, S. (2012) · American Journal of Public Health · doi:10.2105/ajph.2011.300564 · Cited by 21
Low birth weight infant among teenage pregnancy in Terengganu, Malaysia: A cross-sectional study
Samsury, S. F., Ismail, T. A. T., & Hassan, R. (2022) · Malaysian Family Physician · doi:10.51866/oa.59 · Cited by 20
Maternal preterm birth prediction in the United States: a case-control database study
Li, Y., Fu, X., Guo, X., Liang, H., Cao, D., & Shi, J. (2022) · BMC Pediatrics · doi:10.1186/s12887-022-03591-w · Cited by 18
Mothers, places and small for gestational age births: a cohort study
Sundquist, J., Sundquist, K., Johansson, S.-E., Li, X., & Winkleby, M. A. (2010) · Archives of Disease in Childhood · doi:10.1136/adc.2009.180042 · Cited by 17
Sealy-Jefferson, S. M., & Misra, D. P. (2019) · International Journal of Environmental Research and Public Health · doi:10.3390/ijerph16060904 · Cited by 17
Elaabsi, M., Loukid, M., & Lamtali, S. (2022) · PLoS ONE · doi:10.1371/journal.pone.0269832 · Cited by 16
Okui, T. (2023) · Children · doi:10.3390/children10020342 · Cited by 16
Dunlop, A. L., Burjak, M., Dean, L. T., Alshawabkeh, A. N., Avalos, L. A., Aschner, J. L., Breton, C. V., Charifson, M., Cordero, J. F., Dabelea, D., et al. (2023) · Frontiers in Public Health · doi:10.3389/fpubh.2023.1165089 · Cited by 16
The Relevance of Maternal Socioeconomic Characteristics for Low Birth Weight – a Case-Control Study
Altenhöner, T., Köhler, M., & Philippi, M. (2016) · Geburtshilfe und Frauenheilkunde · doi:10.1055/s-0042-100204 · Cited by 14
Birth Size and Maternal, Social, and Environmental Factors in the Province of Jujuy, Argentina
Martínez, J. I., Figueroa, M. I., Carrión, J. M. M., Alfaro, E., & Dipierri, J. E. (2022) · International Journal of Environmental Research and Public Health · doi:10.3390/ijerph19020621 · Cited by 14
Shin, S. H., Rim, T. H., Park, H., Park, S. M., & Kim, H.-S. (2011) · International Journal of Public Health · doi:10.1007/s00038-011-0318-9 · Cited by 13
The role of parental education on the relationship between gestational age and school outcomes
Bilsteen, J. F., Ekstrøm, C., Børch, K., & Andersen, A. N. (2021) · Paediatric and Perinatal Epidemiology · doi:10.1111/ppe.12766 · Cited by 13
Smith, L. K., Philibert, M., Scott, S., Benedé, M. J. V., Abuladze, L., Alcaide, A. R., Cuttini, M., Elorriaga, M. F., Farr, A., Macfarlane, A., et al. (2025) · BJOG An International Journal of Obstetrics & Gynaecology · doi:10.1111/1471-0528.18274 · Cited by 13
Stojanović, M., Bojanić, V., Musovic, D., Milošević, Z. G., Stojanović, D. B., Visnjic, A. M., Vučić, M., Milosavljević, I., & Vidanovic, M. (2010) · Vojnosanitetski pregled · doi:10.2298/vsp1002145s · Cited by 11
Maternal greenness exposure and preterm birth in Brazil: A nationwide birth cohort study
Ye, T., Xu, R., Abramson, M. J., Guo, Y., Zhang, Y., Saldiva, P. H. N., Coêlho, M. D. S. Z. S., & Li, S. (2023) · Environmental Pollution · doi:10.1016/j.envpol.2023.123156 · Cited by 11
Self-citationMaternal Risk Factors for Preterm Birth in Murmansk County, Russia: A Registry‐Based Study
Александровна, У. А., Александрович, П. В., Grjibovski, A. M., Krettek, A., Nieboer, E., Odland, J. Ø., & Anda, E. E. (2016) · Paediatric and Perinatal Epidemiology · doi:10.1111/ppe.12304 · Cited by 10
Socioeconomic Risk Factors for Preterm Birth in the state of Qatar: A Population-based Study.
Elsayed Ibrahim Ali Salama Salama, E., Salama, H. S., & Alobaidly, S. H. (2021) · Acta bio-medica dell'Ateneo parmense/Acta biomedica · doi:10.23750/abm.v92i3.11292 · Cited by 10
Yamamoto, S. S., Premji, S., Saini, V., McDonald, S., & Jhangri, G. S. (2023) · BMC Pregnancy and Childbirth · doi:10.1186/s12884-023-06029-y · Cited by 9
Family Educational Attainment and Racial Disparities in Low Birth Weight
Echevarria, E., & Lorch, S. A. (2022) · PEDIATRICS · doi:10.1542/peds.2021-052369 · Cited by 8
Risk Factors for Premature Birth among Premature Obstetric Labor Women: A Prospective Cohort Study
Kim, Y. K., & Lim, K. H. (2018) · Korean journal of women health nursing/Yeoseong geon'gang ganho hag'hoeji/Yeoseong geon-gang ganho hakoeji · doi:10.4069/kjwhn.2018.24.3.233 · Cited by 7
Association between Maternal Factors, Preterm Birth, and Low Birth Weight of Chilean Singletons
Rodríguez‐Fernández, A., la Fuente, M. R.-D., Sanhueza-Riquelme, X., Parra‐Flores, J., Serrano, M. D. M., & Maury-Sintjago, E. A. (2022) · Children · doi:10.3390/children9070967 · Cited by 7
Suazo-Flores, D., Sáez, K. L., & Cid-Aguayo, M. (2021) · Revista chilena de obstetricia y ginecología · doi:10.24875/rechog.m21000025 · Cited by 6
Negesse, Y., & Abebe, G. F. (2023) · Frontiers in Public Health · doi:10.3389/fpubh.2022.881963 · Cited by 4
Fisk, S. A., Alex-Petersen, J., Rostila, M., Liu, C., & Juárez, S. (2023) · European Journal of Public Health · doi:10.1093/eurpub/ckad184 · Cited by 4
Contributors to Preterm Birth: Data from a Single Polish Perinatal Center
Jańczewska, I., Cichoń-Kotek, M., Glińska, M., Deptulska-Hurko, K., Basiński, K., Woźniak, M. K., Wiergowski, M., Biziuk, M., Szablewska, A. W., Cichoń, M., et al. (2023) · Children · doi:10.3390/children10030447 · Cited by 3
Guimarães, P. V., Fonseca, S. C., Pinheiro, R. S., AGUIAR, F. P. L., de Camargo, K. R., & Coeli, C. M. (2016) · Journal of Public Health · doi:10.1093/pubmed/fdw136 · Cited by 2
Jain, K., Rana, B. M., Shukla, R., & Rathod, V. (2022) · National Journal of Community Medicine · doi:10.55489/njcm.130720222099 · Cited by 1
Research works printed but not linked: 2
- Hu XL, Chen Y, Xia HP, Zhang YJ. [Analysis of maternal clinical risk factors for different degrees of small for gestational age infant]. Shanghai Jiaotong Daxue Xuebao (Yixueban) 2020; 40: 489-493 [DOI: 10.3969/j.issn.1674-8115.2020.04.012] · DOI
- Zhang X, Zhou M, Chen L, Hao B, Zhao G. Risk factors for preterm birth: a case- control study in rural area of western China. Int J Clin Exp Med 2015; 8: 4527-4532 [PMID: 26064379]
Cited by
Still being checked.
Metadata
- Authors
- Tian, Y.-G., Huang, S.-F., Jin, D.-F., Li, S.-L., Sun, J.-K., Wang, P., Li, Z.-P., Fan, Y.-W., Chen, S.-S., & Zhang, C.-J.
- Affiliations
- Fifth Affiliated Hospital of Zhengzhou University (CN)
- Venue
- World Journal of Meta-Analysis
- Publisher
- Baishideng Publishing Group Inc.
- Published
- 2026-10-08
- ISSN
- 2308-3840 (ISSN-L)
- OpenAlex
- W7220896472
- Cited by
- 0
- References
- 48
- FWCI
- 0.00
- Type
- journal article
- Language
- en
- Open access
- diamond
- doi.org
- Licence
- cc-by-nc
- Locations
- World Journal of Meta-Analysis (publishedVersion, cc-by-nc)
- Topics
- Health Sciences › Medicine › Pediatrics, Perinatology and Child Health › Maternal and Neonatal Healthcare
- Health Sciences › Medicine › Pediatrics, Perinatology and Child Health › Infant Development and Preterm Care
- Health Sciences › Medicine › Pediatrics, Perinatology and Child Health › Birth, Development, and Health
- Keywords
- maternal educational attainment, preterm birth, low birth weight, socioeconomic status, maternal education, birth outcomes, health literacy, health care access
About these checks
Registry, retraction, Cites and statistics results are computed, not judged, with one exception: a printed reference that no index lists is read once by a model before it counts as a citation error. Claims are extracted by a model and kept only when their quote appears verbatim in the text; each cited source is then checked, with a model’s help, for whether it says what the claim relies on. Those verdicts can be wrong — read the claim’s quote and the cited source before relying on one.
A language model drew the claims from the paper on 2026-11-13, under version 3 of the claim definition (model deepseek-v4.1-flash, prompt extract-v3).
A second model labelled each claim on 2026-11-13 (model jev-1.13-20260917, definition revision gold-guideline-v0.2).
Statistics and arithmetic are recomputed, not judged.
Confidence bands are shown only for fields calibrated on our annotated test set. None is calibrated yet, so no band is shown.
What counts as a claim ›How we measure confidence ›How we check this ›
Are you an author, or do you see a problem with this page? Request a review
Data sources
Bibliographic data: Semantic Scholar, OpenAlex, Crossref.
Contains information from the Semantic Scholar Academic Graph Datasets, made available under the ODC Attribution License (ODC-BY 1.0).
Semantic Scholar’s data is described in: Kinney, R., et al. (2023). The Semantic Scholar Open Data Platform. arXiv:2301.10140.
