

The DOI matches its Crossref record; 86 of the 86 references it cites were found in a registry or an index.
Heterogeneity, Mixing, and the Spatial Scales of Mosquito-Borne Pathogen Transmission
Open accessAbstract
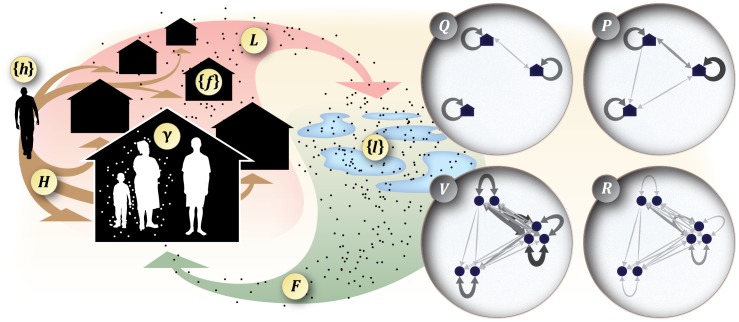
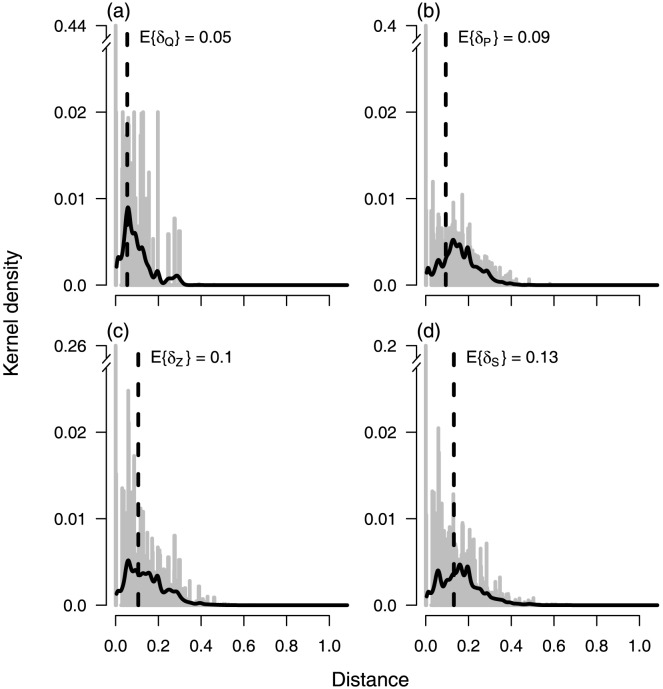
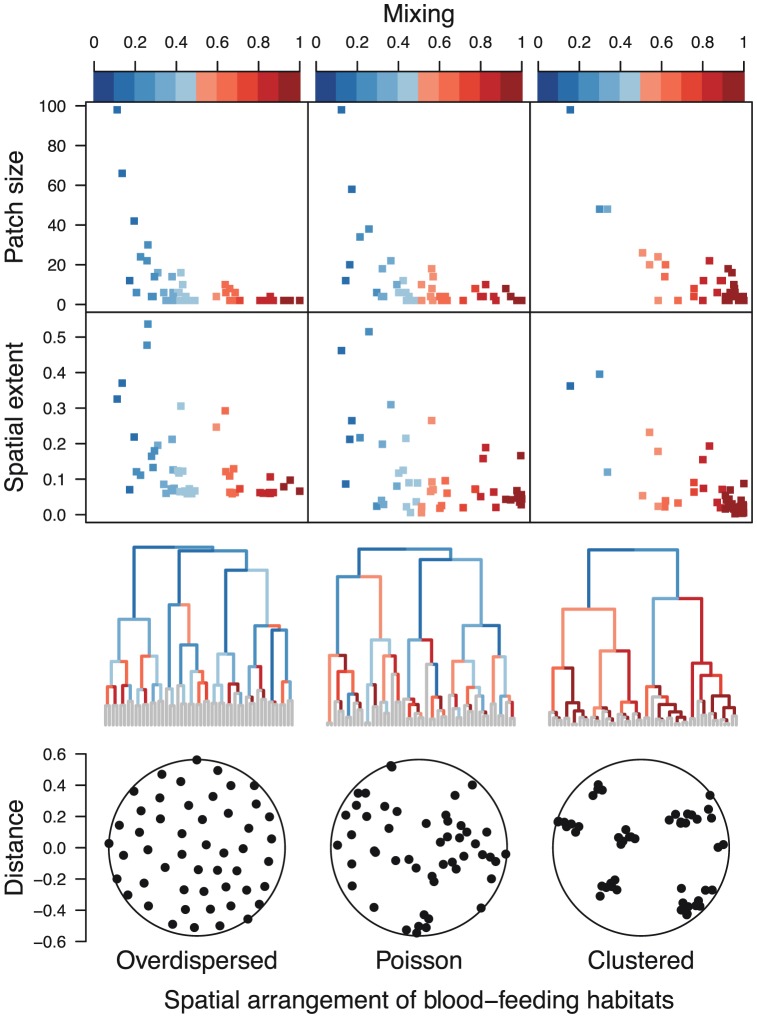
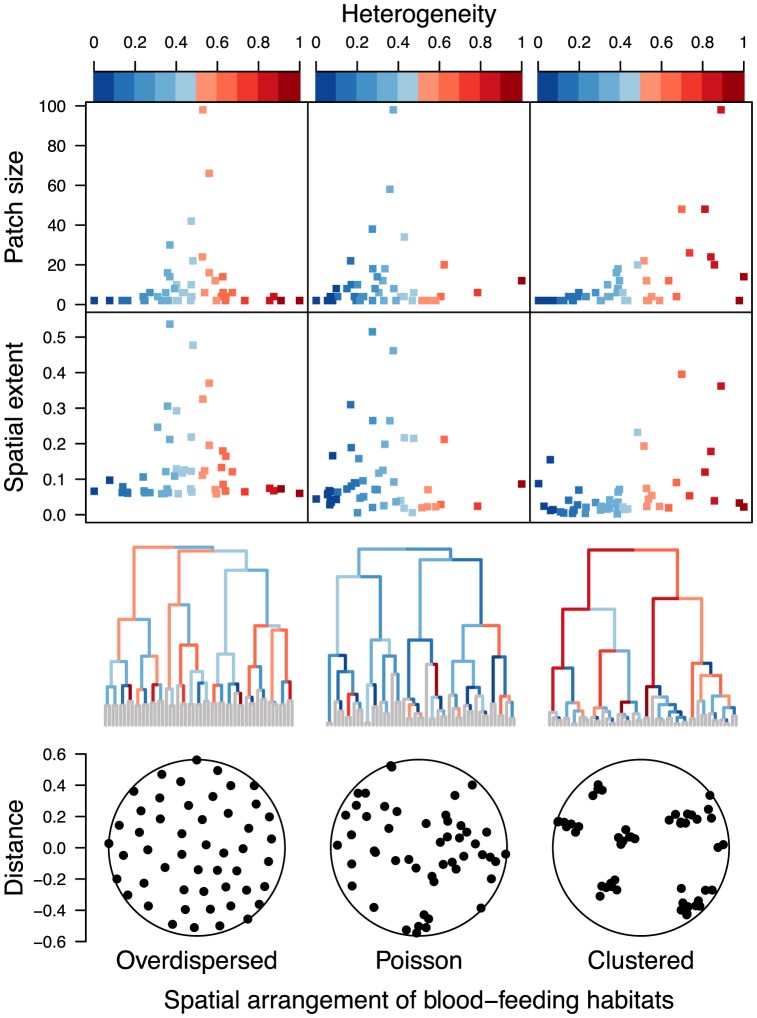
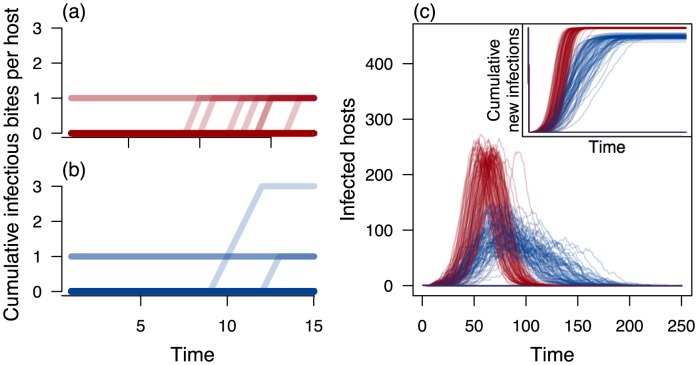
The Ross-Macdonald model has dominated theory for mosquito-borne pathogen transmission dynamics and control for over a century. The model, like many other basic population models, makes the mathematically convenient assumption that populations are well mixed; i.e., that each mosquito is equally likely to bite any vertebrate host. This assumption raises questions about the validity and utility of current theory because it is in conflict with preponderant empirical evidence that transmission is heterogeneous. Here, we propose a new dynamic framework that is realistic enough to describe biological causes of heterogeneous transmission of mosquito-borne pathogens of humans, yet tractable enough to provide a basis for developing and improving general theory. The framework is based on the ecological context of mosquito blood meals and the fine-scale movements of individual mosquitoes and human hosts that give rise to heterogeneous transmission. Using this framework, we describe pathogen dispersion in terms of individual-level analogues of two classical quantities: vectorial capacity and the basic reproductive number, R0. Importantly, this framework explicitly accounts for three key components of overall heterogeneity in transmission: heterogeneous exposure, poor mixing, and finite host numbers. Using these tools, we propose two ways of characterizing the spatial scales of transmission--pathogen dispersion kernels and the evenness of mixing across scales of aggregation--and demonstrate the consequences of a model's choice of spatial scale for epidemic dynamics and for estimation of R0, both by a priori model formulas and by inference of the force of infection from time-series data.
Overview
The claims and statistics of this paper haven’t been checked yet.
Run the check — free, no account needed. It reads the open-access text and checks the sources it cites.
Integrity signals
Registry
Cites
Statistics
Figures
Verification
Claims the paper makes
The claims and statistics of this paper haven’t been checked yet.
Run the check — free, no account needed. It reads the open-access text and checks the sources it cites.
Claims other papers make about this one
Each is checked against this paper’s own text: does it say what the citing paper says it does?
The cited source says what the claim attributes to it.
In the citing paper
“Other frameworks have been developed more recently that show how heterogeneous transmission arises and these lay the foundations for a systematic study of the way these factors vary across systems.91,97”
From Recasting the theory of mosquito-borne pathogen transmission dynamics and control (2014) · cites this paper as [97]
Self-check
Percentages, sums and reported differences re-computed from the paper’s own numbers.
The self-check needs the paper’s full text.
Citations
Cites
Diversity and Evenness: A Unifying Notation and Its Consequences
Hill, M. (1973) · Ecology · doi:10.2307/1934352 · Cited by 6,486
Superspreading and the effect of individual variation on disease emergence
Lloyd-Smith, J. O., Schreiber, S. J., Kopp, P. E., & Getz, W. M. (2005) · Nature · doi:10.1038/nature04153 · Cited by 2,514
Keeling, M. J., & Eames, K. T. D. (2005) · Journal of The Royal Society Interface · doi:10.1098/rsif.2005.0051 · Cited by 1,849
Woolhouse, M. E. J., Dye, C., Etard, J.-F., Smith, T., Charlwood, J. D., Garnett, G. P., Hagan, P., Hii, J. L. K., Ndhlovu, P. D., Quinnell, R. J., et al. (1997) · Proceedings of the National Academy of Sciences · doi:10.1073/pnas.94.1.338 · Cited by 1,194
Gonorrhea Transmission Dynamics and Control
Hethcote, H. W., & Yorke, J. A. (1984) · Lecture notes in biomathematics · doi:10.1007/978-3-662-07544-9 · Cited by 741
ODOR-MEDIATED BEHAVIOR OF AFROTROPICAL MALARIA MOSQUITOES
Takken, W., & Knols, B. G. (1999) · Annual Review of Entomology · doi:10.1146/annurev.ento.44.1.131 · Cited by 709
Population Distribution, Settlement Patterns and Accessibility across Africa in 2010
Linard, C., Gilbert, M., Snow, R. W., Noor, A. M., & Tatem, A. J. (2012) · PLoS ONE · doi:10.1371/journal.pone.0031743 · Cited by 595
Griffin, J. T., Hollingsworth, T. D., Okell, L. C., Churcher, T. S., White, M., Hinsley, W., Bousema, T., Drakeley, C. J., Ferguson, N. M., Basáñez, M.-G., et al. (2010) · PLoS Medicine · doi:10.1371/journal.pmed.1000324 · Cited by 595
The role of human movement in the transmission of vector-borne pathogens
Stoddard, S. T., Morrison, A. C., Vazquez-Prokopec, G. M., Paz Soldan, V., Kochel, T. J., Kitron, U., Elder, J. P., & Scott, T. W. (2009) · PLoS Neglected Tropical Diseases · doi:10.1371/journal.pntd.0000481 · Cited by 573
Self-citationHitting Hotspots: Spatial Targeting of Malaria for Control and Elimination
Bousema, T., Griffin, J. T., Sauerwein, R. W., Smith, D. L., Churcher, T. S., Takken, W., Ghani, A. C., DRAKELEY, C. J., & Gosling, R. D. (2012) · PLoS Medicine · doi:10.1371/journal.pmed.1001165 · Cited by 566
Self-citation
Cited by
Sorted by citations
Items 101–128 of 128
Rojas-Araya, D., Alto, B. W., Burkett-Cadena, N. D., & Cummings, D. A. T. (2020) · Acta Tropica · doi:10.1016/j.actatropica.2020.105491 · Cited by 7
Agent Based Modelling and West Nile Virus: A Survey
Nasrinpour, H. R., Friesen, M., & McLeod, R. D. (2018) · Journal of Medical and Biological Engineering · doi:10.1007/s40846-018-0396-8 · Cited by 6
Robustness of the reproductive number estimates in vector-borne disease systems
Tennant, W. S. D., & Recker, M. (2018) · PLoS neglected tropical diseases · doi:10.1371/journal.pntd.0006999 · Cited by 6
Modeling Intraday Aedes-human exposure dynamics enhances dengue risk prediction
Knoblauch, S., Heidecke, J., Rocha, A. A. D. A., Pimenta, P. F. P., Reinmuth, M., Lautenbach, S., Brady, O. J., Jänisch, T., Resch, B., Biljecki, F., et al. (2025) · Scientific Reports · doi:10.1038/s41598-025-91950-9 · Cited by 5
Tang, B., Ma, K., Liu, Y., Xia, W., Tang, S., Xiao, Y., & Cheke, R. (2024) · PLoS Computational Biology · doi:10.1371/journal.pcbi.1012497 · Cited by 5
Predictability of infectious disease outbreak severity: Chikungunya as a case study
Meyer, A. D., Guerrero, S. M., Dean, N. E., Anderson, K. B., Stoddard, S. T., & Perkins, T. A. (2025) · Science Advances · doi:10.1126/sciadv.adt5419 · Cited by 4
Self-citationRonald Ross: Pioneer of Malaria Research and Nobel Laureate
Pande, V., Bahal, M., Dua, J., & Gupta, A. (2024) · Cureus · doi:10.7759/cureus.65993 · Cited by 4
The impact of dengue illness on social distancing and caregiving behavior
Schaber, K. L., Morrison, A. C., Elson, W. H. D., Astete, H., López, J. J. C., López, E. J. R., Flores, W. L. Q., Vizcarra, S. A., Scott, T. W., Waller, L. A., et al. (2021) · PLoS neglected tropical diseases · doi:10.1371/journal.pntd.0009614 · Cited by 4
Self-citationDougherty, E. R., Seidel, D. P., Carlson, C. J., & Getz, W. M. (2018) · bioRxiv (Cold Spring Harbor Laboratory) · doi:10.1101/261198 · Cited by 4
Du, H., Zhu, A., Yang, X., & Ma, T. (2025) · International Journal of Geographical Information Systems · doi:10.1080/13658816.2025.2595668 · Cited by 2
The effects of variable spatial aggregation on lymphatic filariasis transmission
Shaw, C., McLure, A., & Glass, K. (2025) · Parasites & Vectors · doi:10.1186/s13071-024-06582-1 · Cited by 2
C., H. M. S., Wu, S. L., Henry, J. M., Guerra, C. A., Galick, D. S., García, G. A., Marshall, J. M., & Smith, D. L. (2026) · PLOS complex systems. · doi:10.1371/journal.pcsy.0000108 · Cited by 2
Self-citationEstimating finite-population reproductive numbers in heterogeneous populations
Keegan, L. T., & Dushoff, J. G. (2016) · Journal of Theoretical Biology · doi:10.1016/j.jtbi.2016.01.022 · Cited by 2
Toohey, J. M., Otero, L., Siaca, I. F., & Acevedo, M. A. (2022) · Ecosphere · doi:10.1002/ecs2.4297 · Cited by 1
Delecroix, C., ten Bosch, Q. A., van Nes, E. H., Scheffer, M., & van de Leemput, I. A. (2025) · PLoS Computational Biology · doi:10.1371/journal.pcbi.1012703 · Cited by 1
State-dependent domicile leaving rates in Anopheles gambiae
Zappia, S. P. W., Chubaty, A. M., & Roitberg, B. D. (2018) · Malaria Journal · doi:10.1186/s12936-017-2166-4 · Cited by 1
Seven Challenges for Spatial Analyses of Vector-Borne Diseases
Perkins, T. A., España, G., Moore, S. M., Oidtman, R. J., Sharma, S., Singh, B. K., Siraj, A. S., Soda, K. J., Smith, M. E., Walters, M. K., et al. (2020) · Oxford University Press eBooks · doi:10.1093/oso/9780198853244.003.0003 · Cited by 1
Self-citationCapturing continuous human movement on a linear network with mobile phone towers
Dejby, J. (2017) · KTH Publication Database DiVA (KTH Royal Institute of Technology) · Cited by 1
C., H. M. S., Marshall, J. M., Wu, S. L., & Vallejo, E. E. (2017) · bioRxiv (Cold Spring Harbor Laboratory) · doi:10.1101/210450
Duan, W. (2021) · International Journal of Environmental Research and Public Health · doi:10.3390/ijerph18115716
Correction: Heterogeneity, Mixing, and the Spatial Scales of Mosquito-Borne Pathogen Transmission
Staff, T. P. C. B. (2014) · PLoS Computational Biology · doi:10.1371/journal.pcbi.1003540
Halstead, S. B. (2019) · Faculty Opinions – Post-Publication Peer Review of the Biomedical Literature · doi:10.3410/f.734924980.793562691
Rysava, K., Morrison, A. M., Paz‐Bailey, G., Stanek, D. R., Phillips, M. T., Zimler, R. A., & Johansson, M. A. (2025) · medRxiv · doi:10.64898/2025.12.09.25341886
Landscape Heterogeneity Predicts Mosquito Vector Diversity in a Semi-arid Urbanization
Leite-Vital, A. R., Alvarado, F., Ramos-Palacios, C. R., & Córdoba‐Aguilar, A. (2026) · EcoHealth · doi:10.1007/s10393-026-01793-7
Fajardo, L. C., Vincent, M., Deparis, X., Fournier, L., Faure, L., Thouillot, F., Elarouti, M., White, M. T., Salje, H., Gallian, P., et al. (2026) · The Lancet Planetary Health · doi:10.1016/j.lanplh.2026.101522
Lord, J., Bonsall, M. B., & Sulaimon, T. A. (2026) · PLoS neglected tropical diseases · doi:10.1371/journal.pntd.0014758
Metadata
- Authors
- Perkins, T. A., Scott, T. W., Le Menach, A., & Smith, D. L.
- Affiliations
- National Institutes of Health (US)
- Corresponding author
- Perkins, T. Alex
- Venue
- PLoS Computational Biology
- Publisher
- Public Library of Science (PLoS)
- Published
- 2013-12-12
- Volume
- 9
- Issue
- 12
- Pages
- e1003327
- ISSN
- 1553-734X (ISSN-L)
- 1553-7358
- PMC
- PMC3861021
- OpenAlex
- W2072086516
- Cited by
- 130
- References
- 86
- Citations by year
- 2026: 5 · 2025: 8 · 2024: 3 · 2023: 6 · 2022: 6 · 2021: 7 · 2020: 10 · 2019: 9 · 2018: 19 · 2017: 13 · 2016: 16 · 2015: 19 · 2014: 9
- FWCI
- 15.00
- Type
- journal article
- Language
- en
- Update notices
- correction (2014-02-28)
- Open access
- gold
- doi.org
- Licence
- Locations
- PLoS Computational Biology (publishedVersion, cc-by)
- Europe PMC (PubMed Central) (publishedVersion, cc-by)
- PubMed Central (publishedVersion, cc-by)
- PubMed (publishedVersion)
- RePEc: Research Papers in Economics (submittedVersion)
- DOAJ (DOAJ: Directory of Open Access Journals) (submittedVersion, cc-by-sa)
- eScholarship (California Digital Library) (submittedVersion)
- eScholarship (California Digital Library) (submittedVersion, cc-by)
- Funders
- U.S. Department of Homeland Security
- Bill and Melinda Gates Foundation (49446, OPP52250)
- Bloomberg Family Foundation
- National Institutes of Health (5r01ai069341-05)
- National Institute of Allergy and Infectious Diseases (R01-AI069341, U19AI089674)
- Fogarty International Center
- Topics
- Physical Sciences › Mathematics › Applied Mathematics › Mathematical and Theoretical Epidemiology and Ecology Models
- Health Sciences › Medicine › Public Health, Environmental and Occupational Health › Mosquito-borne diseases and control
- Health Sciences › Medicine › Public Health, Environmental and Occupational Health › Malaria Research and Control
- Keywords
- mosquito-borne pathogens, Ross-Macdonald model, transmission heterogeneity, mixing, vectorial capacity, basic reproduction number, spatial scale, mosquito blood meal, force of infection, epidemic dynamics
- MeSH terms
- Animals, Communicable Diseases, Disease Outbreaks, Humans, Insect Vectors, Culicidae, Host-Pathogen Interactions
About these checks
Registry, retraction, Cites and statistics results are computed, not judged, with one exception: a printed reference that no index lists is read once by a model before it counts as a citation error. Claims are extracted by a model and kept only when their quote appears verbatim in the text; each cited source is then checked, with a model’s help, for whether it says what the claim relies on. Those verdicts can be wrong — read the claim’s quote and the cited source before relying on one.
Statistics and arithmetic are recomputed, not judged.
Confidence bands are shown only for fields calibrated on our annotated test set. None is calibrated yet, so no band is shown.
What counts as a claim ›How we measure confidence ›How we check this ›
Are you an author, or do you see a problem with this page? Request a review
