CoChat

The DOI matches its Crossref record; the references it cites are not checked yet.

Neurally Encoding Time for Olfactory Navigation

Open access
Park, In Jun, Hein, Andrew M., Bobkov, Yuriy V., Reidenbach, Matthew A., Ache, Barry W., Principe, Jose C. · 2016 · PLOS Computational Biology

Abstract

Accurately encoding time is one of the fundamental challenges faced by the nervous system in mediating behavior. We recently reported that some animals have a specialized population of rhythmically active neurons in their olfactory organs with the potential to peripherally encode temporal information about odor encounters. If these neurons do indeed encode the timing of odor arrivals, it should be possible to demonstrate that this capacity has some functional significance. Here we show how this sensory input can profoundly influence an animal's ability to locate the source of odor cues in realistic turbulent environments-a common task faced by species that rely on olfactory cues for navigation. Using detailed data from a turbulent plume created in the laboratory, we reconstruct the spatiotemporal behavior of a real odor field. We use recurrence theory to show that information about position relative to the source of the odor plume is embedded in the timing between odor pulses. Then, using a parameterized computational model, we show how an animal can use populations of rhythmically active neurons to capture and encode this temporal information in real time, and use it to efficiently navigate to an odor source. Our results demonstrate that the capacity to accurately encode temporal information about sensory cues may be crucial for efficient olfactory navigation. More generally, our results suggest a mechanism for extracting and encoding temporal information from the sensory environment that could have broad utility for neural information processing.

Overview

The claims and statistics of this paper haven’t been checked yet.

Free: it reads the open-access text and checks the first 5 claims that cite a source we can check. Create a free account to check every claim.

A few free checks a day · papers already verified open instantly · results are public

Integrity signals

Registry

Crossref · 10.1371/journal.pcbi.1004682

Cites

Statistics

Figures

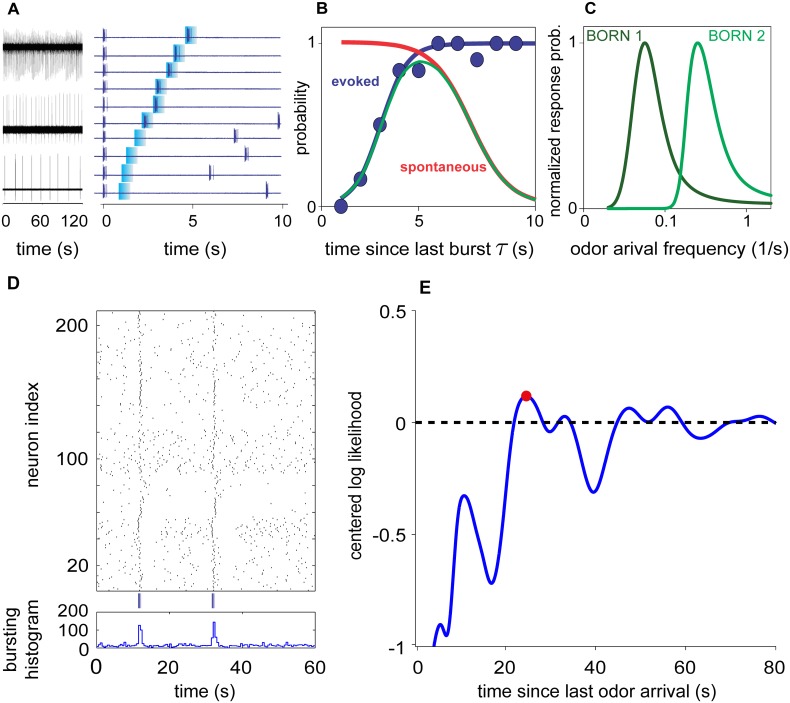
Fig 1 Encoding and decoding time since the last odor encounter from a population of bORNs (experimental data from the spiny lobster Panulirus argus). (A) Electrophysiological recordings of spontaneous bursting from three bORNs with different intrinsic burst frequencies (left), and bursting pattern of a single bORN (right) stimulated with odor (blue marks). Trials aligned in order of increasing time since last burst (bottom to top). Note that bORN does not respond to stimulus when time since last burst is short (bottom 4 trials) and instead, continues to burst spontaneously, (B) Probability of bursting in response to odorant as a function of time since last burst τ. Blue points are electrophysiologial data; blue line is sigmoid fit to data. Red curve represents the probability that the bORN will go τ seconds before bursting spontaneously (1—CDF of spontaneous inter-burst interval). Together, these curves tune the bORN to be most sensitive to odors that arrive with a particular frequency. (C) Probability of bursting in response to a stimulus as a function of stimulus frequency for two bORNs tuned by different evoked and spontaneous burst functions. (D) Raster plot (upper) and burst histogram (lower) of a heterogeneous population of 210 bORNs constructed from multiple single-neuron electrophysiological recordings showing spontaneous bursting and responses to odor stimuli (blue marks). This reconstructed population of bORNs encodes time between two odor stimuli (20.7 s). (E) The time interval between odor stimuli can be decoded from the bursting pattern of a heterogeneous bORN population shown in (D) using a simple maximum likelihood procedure (decoded interval is 23.2 s). Data are from [19].
Fig 1 Encoding and decoding time since the last odor encounter from a population of bORNs (experimental data from the spiny lobster Panulirus argus). (A) Electrophysiological recordings of spontaneous bursting from three bORNs with different intrinsic burst frequencies (left), and bursting pattern of a single bORN (right) stimulated with odor (blue marks). Trials aligned in order of increasing time since last burst (bottom to top). Note that bORN does not respond to stimulus when time since last burst is short (bottom 4 trials) and instead, continues to burst spontaneously, (B) Probability of bursting in response to odorant as a function of time since last burst τ. Blue points are electrophysiologial data; blue line is sigmoid fit to data. Red curve represents the probability that the bORN will go τ seconds before bursting spontaneously (1—CDF of spontaneous inter-burst interval). Together, these curves tune the bORN to be most sensitive to odors that arrive with a particular frequency. (C) Probability of bursting in response to a stimulus as a function of stimulus frequency for two bORNs tuned by different evoked and spontaneous burst functions. (D) Raster plot (upper) and burst histogram (lower) of a heterogeneous population of 210 bORNs constructed from multiple single-neuron electrophysiological recordings showing spontaneous bursting and responses to odor stimuli (blue marks). This reconstructed population of bORNs encodes time between two odor stimuli (20.7 s). (E) The time interval between odor stimuli can be decoded from the bursting pattern of a heterogeneous bORN population shown in (D) using a simple maximum likelihood procedure (decoded interval is 23.2 s). Data are from [19].CC BY · PubMed Central
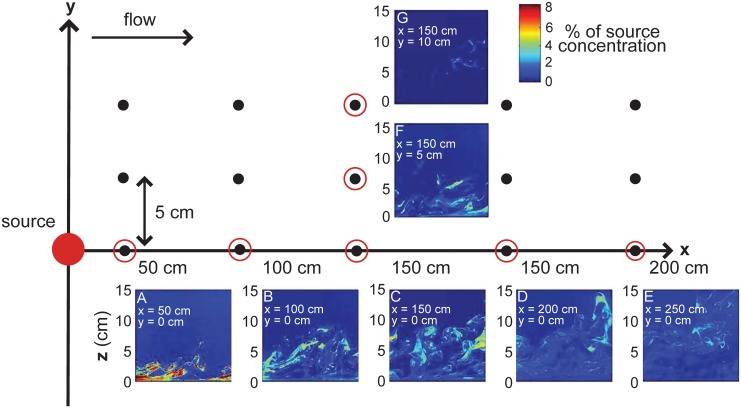
Fig 2 Odor plume PLIF videos taken at 15 locations. Instantaneous odor concentration (expressed as % of source concentration) at (A) x = 50 cm, (B) x = 100 cm, (C) x = 150 cm, (D) x = 200 cm, (E) x = 250 cm from the source along the odor plume centerline, and (F) y = 5 cm, (G) y = 10 cm from the odor plume centerline at x = 150 cm.
Fig 2 Odor plume PLIF videos taken at 15 locations. Instantaneous odor concentration (expressed as % of source concentration) at (A) x = 50 cm, (B) x = 100 cm, (C) x = 150 cm, (D) x = 200 cm, (E) x = 250 cm from the source along the odor plume centerline, and (F) y = 5 cm, (G) y = 10 cm from the odor plume centerline at x = 150 cm.CC BY · PubMed Central
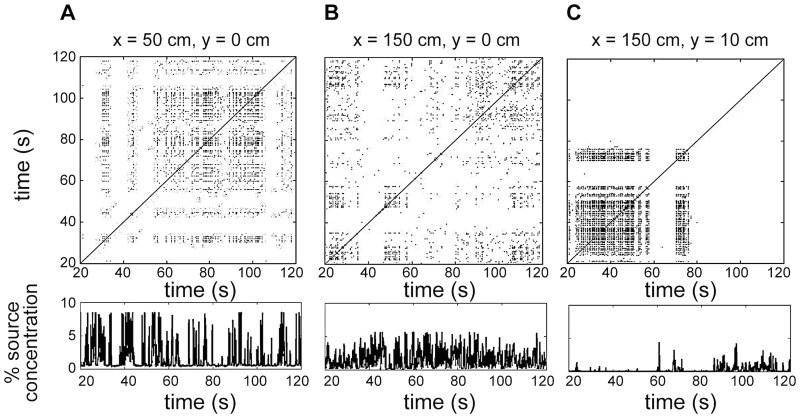
Fig 3 Recurrence plots (upper panels) and corresponding concentration time series (lower panels) for selected locations in the plume: (A) x = 50 cm, (B) x = 150 cm from the source along the plume centerline, and (C) y = 10 cm from the centerline at x = 150 cm, where height is 2.5 cm from the substratum. Black points in the recurrence plots indicate that recurrence occurs; white regions indicate that recurrence does not occur (see Results).
Fig 3 Recurrence plots (upper panels) and corresponding concentration time series (lower panels) for selected locations in the plume: (A) x = 50 cm, (B) x = 150 cm from the source along the plume centerline, and (C) y = 10 cm from the centerline at x = 150 cm, where height is 2.5 cm from the substratum. Black points in the recurrence plots indicate that recurrence occurs; white regions indicate that recurrence does not occur (see Results).CC BY · PubMed Central
Fig 4 Recurrence time and position in the plume. (A) Example trajectory in reconstructed phase space. Two types of recurrence time index are obtained by averaging time intervals between all successive recurrent points (T¯1) or only returning points (T¯2) in a circle of radius r centered at a reference point x 0. To estimate T¯1, the refractory period of at least some bORNs in the population would need to be short relative to the times between successive recurrence points. T¯2 can be estimated with longer refractory periods. (B) Mean (points) and standard deviation of T¯1 and T¯2 indices for positions in downstream direction. (C) Mean and standard deviation of T¯1 and T¯2 indices for positions in cross-stream direction.
Fig 4 Recurrence time and position in the plume. (A) Example trajectory in reconstructed phase space. Two types of recurrence time index are obtained by averaging time intervals between all successive recurrent points (T¯1) or only returning points (T¯2) in a circle of radius r centered at a reference point x 0. To estimate T¯1, the refractory period of at least some bORNs in the population would need to be short relative to the times between successive recurrence points. T¯2 can be estimated with longer refractory periods. (B) Mean (points) and standard deviation of T¯1 and T¯2 indices for positions in downstream direction. (C) Mean and standard deviation of T¯1 and T¯2 indices for positions in cross-stream direction.CC BY · PubMed Central
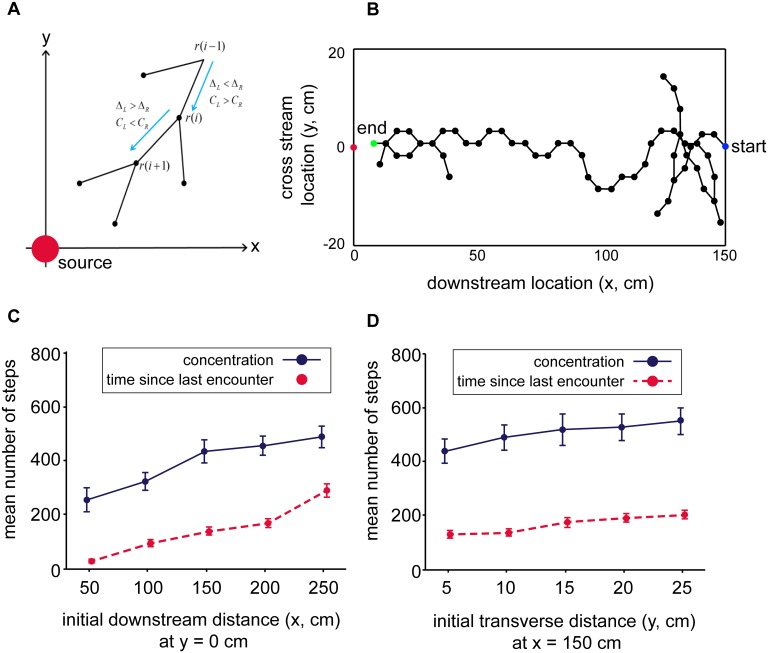
Fig 5 Search strategy using bORNs or measurements of concentration. (A) Search strategy based on a pair of sensors. The searcher compares measurements of the time since the last odor arrival, Δ, or measurements of concentration, C, registered by left and right sensors and steers in the direction of the shorter time or higher concentration. (B) Example trajectory of bORN-based strategy (initial position is x = 150 cm, y = 0 cm). The searcher begins at the “start” point and stops at the “end” point. The trajectory is continuous, with decisions made at every dot. Points that end outside the plume indicate that the searcher backtracks to its previous position. (C, D) Mean and standard error for number of steps required for strategies based on measurements of concentration (blue) and time since last encounter (bORN strategy, red) as a function of starting location relative to the source.
Fig 5 Search strategy using bORNs or measurements of concentration. (A) Search strategy based on a pair of sensors. The searcher compares measurements of the time since the last odor arrival, Δ, or measurements of concentration, C, registered by left and right sensors and steers in the direction of the shorter time or higher concentration. (B) Example trajectory of bORN-based strategy (initial position is x = 150 cm, y = 0 cm). The searcher begins at the “start” point and stops at the “end” point. The trajectory is continuous, with decisions made at every dot. Points that end outside the plume indicate that the searcher backtracks to its previous position. (C, D) Mean and standard error for number of steps required for strategies based on measurements of concentration (blue) and time since last encounter (bORN strategy, red) as a function of starting location relative to the source.CC BY · PubMed Central

Verification

Claims the paper makes

The claims and statistics of this paper haven’t been checked yet.

Free: it reads the open-access text and checks the first 5 claims that cite a source we can check. Create a free account to check every claim.

A few free checks a day · papers already verified open instantly · results are public

Claims other papers make about this one

Each is checked against this paper’s own text: does it say what the citing paper says it does?

Self-check

Percentages, sums and reported differences re-computed from the paper’s own numbers.

The self-check needs the paper’s full text.

Citations

The citation lists are queued

They are fetched later and appear here then.

References 61 · Cited by 50

Metadata

Authors
Park, I. J., Hein, A. M., Bobkov, Y. V., Reidenbach, M. A., Ache, B. W., & Principe, J. C.
Affiliations
  • University of Florida (US)
  • Princeton University (US)
  • University of Virginia (US)
Corresponding author
Hein, Andrew M.
Venue
PLOS Computational Biology
Published
2016-01-05
Volume
12
Issue
1
Pages
e1004682
ISSN
  • 1553-734X (ISSN-L)
  • 1553-7358
OpenAlex
W2223994108
Cited by
50
References
61
Citations by year
2026: 1 · 2025: 10 · 2024: 7 · 2023: 3 · 2022: 5 · 2021: 7 · 2020: 6 · 2019: 2 · 2018: 4 · 2017: 2 · 2016: 3
FWCI
3.96
Type
journal article
Language
en
Open access
Locations
  • PLoS Computational Biology (publishedVersion, cc-by)
  • PubMed Central (publishedVersion, cc-by)
  • PubMed (publishedVersion)
  • RePEc: Research Papers in Economics (submittedVersion)
  • DOAJ (DOAJ: Directory of Open Access Journals) (submittedVersion, cc-by-sa)
  • Figshare (submittedVersion, cc-by)
Funders
  • James S. McDonnell Foundation
  • Adolph C. and Mary Sprague Miller Institute for Basic Research in Science, University of California Berkeley
  • National Institutes of Health (UL1TR001427)
  • UC Berkeley College of Chemistry
  • National Institute on Deafness and Other Communication Disorders (R21DC011859, DC011859)
  • National Center for Advancing Translational Sciences
Topics
  • Life Sciences › Agricultural and Biological Sciences › Insect Science › Insect Pheromone Research and Control
  • Life Sciences › Neuroscience › Cellular and Molecular Neuroscience › Neurobiology and Insect Physiology Research
  • Life Sciences › Neuroscience › Sensory Systems › Olfactory and Sensory Function Studies
Keywords
olfactory navigation, temporal coding, olfactory epithelium, odor plumes, odor source localization, recurrence analysis, temporal information extraction
MeSH terms
Animals, Appetitive Behavior, Models, Neurological, Odorants, Smell, Olfactory Receptor Neurons, Computational Biology

About these checks

Registry, retraction, Cites and statistics results are computed, not judged, with one exception: a printed reference that no index lists is read once by a model before it counts as a citation error. Claims are extracted by a model and kept only when their quote appears verbatim in the text; each cited source is then checked, with a model’s help, for whether it says what the claim relies on. Those verdicts can be wrong — read the claim’s quote and the cited source before relying on one.

Statistics and arithmetic are recomputed, not judged.

Confidence bands are shown only for fields calibrated on our annotated test set. None is calibrated yet, so no band is shown.

What counts as a claim ›How we measure confidence ›How we check this ›

Are you an author, or do you see a problem with this page? Request a review

How to cite

Cite CoChat for the checks on this page, and the paper for its own findings.

This page
CoChat. (2026). Citation check: Neurally Encoding Time for Olfactory Navigation. https://app.cochat.ai/papers/10.1371/journal.pcbi.1004682
The paper
Park, I. J., Hein, A. M., Bobkov, Y. V., Reidenbach, M. A., Ache, B. W., & Principe, J. C. (2016). Neurally Encoding Time for Olfactory Navigation. PLOS Computational Biology. https://doi.org/10.1371/journal.pcbi.1004682

Data sources

Bibliographic data: Semantic Scholar, OpenAlex, Crossref.

Contains information from the Semantic Scholar Academic Graph Datasets, made available under the ODC Attribution License (ODC-BY 1.0).

Semantic Scholar’s data is described in: Kinney, R., et al. (2023). The Semantic Scholar Open Data Platform. arXiv:2301.10140.