

Are there physicochemical differences between allosteric and competitive ligands?
Open accessThe DOI matches its Crossref record; 45 of the 45 references it cites were found in a registry or an index.
Abstract
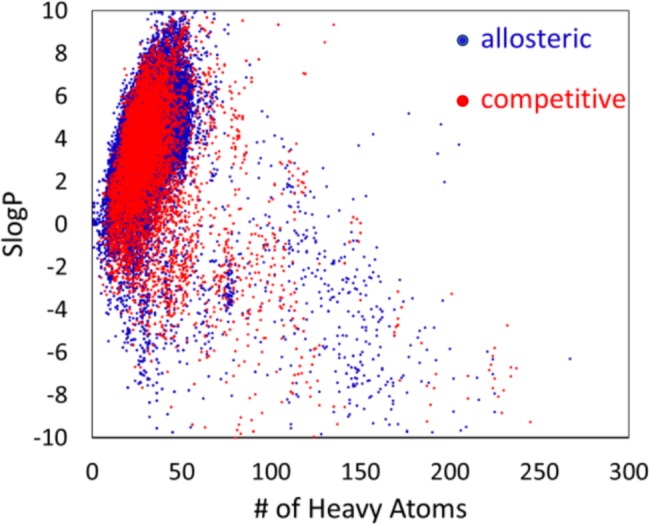
Previous studies have compared the physicochemical properties of allosteric compounds to non-allosteric compounds. Those studies have found that allosteric compounds tend to be smaller, more rigid, more hydrophobic, and more drug-like than non-allosteric compounds. However, previous studies have not properly corrected for the fact that some protein targets have much more data than other systems. This generates concern regarding the possible skew that can be introduced by the inherent bias in the available data. Hence, this study aims to determine how robust the previous findings are to the addition of newer data. This study utilizes the Allosteric Database (ASD v3.0) and ChEMBL v20 to systematically obtain large datasets of both allosteric and competitive ligands. This dataset contains 70,219 and 9,511 unique ligands for the allosteric and competitive sets, respectively. Physically relevant compound descriptors were computed to examine the differences in their chemical properties. Particular attention was given to removing redundancy in the data and normalizing across ligand diversity and varied protein targets. The resulting distributions only show that allosteric ligands tend to be more aromatic and rigid and do not confirm the increase in hydrophobicity or difference in drug-likeness. These results are robust across different normalization schemes.
Overview
The claims and statistics of this paper haven’t been checked yet.
Free: it reads the open-access text and checks the first 5 claims that cite a source we can check. Create a free account to check every claim.
Integrity signals
Registry
Cites
Statistics
Figures




Verification
Claims the paper makes
The claims and statistics of this paper haven’t been checked yet.
Free: it reads the open-access text and checks the first 5 claims that cite a source we can check. Create a free account to check every claim.
Claims other papers make about this one
Each is checked against this paper’s own text: does it say what the citing paper says it does?
The check wasn’t confident either way, so it gives no verdict — never disputed.
In the citing paper
“However, non-covalent PPI inhibitors may have the ability to cause “off-target” effects due to binding to other molecules [114–116].”
From The design and development of covalent protein-protein interaction inhibitors for cancer treatment (2020) · cites this paper as [116]
Experimental — accuracy not yet measured
Self-check
Percentages, sums and reported differences re-computed from the paper’s own numbers.
The self-check needs the paper’s full text.
Citations
Cites
R: A Language and Environment for Statistical Computing
R Core Team (2025) · doi:10.32614/r.manuals · Cited by 352,181
Individual Comparisons by Ranking Methods
Wilcoxon, F. (1945) · Biometrics Bulletin · doi:10.2307/3001968 · Cited by 15,354
On the nature of allosteric transitions: A plausible model
Monod, J., Wyman, J., & Changeux, J.-P. (1965) · Journal of Molecular Biology · doi:10.1016/s0022-2836(65)80285-6 · Cited by 8,825
Extended-Connectivity Fingerprints
Rogers, D., & Hahn, M. (2010) · Journal of Chemical Information and Modeling · doi:10.1021/ci100050t · Cited by 7,524
ChEMBL: a large-scale bioactivity database for drug discovery
Gaulton, A., Bellis, L. J., Bento, A. P., Chambers, J., Davies, M., Hersey, A., Light, Y., McGlinchey, S., Michalovich, D., Al-Lazikani, B., et al. (2012) · Nucleic Acids Research · doi:10.1093/nar/gkr777 · Cited by 4,382
Rapid and sensitive protein similarity searches
Lipman, D. J., & Pearson, W. R. (1985) · Science · doi:10.1126/science.2983426 · Cited by 4,033
DrugBank: a comprehensive resource for in silico drug discovery and exploration
Wishart, D. S. (2006) · Nucleic Acids Research · doi:10.1093/nar/gkj067 · Cited by 3,892
DrugBank: a knowledgebase for drugs, drug actions and drug targets
Wishart, D. S., Knox, C., Guo, A. C., Cheng, D., Shrivastava, S., Tzur, D., Gautam, B., & Hassanali, M. (2008) · Nucleic Acids Research · doi:10.1093/nar/gkm958 · Cited by 2,861
DrugBank 3.0: a comprehensive resource for 'Omics' research on drugs
Knox, C., Law, V., Jewison, T., Liu, P., Ly, S., Frolkis, A., Pon, A., Banco, K., Mak, C., Neveu, V., et al. (2011) · Nucleic Acids Research · doi:10.1093/nar/gkq1126 · Cited by 1,831
Predicting new molecular targets for known drugs
Keiser, M. J., Setola, V., Irwin, J. J., Laggner, C., Abbas, A. I., Hufeisen, S. J., Jensen, N. H., Kuijer, M. B., Matos, R. C., Tran, T. B., et al. (2009) · Nature · doi:10.1038/nature08506 · Cited by 1,667
Research works printed but not linked: 1
- Lu J, Carlson HA. ChemTreeMap: An Interactive Map of Biochemical Similarity in Molecular Datasets. Bioinformatics. 2016; 32(23): 3584– 92. doi: 10.1093/bioinformatics/btw523 27515740 PMC5181537 · DOI
Cited by
G protein-coupled receptors (GPCRs): advances in structures, mechanisms and drug discovery
Zhang, M., Chen, T., Lu, X., Lan, X., Chen, Z., & Lu, S. (2024) · Signal Transduction and Targeted Therapy · doi:10.1038/s41392-024-01803-6 · Cited by 491
“20 25 Allosteric modulators are highlighted for their high subtype selectivity and low side effects.”
BackgroundAllosteric Modulator Discovery: From Serendipity to Structure-Based Design
Lu, S., He, X., Ni, D., & Zhang, J. (2019) · Journal of Medicinal Chemistry · doi:10.1021/acs.jmedchem.8b01749 · Cited by 169
Lu, S., Shen, Q., & Zhang, J. (2019) · Accounts of Chemical Research · doi:10.1021/acs.accounts.8b00570 · Cited by 166
Ni, D., Lu, S., & Zhang, J. (2019) · Medicinal Research Reviews · doi:10.1002/med.21585 · Cited by 116
Integrated Computational Approaches and Tools for Allosteric Drug Discovery
Amamuddy, O. S., Veldman, W., Manyumwa, C. V., Khairallah, A., Agajanian, S., Odeyemi, O., Verkhivker, G. M., & Bishop, Ö. T. (2020) · International Journal of Molecular Sciences · doi:10.3390/ijms21030847 · Cited by 118
“A study by Smith and colleagues hinted at the higher rigidity and aromaticity of allosteric modulators [121], thus providing an additional criterion for selecting modulators that are more likely to bind to an allosteric site.”
Background
Metadata
- Authors
- Smith, R. D., Lu, J., & Carlson, H. A.
- Affiliations
- University of Michigan (US)
- Corresponding author
- Carlson, Heather A.
- Venue
- PLOS Computational Biology
- Publisher
- Public Library of Science (PLoS)
- Published
- 2017-11-10
- Volume
- 13
- Issue
- 11
- Pages
- e1005813
- ISSN
- 1553-734X (ISSN-L)
- 1553-7358
- PMC
- PMC5699844
- OpenAlex
- W2767883384
- Cited by
- 27
- References
- 45
- Citations by year
- 2026: 2 · 2025: 1 · 2024: 2 · 2023: 2 · 2022: 6 · 2021: 4 · 2020: 4 · 2019: 5 · 2018: 1
- FWCI
- 2.05
- Type
- journal article
- Language
- en
- Update notices
- new_version (2017-11-22)
- Open access
- gold
- doi.org
- Licence
- Locations
- PLoS Computational Biology (publishedVersion, cc-by)
- PubMed Central (publishedVersion, cc-by)
- PubMed (publishedVersion)
- RePEc: Research Papers in Economics (submittedVersion)
- DOAJ (DOAJ: Directory of Open Access Journals) (submittedVersion, cc-by-sa)
- Figshare (submittedVersion, cc-by)
- Funders
- Ministry of Earth Sciences
- Ministry of Education, India
- Topics
- Life Sciences › Pharmacology, Toxicology and Pharmaceutics › Drug Discovery › Computational Drug Discovery Methods
- Life Sciences › Biochemistry, Genetics and Molecular Biology › Molecular Biology › Receptor Mechanisms and Signaling
- Life Sciences › Biochemistry, Genetics and Molecular Biology › Molecular Biology › Protein Interaction Studies and Fluorescence Analysis
- Keywords
- allosteric ligands, physicochemical properties, drug-likeness, molecular descriptors, aromaticity, molecular rigidity, hydrophobicity, ChEMBL, data normalization, protein targets
- MeSH terms
- Algorithms, Allosteric Regulation, Allosteric Site, Chemistry, Physical, Ligands, Proteins, Databases, Factual, Computational Biology, Catalytic Domain, Hydrophobic and Hydrophilic Interactions
About these checks
Registry, retraction, Cites and statistics results are computed, not judged, with one exception: a printed reference that no index lists is read once by a model before it counts as a citation error. Claims are extracted by a model and kept only when their quote appears verbatim in the text; each cited source is then checked, with a model’s help, for whether it says what the claim relies on. Those verdicts can be wrong — read the claim’s quote and the cited source before relying on one.
Statistics and arithmetic are recomputed, not judged.
Confidence bands are shown only for fields calibrated on our annotated test set. None is calibrated yet, so no band is shown.
What counts as a claim ›How we measure confidence ›How we check this ›
Are you an author, or do you see a problem with this page? Request a review
Data sources
Bibliographic data: Semantic Scholar, OpenAlex, Crossref.
Contains information from the Semantic Scholar Academic Graph Datasets, made available under the ODC Attribution License (ODC-BY 1.0).
Semantic Scholar’s data is described in: Kinney, R., et al. (2023). The Semantic Scholar Open Data Platform. arXiv:2301.10140.
