

The DOI matches its Crossref record; 91 of the 91 references it cites were found in a registry or an index.
Exportin-mediated nucleocytoplasmic transport maintains Pch2 homeostasis during meiosis
Open accessPublished version of a preprint
Abstract
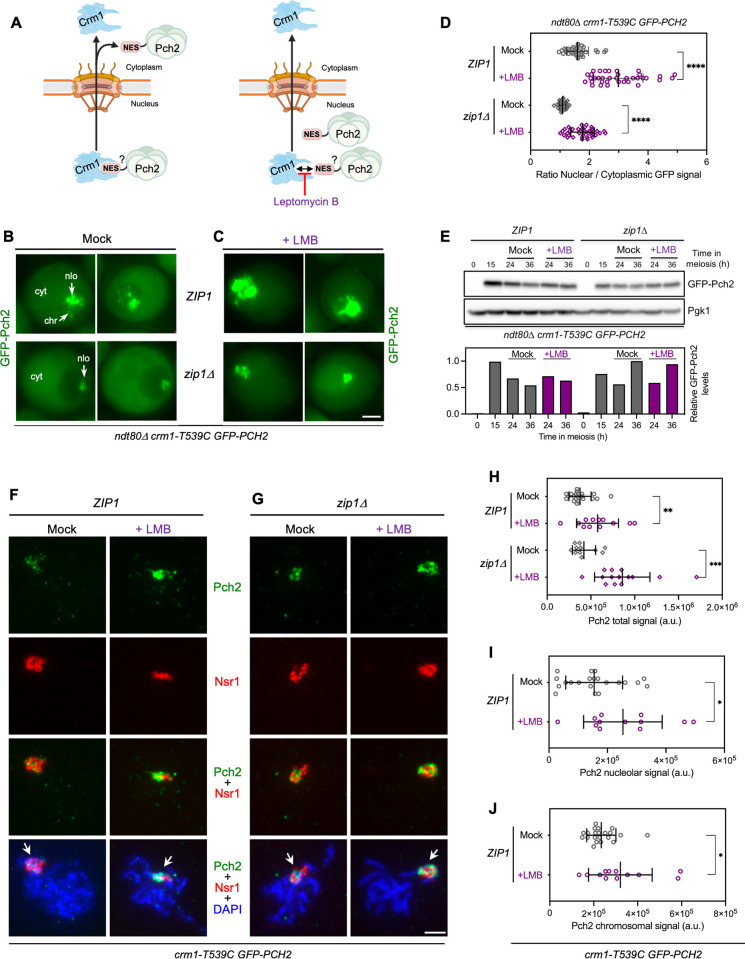
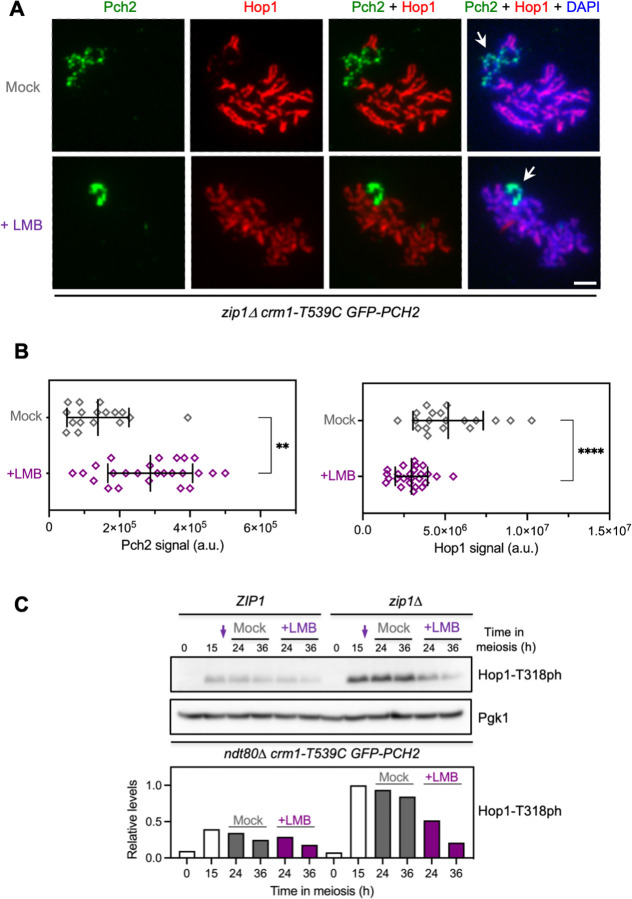
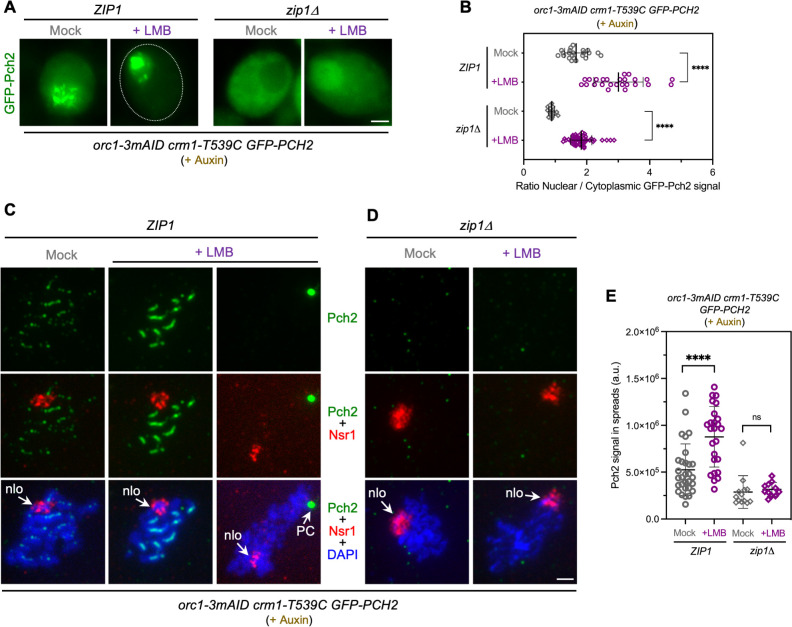
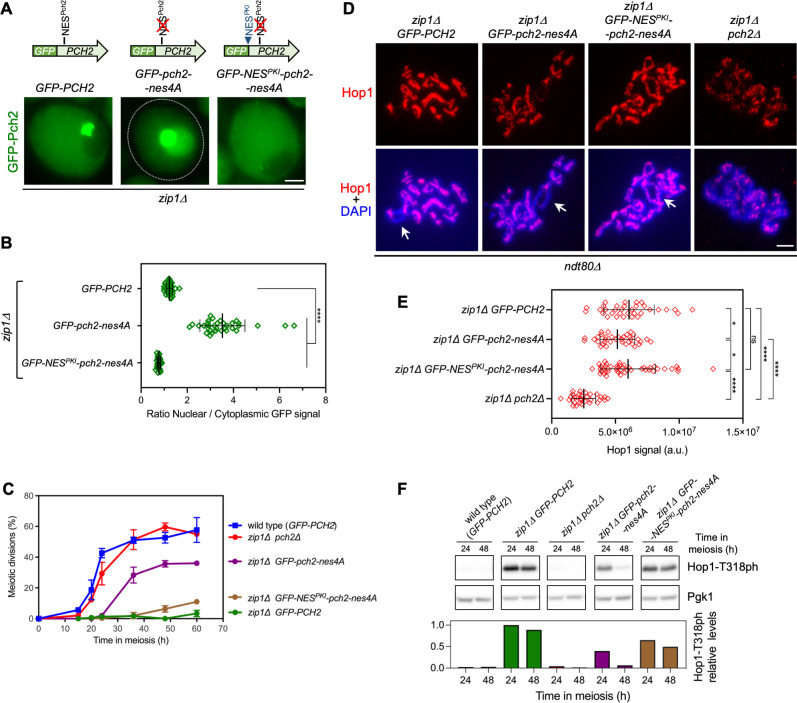
The meiotic recombination checkpoint reinforces the order of events during meiotic prophase I, ensuring the accurate distribution of chromosomes to the gametes. The AAA+ ATPase Pch2 remodels the Hop1 axial protein enabling adequate levels of Hop1-T318 phosphorylation to support the ensuing checkpoint response. While these events are localized at chromosome axes, the checkpoint activating function of Pch2 relies on its cytoplasmic population. In contrast, forced nuclear accumulation of Pch2 leads to checkpoint inactivation. Here, we reveal the mechanism by which Pch2 travels from the cell nucleus to the cytoplasm to maintain Pch2 cellular homeostasis. Leptomycin B treatment provokes the nuclear accumulation of Pch2, indicating that its nucleocytoplasmic transport is mediated by the Crm1 exportin recognizing proteins containing Nuclear Export Signals (NESs). Consistently, leptomycin B leads to checkpoint inactivation and impaired Hop1 axial localization. Pch2 nucleocytoplasmic traffic is independent of its association with Zip1 and Orc1. We also identify a functional NES in the non-catalytic N-terminal domain of Pch2 that is required for its nucleocytoplasmic trafficking and proper checkpoint activity. In sum, we unveil another layer of control of Pch2 function during meiosis involving nuclear export via the exportin pathway that is crucial to maintain the critical balance of Pch2 distribution among different cellular compartments.
Overview
The claims and statistics of this paper haven’t been checked yet.
Run the check — free, no account needed. It reads the open-access text and checks the sources it cites.
Integrity signals
Registry
Cites
Statistics
Figures
Verification
Claims the paper makes
The claims and statistics of this paper haven’t been checked yet.
Run the check — free, no account needed. It reads the open-access text and checks the sources it cites.
Self-check
Percentages, sums and reported differences re-computed from the paper’s own numbers.
The self-check needs the paper’s full text.
Citations
Cites
Fiji: an open-source platform for biological-image analysis
Schindelin, J., Arganda-Carreras, I., Frise, E., Kaynig, V., Longair, M., Pietzsch, T., Preibisch, S., Rueden, C., Saalfeld, S., Schmid, B., et al. (2012) · Nature Methods · doi:10.1038/nmeth.2019 · Cited by 66,890
Highly accurate protein structure prediction with AlphaFold
Jumper, J., Evans, R., Pritzel, A., Green, T., Figurnov, M., Ronneberger, O., Tunyasuvunakool, K., Bates, R., Žídek, A., Potapenko, A., et al. (2021) · Nature · doi:10.1038/s41586-021-03819-2 · Cited by 43,764
A subcellular map of the human proteome
Thul, P. J., Åkesson, L., Wiking, M., Mahdessian, D., Geladaki, A., Ait Blal, H., Alm, T., Asplund, A., Björk, L., Breckels, L. M., et al. (2017) · Science · doi:10.1126/science.aal3321 · Cited by 2,813
Three new dominant drug resistance cassettes for gene disruption in Saccharomyces cerevisiae
Goldstein, A. L., & McCusker, J. H. (1999) · Yeast · doi:10.1002/(sici)1097-0061(199910)15:14<1541::aid-yea476>3.0.co;2-k · Cited by 1,820
Identification of a signal for rapid export of proteins from the nucleus
Wen, W., Meinkotht, J. L., Tsien, R. Y., & Taylor, S. S. (1995) · Cell · doi:10.1016/0092-8674(95)90435-2 · Cited by 1,190
AAA+ proteins: have engine, will work
Hanson, P. I., & Whiteheart, S. W. (2005) · Nature Reviews Molecular Cell Biology · doi:10.1038/nrm1684 · Cited by 1,174
Exportin 1 (Crm1p) Is an Essential Nuclear Export Factor
Stade, K., Ford, C. S., Guthrie, C., & Weis, K. (1997) · Cell · doi:10.1016/s0092-8674(00)80370-0 · Cited by 1,141
Recombination, Pairing, and Synapsis of Homologs during Meiosis
Zickler, D., & Kleckner, N. (2015) · Cold Spring Harbor Perspectives in Biology · doi:10.1101/cshperspect.a016626 · Cited by 799
Meiotic Recombination: The Essence of Heredity
Hunter, N. (2015) · Cold Spring Harbor Perspectives in Biology · doi:10.1101/cshperspect.a016618 · Cited by 780
Tools for integrated sequence-structure analysis with UCSF Chimera
Meng, E. C., Pettersen, E. F., Couch, G. S., Huang, C. C., & Ferrin, T. E. (2006) · BMC Bioinformatics · doi:10.1186/1471-2105-7-339 · Cited by 732
Klein, F., Mahr, P., Galova, M., Buonomo, S. B. C., Michaelis, C., Nairz, K., & Nasmyth, K. (1999) · Cell · doi:10.1016/s0092-8674(00)80609-1 · Cited by 730
ZIP1 is a synaptonemal complex protein required for meiotic chromosome synapsis
Sym, M., Engebrecht, J., & Roeder, G. S. (1993) · Cell · doi:10.1016/0092-8674(93)90114-6 · Cited by 598
Crossover Homeostasis in Yeast Meiosis
Martini, E. M.-D., Diaz, R. L., Hunter, N. M., & Keeney, S. (2006) · Cell · doi:10.1016/j.cell.2006.05.044 · Cited by 368
The HOP1 gene encodes a meiosis-specific component of yeast chromosomes
Hollingsworth, N. M., Goetsch, L., & Byers, B. (1990) · Cell · doi:10.1016/0092-8674(90)90216-2 · Cited by 326
The Yeast Red1 Protein Localizes to the Cores of Meiotic Chromosomes
Smith, A. V., & Roeder, G. S. (1997) · The Journal of Cell Biology · doi:10.1083/jcb.136.5.957 · Cited by 322
Crossover interference is abolished in the absence of a synaptonemal complex protein
Sym, M. (1994) · Cell · doi:10.1016/0092-8674(94)90197-x · Cited by 290
Carballo, J. A., Johnson, A. L., Sedgwick, S. G., & Cha, R. S. (2008) · Cell · doi:10.1016/j.cell.2008.01.035 · Cited by 290
Self-citationPch2 Links Chromatin Silencing to Meiotic Checkpoint Control
San-Segundo, P. A., & Roeder, G. S. (1999) · Cell · doi:10.1016/s0092-8674(00)80741-2 · Cited by 274
Self-citationNES consensus redefined by structures of PKI-type and Rev-type nuclear export signals bound to CRM1
Güttler, T., Madl, T., Neumann, P., Deichsel, D., Corsini, L., Monecke, T., Ficner, R., Sattler, M., & Görlich, D. (2010) · Nature Structural & Molecular Biology · doi:10.1038/nsmb.1931 · Cited by 270
Self-Organization of Meiotic Recombination Initiation: General Principles and Molecular Pathways
Keeney, S., Lange, J., & Mohibullah, N. (2014) · Annual Review of Genetics · doi:10.1146/annurev-genet-120213-092304 · Cited by 266
Partner Choice during Meiosis Is Regulated by Hop1-promoted Dimerization of Mek1
Niu, H., Wan, L., Baumgartner, B. L., Schaefer, D., Loidl, J., & Hollingsworth, N. M. (2005) · Molecular Biology of the Cell · doi:10.1091/mbc.e05-05-0465 · Cited by 248
The molecular principles governing the activity and functional diversity of AAA+ proteins
Puchades, C., Sandate, C. R., & Lander, G. C. (2019) · Nature Reviews Molecular Cell Biology · doi:10.1038/s41580-019-0183-6 · Cited by 244
A Conserved Checkpoint Monitors Meiotic Chromosome Synapsis in Caenorhabditis elegans
Bhalla, N., & Dernburg, A. F. (2005) · Science · doi:10.1126/science.1117468 · Cited by 227
Roig, I., Dowdle, J. A., Tóth, A., de Rooij, D. G., Jasin, M., & Keeney, S. (2010) · PLoS Genetics · doi:10.1371/journal.pgen.1001062 · Cited by 203
Li, X., & Schimenti, J. C. (2007) · PLoS Genetics · doi:10.1371/journal.pgen.0030130 · Cited by 202
Nuclear export inhibition through covalent conjugation and hydrolysis of Leptomycin B by CRM1
Sun, Q., Carrasco, Y. P., Hu, Y., Guo, X., Mirzaei, H., MacMillan, J. B., & Chook, Y. M. (2013) · Proceedings of the National Academy of Sciences · doi:10.1073/pnas.1217203110 · Cited by 198
The NES–Crm1p export pathway is not a major mRNA export route in Saccharomyces cerevisiae
Neville, M. C., & Rosbash, M. (1999) · The EMBO Journal · doi:10.1093/emboj/18.13.3746 · Cited by 191
The Meiotic Checkpoint Network: Step-by-Step through Meiotic ProphasePreprint
Subramanian, V. V., & Hochwagen, A. (2014) · Cold Spring Harbor Perspectives in Biology · doi:10.1101/cshperspect.a016675 · Cited by 188
LocNES: a computational tool for locating classical NESs in CRM1 cargo proteins
Xu, D., Marquis, K., Pei, J., et al. (2014) · Bioinformatics · doi:10.1093/bioinformatics/btu826 · Cited by 185
Role for the Silencing Protein Dot1 in Meiotic Checkpoint Control
San-Segundo, P. A., & Roeder, G. S. (2000) · Molecular Biology of the Cell · doi:10.1091/mbc.11.10.3601 · Cited by 179
Self-citationTRIP13 is a protein-remodeling AAA+ ATPase that catalyzes MAD2 conformation switching
Ye, Q., Rosenberg, S., Moeller, A., Speir, J. A., Su, T. Y., & Corbett, K. D. (2015) · eLife · doi:10.7554/elife.07367 · Cited by 176
Regulation of Meiotic Recombination via Mek1-Mediated Rad54 Phosphorylation
Niu, H., Wan, L., Busygina, V., Kwon, Y., Allen, J. J., Li, X., Kunz, R. C., Kubota, K., Wang, B., Sung, P., et al. (2009) · Molecular Cell · doi:10.1016/j.molcel.2009.09.029 · Cited by 164
Meiosis: the chromosomal foundation of reproduction
Bolcun‐Filas, E., & Handel, M. A. (2018) · Biology of Reproduction · doi:10.1093/biolre/ioy021 · Cited by 164
Wang, K., Sturt-Gillespie, B., Hittle, J. C., Macdonald, D., Chan, G. K. T., Yen, T. J., & Liu, S. (2014) · Journal of Biological Chemistry · doi:10.1074/jbc.m114.585315 · Cited by 152
Börner, G. V., Barot, A., & Kleckner, N. E. (2008) · Proceedings of the National Academy of Sciences · doi:10.1073/pnas.0711864105 · Cited by 151
Biallelic TRIP13 mutations predispose to Wilms tumor and chromosome missegregation
Yost, S. E., de Wolf, B., Hanks, S., Zachariou, A., Marcozzi, C., Clarke, M., de Voer, R. M., Etemad, B., Uijttewaal, E. C. H., Ramsay, E., et al. (2017) · Nature Genetics · doi:10.1038/ng.3883 · Cited by 151
Joshi, N., Barot, A., Jamison, C., & Börner, G. V. (2009) · PLoS Genetics · doi:10.1371/journal.pgen.1000557 · Cited by 138
Zhang, Z., Li, B., Fu, J., Li, R., Diao, F., Li, C., Chen, B., Du, J., Zhou, Z., Mu, J., et al. (2020) · The American Journal of Human Genetics · doi:10.1016/j.ajhg.2020.05.001 · Cited by 131
Organization of the Yeast Zip1 Protein within the Central Region of the Synaptonemal Complex
Dong, H. H., & Roeder, G. S. (2000) · The Journal of Cell Biology · doi:10.1083/jcb.148.3.417 · Cited by 129
Mechanism for remodelling of the cell cycle checkpoint protein MAD2 by the ATPase TRIP13
Alfieri, C., Chang, L., & Barford, D. (2018) · Nature · doi:10.1038/s41586-018-0281-1 · Cited by 127
Eytan, E., Wang, K., Miniowitz-Shemtov, S., Sitry-Shevah, D., Kaisari, S., Yen, T. J., Liu, S., & Hershko, A. (2014) · Proceedings of the National Academy of Sciences · doi:10.1073/pnas.1412901111 · Cited by 125
Red1p, a MEK1-dependent Phosphoprotein That Physically Interacts with Hop1p during Meiosis in Yeast
Santos, T. D. L., & Hollingsworth, N. M. (1999) · Journal of Biological Chemistry · doi:10.1074/jbc.274.3.1783 · Cited by 121
Arabidopsis PCH2 Mediates Meiotic Chromosome Remodeling and Maturation of Crossovers
Lambing, C., Osman, K., Komsun, N., West, A., Higgins, J. D., Copenhaver, G. P., Yang, J., Armstrong, S. J., Mechtler, K., Roitinger, E., et al. (2015) · PLoS Genetics · doi:10.1371/journal.pgen.1005372 · Cited by 114
Protection of repetitive DNA borders from self-induced meiotic instability
Vader, G., Blitzblau, H. G., Tame, M. A., Falk, J. E., Curtin, L., & Hochwagen, A. (2011) · Nature · doi:10.1038/nature10331 · Cited by 108
Joshi, N., Brown, M. S., Bishop, D. K., & Börner, G. V. (2015) · Molecular Cell · doi:10.1016/j.molcel.2014.12.027 · Cited by 108
Nuclear export receptor CRM1 recognizes diverse conformations in nuclear export signals
Fung, H. Y. J., Fu, S.-C., & Chook, Y. M. (2017) · eLife · doi:10.7554/elife.23961 · Cited by 99
Humphryes, N., Leung, W., Argunhan, B., Terentyev, Y., Dvořáčková, M., & Tsubouchi, H. (2013) · PLoS Genetics · doi:10.1371/journal.pgen.1003194 · Cited by 98
Pch2TRIP13: controlling cell division through regulation of HORMA domains
Vader, G. (2015) · Chromosoma · doi:10.1007/s00412-015-0516-y · Cited by 96
Joyce, E. F., & McKim, K. S. (2008) · Genetics · doi:10.1534/genetics.108.093112 · Cited by 96
Chromosome Synapsis Alleviates Mek1-Dependent Suppression of Meiotic DNA Repair
Subramanian, V. V., MacQueen, A. J., Vader, G., Shinohara, M., Sanchez, A., Borde, V., Shinohara, A., & Hochwagen, A. (2016) · PLoS Biology · doi:10.1371/journal.pbio.1002369 · Cited by 93
Mek1 Down Regulates Rad51 Activity during Yeast Meiosis by Phosphorylation of Hed1
Callender, T. L., Laureau, R., Wan, L., Chen, X., Sandhu, R., Laljee, S., Zhou, S., Suhandynata, R. T., Prugar, E., Gaines, W. A., et al. (2016) · PLoS Genetics · doi:10.1371/journal.pgen.1006226 · Cited by 92
The AAA+ ATPase TRIP13 remodels HORMA domains through N‐terminal engagement and unfolding
Ye, Q., Kim, D. H., Dereli, I., Rosenberg, S., Hagemann, G., Herzog, F., Tóth, A., Cleveland, D. W., & Corbett, K. D. (2017) · The EMBO Journal · doi:10.15252/embj.201797291 · Cited by 91
Pch2 is a hexameric ring ATPase that remodels the chromosome axis protein Hop1
Chen, C., Jomaa, A., Ortega, J., & Alani, E. E. (2013) · Proceedings of the National Academy of Sciences · doi:10.1073/pnas.1310755111 · Cited by 88
Pachytene Exit Controlled by Reversal of Mek1-Dependent Phosphorylation
Bailis, J. M., & Roeder, G. S. (2000) · Cell · doi:10.1016/s0092-8674(00)80831-4 · Cited by 83
West, A. M. V., Komives, E. A., & Corbett, K. D. (2017) · Nucleic Acids Research · doi:10.1093/nar/gkx1196 · Cited by 80
Zanders, S. E., & Alani, E. (2009) · PLoS Genetics · doi:10.1371/journal.pgen.1000571 · Cited by 65
Subramanian, V. V., Zhu, X., Markowitz, T. E., Vale-Silva, L. A., San-Segundo, P. A., Hollingsworth, N. M., Keeney, S., & Hochwagen, A. (2019) · Nature Communications · doi:10.1038/s41467-019-08875-x · Cited by 62
Self-citationOntoso, D., Acosta, I., van Leeuwen, F., Freire, R., & San-Segundo, P. A. (2013) · PLoS Genetics · doi:10.1371/journal.pgen.1003262 · Cited by 61
Self-citationTipton, A. R., Wang, K., Oladimeji, P. O., Sufi, S., Gu, Z., & Liu, S. (2012) · BMC Cell Biology · doi:10.1186/1471-2121-13-15 · Cited by 60
Hollingsworth, N. M., & Gaglione, R. (2019) · Current Genetics · doi:10.1007/s00294-019-00937-3 · Cited by 54
Stuckey, S., Mukherjee, K., & Storici, F. (2011) · Methods in molecular biology · doi:10.1007/978-1-61779-129-1_11 · Cited by 49
Yang, C., Hu, B., Portheine, S. M., Chuenban, P., & Schnittger, A. (2020) · Nucleic Acids Research · doi:10.1093/nar/gkaa527 · Cited by 48
Chen, X., Gaglione, R., Leong, T., Bednor, L., Santos, T. D. L., Luk, E., Airola, M. V., & Hollingsworth, N. M. (2018) · PLoS Genetics · doi:10.1371/journal.pgen.1007832 · Cited by 47
The Ddc2/ATRIP checkpoint protein monitors meiotic recombination intermediates
Refolio, E., Cavero, S. C., Marcon, E., Freire, R., & San-Segundo, P. A. (2011) · Journal of Cell Science · doi:10.1242/jcs.081711 · Cited by 44
Self-citationCOMET Functions as a PCH2 Cofactor in Regulating the HORMA Domain Protein ASY1
Balboni, M., Yang, C., Komaki, S., Brun, J., & Schnittger, A. (2020) · Current Biology · doi:10.1016/j.cub.2020.07.089 · Cited by 43
Homeostatic Control of Meiotic Prophase Checkpoint Function by Pch2 and Hop1
Raina, V. B., & Vader, G. (2020) · Current Biology · doi:10.1016/j.cub.2020.08.064 · Cited by 41
Herruzo, E., Ontoso, D., González-Arranz, S., Cavero, S. C., Lechuga, A., & San-Segundo, P. A. (2016) · Nucleic Acids Research · doi:10.1093/nar/gkw506 · Cited by 37
Self-citationPenedos, A. R., Johnson, A. L., Strong, E., Goldman, A. S. H., Carballo, J. A., & Cha, R. S. (2015) · PLoS ONE · doi:10.1371/journal.pone.0134297 · Cited by 36
Self-citationFarmer, S., Hong, E.-J. E., Leung, W., Argunhan, B., Terentyev, Y., Humphryes, N., Toyoizumi, H., & Tsubouchi, H. (2012) · PLoS ONE · doi:10.1371/journal.pone.0039724 · Cited by 34
Chromosome Spreading and Immunofluorescence Methods in Saccharomyes cerevisiae
Rockmill, B. (2009) · Methods in molecular biology · doi:10.1007/978-1-60761-103-5_1 · Cited by 34
Pch2 orchestrates the meiotic recombination checkpoint from the cytoplasm
Herruzo, E., Lago-Maciel, A., Baztán, S., Santos, B., Carballo, J. A., & San-Segundo, P. A. (2021) · PLoS Genetics · doi:10.1371/journal.pgen.1009560 · Cited by 34
Self-citationHeldrich, J., Sun, X., Vale-Silva, L. A., Markowitz, T. E., & Hochwagen, A. (2020) · Genetics · doi:10.1534/genetics.120.303060 · Cited by 33
How and Why Chromosomes Interact with the Cytoskeleton during Meiosis
Kim, H. J., Liu, C., & Dernburg, A. F. (2022) · Genes · doi:10.3390/genes13050901 · Cited by 32
Functions and Regulation of Meiotic HORMA-Domain Proteins
Prince, J. P., & Martínez-Pérez, E. (2022) · Genes · doi:10.3390/genes13050777 · Cited by 32
Lee, Y., Pei, J., Baumhardt, J. M., Chook, Y. M., & Grishin, N. V. (2019) · Scientific Reports · doi:10.1038/s41598-019-43004-0 · Cited by 31
SnapShot: Meiosis – Prophase I
Láscarez-Lagunas, L. I., Martínez‐García, M., & Colaiácovo, M. P. (2020) · Cell · doi:10.1016/j.cell.2020.04.038 · Cited by 31
Acosta, I., Ontoso, D., & San-Segundo, P. A. (2011) · Molecular Biology of the Cell · doi:10.1091/mbc.e11-06-0482 · Cited by 27
Self-citationSan-Segundo, P. A., & Clemente‐Blanco, A. (2020) · Genes · doi:10.3390/genes11010071 · Cited by 27
Self-citationNuclear Envelope-Associated Chromosome Dynamics during Meiotic Prophase I
Zeng, X., Li, K., Yuan, R., Gao, H., Luo, J., Liu, F., Wu, Y., Wu, G., & Yan, X. (2018) · Frontiers in Cell and Developmental Biology · doi:10.3389/fcell.2017.00121 · Cited by 25
Wang, Y., Chang, C.-Y., Wu, J.-F., & Tung, K.-S. (2011) · Molecular Biology of the Cell · doi:10.1091/mbc.e10-12-1011 · Cited by 21
Cavero, S. C., Herruzo, E., Ontoso, D., & San-Segundo, P. A. (2016) · Microbial Cell · doi:10.15698/mic2016.12.548 · Cited by 20
Self-citationLo, Y.-H., Chuang, C.-N., & Wang, T. (2014) · PLoS ONE · doi:10.1371/journal.pone.0085687 · Cited by 17
Herruzo, E., Santos, B., Freire, R., Carballo, J. A., & San-Segundo, P. A. (2019) · Chromosoma · doi:10.1007/s00412-019-00696-7 · Cited by 17
Self-citationPCH-2 collaborates with CMT-1 to proofread meiotic homolog interactions
Giacopazzi, S., Vong, D., Devigne, A., & Bhalla, N. (2020) · PLoS Genetics · doi:10.1371/journal.pgen.1008904 · Cited by 17
An update to the CRM1 cargo/NES database NESdb
Fung, H. Y. J., Niesman, A. B., & Chook, Y. M. (2021) · Molecular Biology of the Cell · doi:10.1091/mbc.e20-11-0694 · Cited by 16
PCH-2 and meiotic HORMADs: A module for evolutionary innovation in meiosis?
Bhalla, N. (2022) · Current topics in developmental biology/Current Topics in Developmental Biology · doi:10.1016/bs.ctdb.2022.07.001 · Cited by 15
SWR1-Independent Association of H2A.Z to the LINC Complex Promotes Meiotic Chromosome Motion
González-Arranz, S., Gardner, J. M., Yu, Z., Patel, N. J., Heldrich, J., Santos, B., Carballo, J. A., Jaspersen, S. L., Hochwagen, A., & San-Segundo, P. A. (2020) · Frontiers in Cell and Developmental Biology · doi:10.3389/fcell.2020.594092 · Cited by 14
Self-citationHu, H., Zhang, S., Guo, J., Meng, F., Chen, X., Gong, F., Lu, G., Zheng, W., & Lin, G. (2022) · Frontiers in Physiology · doi:10.3389/fphys.2022.899149 · Cited by 12
Mittal, K., Cooper, G. W., Lee, B. P., Su, Y., Skinner, K. T., Shim, J., Jonus, H. C., Kim, W. J., Doshi, M. B., Almanza, D., et al. (2024) · Communications Biology · doi:10.1038/s42003-024-06140-6 · Cited by 12
da Silva, R. C., Villar-Fernández, M. A., & Vader, G. (2020) · PLoS Genetics · doi:10.1371/journal.pgen.1008905 · Cited by 8
Biochemical and functional characterization of a meiosis-specific Pch2/ORC AAA+ assembly
Villar-Fernández, M. A., da Silva, R. C., Firlej, M., Pan, D., Weir, E., Sarembe, A., Raina, V. B., Bange, T., Weir, J. R., & Vader, G. (2020) · Life Science Alliance · doi:10.26508/lsa.201900630 · Cited by 7
Research works printed but not linked: 1
- K Mittal, 2022, Targeting TRIP13 in Wilms tumor with nuclear export inhibitors., bioRxiv, 2022.02.23.481521
Metadata
- Authors
- Herruzo, E., Sánchez-Díaz, E., González-Arranz, S., Santos, B., Carballo, J. A., & San-Segundo, P. A.
- Affiliations
- Consejo Superior de Investigaciones Científicas (ES)
- Corresponding author
- San-Segundo, Pedro A.
- ORCID
- Venue
- PLOS Genetics
- Publisher
- Public Library of Science (PLoS)
- Published
- 2023-11-10
- Volume
- 19
- Issue
- 11
- Pages
- e1011026
- ISSN
- 1553-7390 (ISSN-L)
- 1553-7404
- PMC
- PMC10688877
- OpenAlex
- W4388562972
- Cited by
- 2
- References
- 91
- Citations by year
- 2026: 1 · 2024: 1
- FWCI
- 0.18
- Type
- journal article
- Language
- en
- Update notices
- new_version (2023-11-30)
- Open access
- gold
- doi.org
- Licence
- Locations
- PLoS Genetics (publishedVersion, cc-by)
- bioRxiv (Cold Spring Harbor Laboratory) (acceptedVersion, cc-by-nc-nd)
- PubMed Central (publishedVersion, cc-by)
- PubMed (publishedVersion)
- DIGITAL.CSIC (Spanish National Research Council (CSIC)) (submittedVersion, cc-by)
- DOAJ (DOAJ: Directory of Open Access Journals) (submittedVersion, cc-by-sa)
- Funders
- Ministerio de Ciencia e Innovación (PID2021-125830NB-I00)
- Consejería de Educación, Junta de Castilla y León (CSI259P20)
- Topics
- Life Sciences › Biochemistry, Genetics and Molecular Biology › Molecular Biology › Nuclear Structure and Function
- Life Sciences › Biochemistry, Genetics and Molecular Biology › Molecular Biology › DNA Repair Mechanisms
- Life Sciences › Biochemistry, Genetics and Molecular Biology › Cell Biology › Microtubule and mitosis dynamics
- Keywords
- Pch2, nuclear transport, nuclear export signal, AAA+ ATPase, leptomycin B, nuclear accumulation, meiotic prophase I, nuclear export
- MeSH terms
- DNA-Binding Proteins, Homeostasis, Meiosis, Nuclear Proteins, Saccharomyces cerevisiae, Active Transport, Cell Nucleus, Karyopherins, Saccharomyces cerevisiae Proteins
About these checks
Registry, retraction, Cites and statistics results are computed, not judged, with one exception: a printed reference that no index lists is read once by a model before it counts as a citation error. Claims are extracted by a model and kept only when their quote appears verbatim in the text; each cited source is then checked, with a model’s help, for whether it says what the claim relies on. Those verdicts can be wrong — read the claim’s quote and the cited source before relying on one.
Statistics and arithmetic are recomputed, not judged.
Confidence bands are shown only for fields calibrated on our annotated test set. None is calibrated yet, so no band is shown.
What counts as a claim ›How we measure confidence ›How we check this ›
Are you an author, or do you see a problem with this page? Request a review
Data sources
Bibliographic data: Semantic Scholar, OpenAlex, Crossref.
Contains information from the Semantic Scholar Academic Graph Datasets, made available under the ODC Attribution License (ODC-BY 1.0).
Semantic Scholar’s data is described in: Kinney, R., et al. (2023). The Semantic Scholar Open Data Platform. arXiv:2301.10140.
