Student or educator? Sign up with your school email and get 6 months of Pro free.
CoChat

The DOI matches its Crossref record; the references it cites are not checked yet.

A Wireless Brain-Machine Interface for Real-Time Speech Synthesis

Open access

Abstract

BACKGROUND: Brain-machine interfaces (BMIs) involving electrodes implanted into the human cerebral cortex have recently been developed in an attempt to restore function to profoundly paralyzed individuals. Current BMIs for restoring communication can provide important capabilities via a typing process, but unfortunately they are only capable of slow communication rates. In the current study we use a novel approach to speech restoration in which we decode continuous auditory parameters for a real-time speech synthesizer from neuronal activity in motor cortex during attempted speech. METHODOLOGY/PRINCIPAL FINDINGS: Neural signals recorded by a Neurotrophic Electrode implanted in a speech-related region of the left precentral gyrus of a human volunteer suffering from locked-in syndrome, characterized by near-total paralysis with spared cognition, were transmitted wirelessly across the scalp and used to drive a speech synthesizer. A Kalman filter-based decoder translated the neural signals generated during attempted speech into continuous parameters for controlling a synthesizer that provided immediate (within 50 ms) auditory feedback of the decoded sound. Accuracy of the volunteer's vowel productions with the synthesizer improved quickly with practice, with a 25% improvement in average hit rate (from 45% to 70%) and 46% decrease in average endpoint error from the first to the last block of a three-vowel task. CONCLUSIONS/SIGNIFICANCE: Our results support the feasibility of neural prostheses that may have the potential to provide near-conversational synthetic speech output for individuals with severely impaired speech motor control. They also provide an initial glimpse into the functional properties of neurons in speech motor cortical areas.

Overview

The claims and statistics of this paper haven’t been checked yet.

Run the check — free, no account needed. It reads the open-access text and checks the sources it cites.

A few free checks a day · papers already verified open instantly · results are public

Integrity signals

Registry

Crossref · 10.1371/journal.pone.0008218

Cites

Statistics

Figures

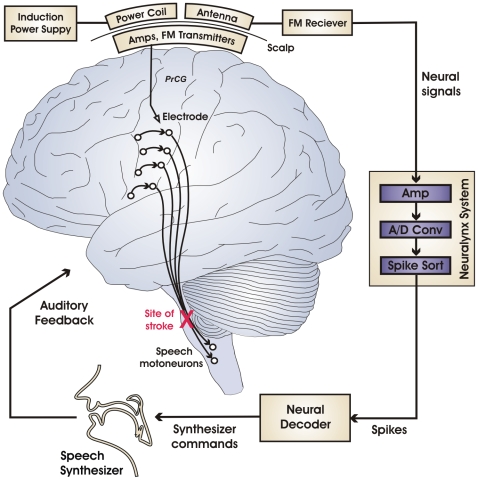
Figure 1 Schematic of the brain-machine interface for real-time synthetic speech production. Black circles and curved arrows represent neurons and axonal projections, respectively, in the neural circuitry for speech motor output. The volunteer's stroke-induced lesion in the efferent motor pathways (red X) disconnects motor plans represented in the cerebral cortex from the speech motoneurons, thus disabling speech output while sparing somatic, auditory, and visual sensation as well as speech motor planning centers in cerebral cortex. Signals collected from an electrode implanted in the subject's speech motor cortex are amplified and sent wirelessly across the scalp as FM radio signals. The signals are then routed to an electrophysiology recording system for further amplification, analog-to-digital conversion, and spike sorting. The sorted spikes are sent to a Neural Decoder which translates them into commands for a Speech Synthesizer. Audio signals from the synthesizer are fed back to the subject in real time. [Abbreviation: PrCG = precentral gyrus.]
Figure 1 Schematic of the brain-machine interface for real-time synthetic speech production. Black circles and curved arrows represent neurons and axonal projections, respectively, in the neural circuitry for speech motor output. The volunteer's stroke-induced lesion in the efferent motor pathways (red X) disconnects motor plans represented in the cerebral cortex from the speech motoneurons, thus disabling speech output while sparing somatic, auditory, and visual sensation as well as speech motor planning centers in cerebral cortex. Signals collected from an electrode implanted in the subject's speech motor cortex are amplified and sent wirelessly across the scalp as FM radio signals. The signals are then routed to an electrophysiology recording system for further amplification, analog-to-digital conversion, and spike sorting. The sorted spikes are sent to a Neural Decoder which translates them into commands for a Speech Synthesizer. Audio signals from the synthesizer are fed back to the subject in real time. [Abbreviation: PrCG = precentral gyrus.]CC BY · PubMed Central
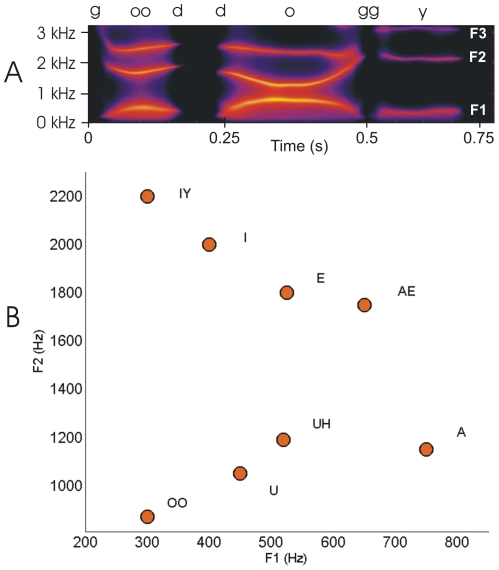
Figure 2 Formant frequencies in speech. (A) Spectrogram of the utterance “good doggy” with the trajectories of the first three formant frequencies (F1, F2, F3) clearly visible as bright bands of high energy. (B) Approximate locations of the monophthongal vowels of English plotted on the plane formed by the first two formant frequencies.
Figure 2 Formant frequencies in speech. (A) Spectrogram of the utterance “good doggy” with the trajectories of the first three formant frequencies (F1, F2, F3) clearly visible as bright bands of high energy. (B) Approximate locations of the monophthongal vowels of English plotted on the plane formed by the first two formant frequencies.CC BY · PubMed Central
Figure 3 Formant tuning of individual units and of the neural ensemble. Individual units: Black arrows represent the formant tuning of individual units in polar coordinates, with angle representing the preferred direction of movement and arrow length representing the tuning strength (see Methods for details). The strength of tuning to each possible direction of movement in formant space is computed as the average correlation (across sessions) between each unit's firing rate and the target formant position along this direction. The preferred direction of movement is then computed as the direction with maximal tuning strength among all possible directions. Neural ensemble: The black curve represents the formant tuning of the neural ensemble in polar coordinates, with angles representing each possible direction of movement and distance from origin representing the tuning strength. Green lines represent the directions of movement in formant space of the three target sounds used for training, and the two small circles along the neural ensemble tuning curve represent the average strength of the correlations between firing rates and F1 (r = 0.49, p<.001), and F2 (r = .57, p<.001), respectively.
Figure 3 Formant tuning of individual units and of the neural ensemble. Individual units: Black arrows represent the formant tuning of individual units in polar coordinates, with angle representing the preferred direction of movement and arrow length representing the tuning strength (see Methods for details). The strength of tuning to each possible direction of movement in formant space is computed as the average correlation (across sessions) between each unit's firing rate and the target formant position along this direction. The preferred direction of movement is then computed as the direction with maximal tuning strength among all possible directions. Neural ensemble: The black curve represents the formant tuning of the neural ensemble in polar coordinates, with angles representing each possible direction of movement and distance from origin representing the tuning strength. Green lines represent the directions of movement in formant space of the three target sounds used for training, and the two small circles along the neural ensemble tuning curve represent the average strength of the correlations between firing rates and F1 (r = 0.49, p<.001), and F2 (r = .57, p<.001), respectively.CC BY · PubMed Central
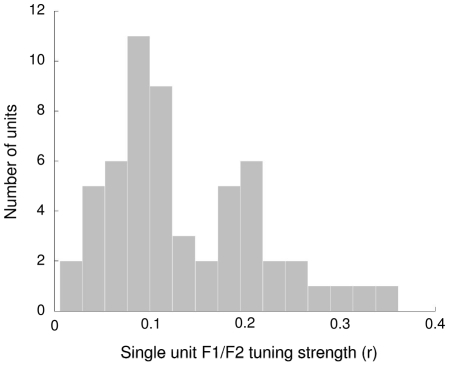
Figure 4 Distribution of unit correlation coefficients (indicative of formant tuning strengths in the unit's preferred direction) averaged across sessions. The first peak is representative of units with “poor” tuning, the second peak represents units with “average” tuning, and the right distribution tail represents units with “good” tuning.
Figure 4 Distribution of unit correlation coefficients (indicative of formant tuning strengths in the unit's preferred direction) averaged across sessions. The first peak is representative of units with “poor” tuning, the second peak represents units with “average” tuning, and the right distribution tail represents units with “good” tuning.CC BY · PubMed Central
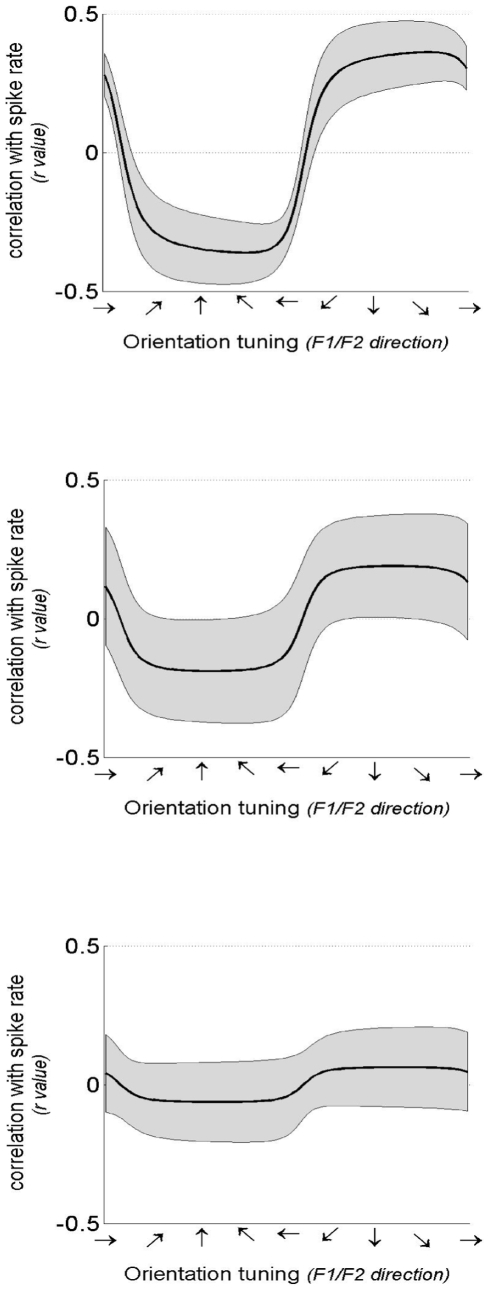
Figure 5 Sample tuning curves for representative good (top), average (middle), and poor (bottom) tuned units. Tuning curves (black) and 95% confidence intervals (gray) are computed as described in Methods : Formant tuning analyses. Tuning strength is indicated by the correlation between unit firing rates and formant frequency. The three units shown are primarily tuned to changes in F2, illustrated by relatively low values at each horizontal direction.
Figure 5 Sample tuning curves for representative good (top), average (middle), and poor (bottom) tuned units. Tuning curves (black) and 95% confidence intervals (gray) are computed as described in Methods : Formant tuning analyses. Tuning strength is indicated by the correlation between unit firing rates and formant frequency. The three units shown are primarily tuned to changes in F2, illustrated by relatively low values at each horizontal direction.CC BY · PubMed Central
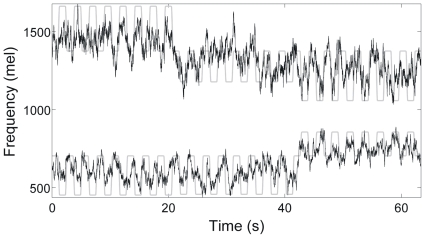
Figure 6 Results of offline ridge regression reconstruction of intended formant frequencies while the participant attempted to speak in synchrony with a speech stimulus. Reconstructed values of the first (bottom) and second (middle) formant frequencies (in Mel units) are shown (black lines) along with the formant frequencies present in the stimulus being mimicked (gray lines).
Figure 6 Results of offline ridge regression reconstruction of intended formant frequencies while the participant attempted to speak in synchrony with a speech stimulus. Reconstructed values of the first (bottom) and second (middle) formant frequencies (in Mel units) are shown (black lines) along with the formant frequencies present in the stimulus being mimicked (gray lines).CC BY · PubMed Central
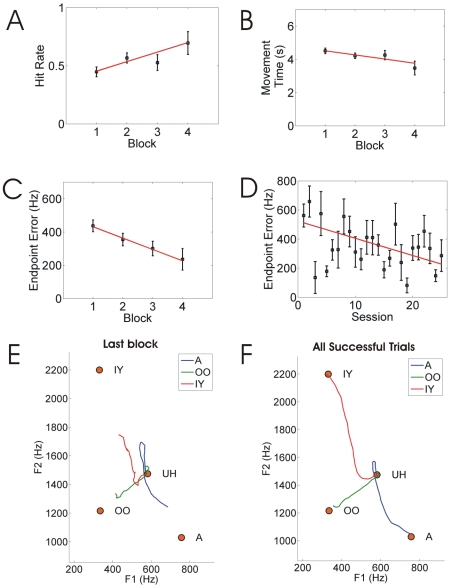
Figure 7 Results for vowel production task with real-time synthesizer. (A–C) Performance measures as a function of block number within a session, averaged across all sessions: (A) hit rate, (B) movement time, and (C) endpoint error. (D) Average endpoint error as a function of session number. (E–F) Average formant trajectories for utterances in (E) the last block of all sessions, and (F) successful trials in all blocks and sessions.
Figure 7 Results for vowel production task with real-time synthesizer. (A–C) Performance measures as a function of block number within a session, averaged across all sessions: (A) hit rate, (B) movement time, and (C) endpoint error. (D) Average endpoint error as a function of session number. (E–F) Average formant trajectories for utterances in (E) the last block of all sessions, and (F) successful trials in all blocks and sessions.CC BY · PubMed Central
Figure 8 Electrode location in the participant's cerebral cortex. (A) Left panels: Axial (top) and sagittal (bottom) slices showing brain activity along the precentral gyrus during a word generation fMRI task prior to implantation. Red lines denote pre-central sulcus; yellow lines denote central sulcus. Right panels: Corresponding images from a post-implant CT scan showing location of electrode. (B) 3D CT image showing electrode wire entering dura mater. Subcutaneous electronics are visible above the electrode wire, on top of the skull.
Figure 8 Electrode location in the participant's cerebral cortex. (A) Left panels: Axial (top) and sagittal (bottom) slices showing brain activity along the precentral gyrus during a word generation fMRI task prior to implantation. Red lines denote pre-central sulcus; yellow lines denote central sulcus. Right panels: Corresponding images from a post-implant CT scan showing location of electrode. (B) 3D CT image showing electrode wire entering dura mater. Subcutaneous electronics are visible above the electrode wire, on top of the skull.CC BY · PubMed Central

Verification

Claims the paper makes

The claims and statistics of this paper haven’t been checked yet.

Run the check — free, no account needed. It reads the open-access text and checks the sources it cites.

A few free checks a day · papers already verified open instantly · results are public

Claims other papers make about this one

Each is checked against this paper’s own text: does it say what the citing paper says it does?

Self-check

Percentages, sums and reported differences re-computed from the paper’s own numbers.

The self-check needs the paper’s full text.

Citations

The citation lists haven’t been fetched yet

References 48 · Cited by 306

Research works printed but not linked: 2

  1. [22]Stevens KN 1998 Acoustic phonetics. Cambridge MIT Press
  2. [43]Zemlin WR 1998 Speech and Hearing Science: Anatomy and Physiology (4th Edition). Needham Heights, MA Allyn and Bacon

Metadata

Authors
Guenther, F. H., Brumberg, J. S., Wright, E. J., Nieto-Castanon, A., Tourville, J. A., Panko, M., Law, R., Siebert, S. A., Bartels, J. L., Andreasen, D. S., Ehirim, P., Mao, H., & Kennedy, P. R.
Affiliations
  • Boston University (US)
  • Neural Signals (United States) (US)
  • Gwinnett Medical Center (US)
  • Emory University Hospital (US)
Corresponding author
Guenther, Frank H.
Venue
PLoS ONE
Published
2009-12-09
Volume
4
Issue
12
Pages
e8218
ISSN
1932-6203 (ISSN-L)
OpenAlex
W2110015077
Cited by
306
References
48
Citations by year
2026: 11 · 2025: 24 · 2024: 19 · 2023: 16 · 2022: 24 · 2021: 20 · 2020: 19 · 2019: 16 · 2018: 10 · 2017: 12 · 2016: 18 · 2015: 22 · 2014: 29 · 2013: 26 · 2012: 14
FWCI
6.22
Type
journal article
Language
en
Open access
Locations
  • PLoS ONE (publishedVersion, cc-by)
  • PubMed Central (publishedVersion, cc-by)
  • PubMed (publishedVersion)
  • DSpace@MIT (Massachusetts Institute of Technology) (submittedVersion, cc-by)
  • Digital Access to Scholarship at Harvard (DASH) (Harvard University) (submittedVersion, cc-by)
  • DOAJ (DOAJ: Directory of Open Access Journals) (submittedVersion, cc-by-sa)
  • KU ScholarWorks (The University of Kansas) (submittedVersion, cc-by)
  • OpenBU (Boston University) (submittedVersion, other-oa)
  • OpenBU (Boston University) (submittedVersion, cc-by)
  • Greater South Information System
Funders
  • National Science Foundation (0354378)
  • Center of Excellence for Learning in Education, Science and Technology (SBE-0354378)
  • National Institute on Deafness and Other Communication Disorders (DC007683, R44DC007050, R01DC002852, DC002852, R01DC007683)
Topics
  • Life Sciences › Neuroscience › Cognitive Neuroscience › EEG and Brain-Computer Interfaces
  • Life Sciences › Neuroscience › Cellular and Molecular Neuroscience › Neuroscience and Neural Engineering
  • Life Sciences › Neuroscience › Cognitive Neuroscience › Tactile and Sensory Interactions
Keywords
brain-computer interface, wireless neural recording, real-time speech synthesis, locked-in syndrome, motor cortex, neural decoding, Kalman filter, auditory feedback, neural prosthesis, speech motor control, precentral gyrus, communication restoration
MeSH terms
Adult, Brain, Communication Devices for People with Disabilities, Electrodes, Implanted, Humans, Male, Time Factors

About these checks

Registry, retraction, Cites and statistics results are computed, not judged, with one exception: a printed reference that no index lists is read once by a model before it counts as a citation error. Claims are extracted by a model and kept only when their quote appears verbatim in the text; each cited source is then checked, with a model’s help, for whether it says what the claim relies on. Those verdicts can be wrong — read the claim’s quote and the cited source before relying on one.

Statistics and arithmetic are recomputed, not judged.

Confidence bands are shown only for fields calibrated on our annotated test set. None is calibrated yet, so no band is shown.

What counts as a claim ›How we measure confidence ›How we check this ›

Are you an author, or do you see a problem with this page? Request a review

How to cite

Cite CoChat for the checks on this page, and the paper for its own findings.

This page
CoChat. (2026). Citation check: A Wireless Brain-Machine Interface for Real-Time Speech Synthesis. https://app.cochat.ai/papers/10.1371/journal.pone.0008218
The paper
Guenther, F. H., Brumberg, J. S., Wright, E. J., Nieto-Castanon, A., Tourville, J. A., Panko, M., Law, R., Siebert, S. A., Bartels, J. L., Andreasen, D. S., Ehirim, P., Mao, H., & Kennedy, P. R. (2009). A Wireless Brain-Machine Interface for Real-Time Speech Synthesis. PLoS ONE. https://doi.org/10.1371/journal.pone.0008218

Data sources

Bibliographic data: Semantic Scholar, OpenAlex, Crossref.

Contains information from the Semantic Scholar Academic Graph Datasets, made available under the ODC Attribution License (ODC-BY 1.0).

Semantic Scholar’s data is described in: Kinney, R., et al. (2023). The Semantic Scholar Open Data Platform. arXiv:2301.10140.