

The DOI matches its Crossref record; 46 of the 46 references it cites were found in a registry or an index; 2 of the 6 sources its claims cite were checked for support.
When the Optimal Is Not the Best: Parameter Estimation in Complex Biological Models
Open accessAbstract
BACKGROUND: The vast computational resources that became available during the past decade enabled the development and simulation of increasingly complex mathematical models of cancer growth. These models typically involve many free parameters whose determination is a substantial obstacle to model development. Direct measurement of biochemical parameters in vivo is often difficult and sometimes impracticable, while fitting them under data-poor conditions may result in biologically implausible values. RESULTS: We discuss different methodological approaches to estimate parameters in complex biological models. We make use of the high computational power of the Blue Gene technology to perform an extensive study of the parameter space in a model of avascular tumor growth. We explicitly show that the landscape of the cost function used to optimize the model to the data has a very rugged surface in parameter space. This cost function has many local minima with unrealistic solutions, including the global minimum corresponding to the best fit. CONCLUSIONS: The case studied in this paper shows one example in which model parameters that optimally fit the data are not necessarily the best ones from a biological point of view. To avoid force-fitting a model to a dataset, we propose that the best model parameters should be found by choosing, among suboptimal parameters, those that match criteria other than the ones used to fit the model. We also conclude that the model, data and optimization approach form a new complex system and point to the need of a theory that addresses this problem more generally.
Overview
CoChat Summary
TL;DR
In a six-parameter avascular tumor growth model fitted to synthetic Gompertz growth data, the authors find that the global minimum of the least-squares cost function yields biologically implausible parameters. They argue that parameter estimation should select suboptimal but interpretable parameter sets using independent biological criteria rather than relying only on cost-function minimization.
Key findings
- The cost-function landscape was highly rugged, with many local minima; the authors used more than 100,000 evaluations and found that the global minimum was not biologically meaningful.
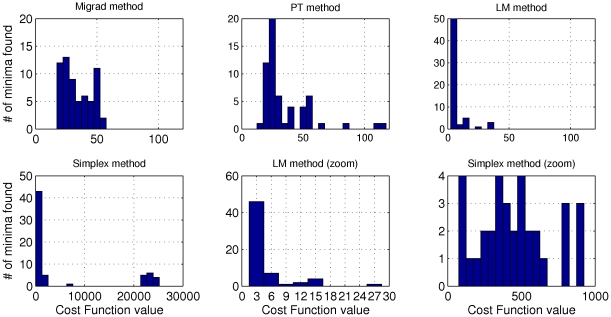
- Optimization performance differed by method: Levenberg-Marquardt found the smallest minima around 2, MIGRAD and parallel tempering found minima around 20, and downhill simplex found minima in the 100s.
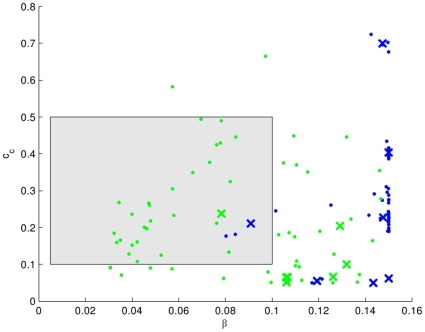
- Only one minimum centroid per method fell within biologically feasible values for parameters 3 and 4, and neither centroid corresponded to the cluster containing the minimum for LM or PT.
- Sloppiness analysis showed the smallest eigenvalue corresponded essentially to the vector (0,0,0,0,1,0), making parameter 5 the most sloppy direction; LM’s 5th parameter was seven orders of magnitude smaller than PT’s.
Methods
- The study used the Ward-King avascular tumor growth model with 6 free parameters bounded in [0,1], fitted to synthetic radius-versus-time data generated from a Gompertz curve with 5% noise over 100 time points.
- Four optimization approaches were tested: Levenberg-Marquardt, MIGRAD/Fletcher-Davidon-Powell, downhill simplex, and parallel tempering, using a 6-dimensional mesh of 64 starting points and massive parallel runs on Blue Gene with MPI.
- The authors analyzed minima using histograms, principal component analysis, hierarchical clustering, and sloppiness analysis around cluster centroids.
Limitations
- The paper states that the model assumes perfect spherical symmetry, Michaelis-Menten growth behavior, ignores the discrete nature of cellular composition, and neglects mechanical stresses between cells.
- The fitting used synthetic Gompertz data with added noise rather than direct experimental measurements, and the authors describe the global minimum as “what seems to be” the global minimum.
- Evident from the text: MIGRAD runs were sometimes interrupted at a maximum iteration count, and the conclusions are based on one avascular tumor model and one synthetic dataset.
Model-written summary. Check it against the paper before relying on it.
Integrity signals
Registry
Cites
Statistics
Figures



Verification
Claims the paper makes
1 Valid · 1 Not valid · 3 Not checked · 67 Own results and interpretations
Every source the paper cites for this claim was checked and supports it.
In the paper
“One such difficulty stems for the fact that models may display sloppy parameter sensitivities [7], [8], whereby some parameters can compensate other parameters, resulting in some arbitrariness in the specification of their values.”
§ When the Optimal Is Not the Best: Parameter Estimation in Complex Biological Models > Introduction
What the sources say
- Supportedcites [7] R Gutenkunst, 2007, Universally Sloppy Parameter Sensitivities in Systems Biology Models., PLoS Comput Biol source
The Introduction says sloppy models are insensitive to changes in many parameter combinations, making precise values difficult to determine. The Discussion explains that a model can be tuned by adjusting key parameters independently of how reliably other parameters are estimated. Together, these passages support the paraphrase about compensation and some arbitrariness in parameter values. (LLM, conf=0.91)
- Supportedcites [8] BC Daniels, 2008, Sloppiness, robustness, and evolvability in systems biology., Current Opinion in Biotechnology source
The Introduction (pp. 1–2) defines sloppiness as sensitivity to a few combinations of parameters but relative insensitivity along many other directions, leaving parameter values poorly determined. Figure 2 (p. 3) describes large parameter variations without a change in model behavior, supporting the paraphrase that parameter values can compensate for one another. (LLM, conf=0.92)
plainstates a possible cause- Asserted: passes — The authors put it forward as true.
- Checkable: passes — It can be checked against evidence.
- Load-bearing: passes — The paper’s conclusions depend on it.
- Based: passes — The paper gives a reason why it holds.
- Supported
A result the paper reports from its own data — it cites no other source for it, so there is none to check. The quote shows it is in the paper.
In the paper
“MIGRAD and PT show a similar tendency toward finding minima in the high range of the 6th parameter values.”
§ When the Optimal Is Not the Best: Parameter Estimation in Complex Biological Models > Results
plainstates an association- Asserted: passes — The authors put it forward as true.
- Checkable: passes — It can be checked against evidence.
- Load-bearing: unclear — It is unclear whether the paper’s conclusions depend on it.
- Based: passes — The paper gives a reason why it holds.
- Rests on 6 assumptions not shown here.
A result the paper reports from its own data — it cites no other source for it, so there is none to check. The quote shows it is in the paper.
In the paper
“Only one minimum centroid for each method was within the biologically feasible values.”
§ When the Optimal Is Not the Best: Parameter Estimation in Complex Biological Models > Results
plain- Asserted: passes — The authors put it forward as true.
- Checkable: passes — It can be checked against evidence.
- Load-bearing: passes — The paper’s conclusions depend on it.
- Based: passes — The paper gives a reason why it holds.
A result the paper reports from its own data — it cites no other source for it, so there is none to check. The quote shows it is in the paper.
In the paper
“Notwithstanding, growth curves from all minima closely followed the experimental growth curve (see Figure S2 in File S1).”
§ When the Optimal Is Not the Best: Parameter Estimation in Complex Biological Models > Results
plainstates an association- Asserted: passes — The authors put it forward as true.
- Checkable: passes — It can be checked against evidence.
- Load-bearing: passes — The paper’s conclusions depend on it.
- Based: passes — The paper gives a reason why it holds.
A result the paper reports from its own data — it cites no other source for it, so there is none to check. The quote shows it is in the paper.
In the paper
“This cost function has many local minima with unrealistic solutions, including the global minimum corresponding to the best fit.”
§ When the Optimal Is Not the Best: Parameter Estimation in Complex Biological Models > Abstract > Results
plain- Asserted: passes — The authors put it forward as true.
- Checkable: passes — It can be checked against evidence.
- Load-bearing: passes — The paper’s conclusions depend on it.
- Based: passes — The paper gives a reason why it holds.
- Rests on 6 assumptions not shown here.
40 more claims
Create a free account to see all 72 claims and every source verdict.
- It may state two separate claims as one. 18
- Probably not a substantial claim. 11
Citations
Cites
An Algorithm for Least-Squares Estimation of Nonlinear Parameters
Marquardt, D. W. (1963) · Journal of the Society for Industrial and Applied Mathematics · doi:10.1137/0111030 · Cited by 30,728 · cited 1×
“To minimize this cost function we implemented and tested four different algorithms: (1) Levenberg-Marquardt [19,20]; (2) Fletcher-Davi-don-Powell [21]; (3) Downhill Simplex [22]; (4) Parallel Tempering [23].”
MethodA Simplex Method for Function Minimization
Nelder, J. A., & Mead, R. (1965) · The Computer Journal · doi:10.1093/comjnl/7.4.308 · Cited by 28,905 · cited 2×
“To minimize this cost function we implemented and tested four different algorithms: (1) Levenberg-Marquardt [19,20]; (2) Fletcher-Davi-don-Powell [21]; (3) Downhill Simplex [22]; (4) Parallel Tempering [23].”
MethodJolliffe, I. (2005) · Encyclopedia of Statistics in Behavioral Science · doi:10.1002/0470013192.bsa501 · Cited by 14,310
A method for the solution of certain non-linear problems in least squares
Levenberg, K. (1944) · Quarterly of Applied Mathematics · doi:10.1090/qam/10666 · Cited by 12,359
Philosophical transactions of the Royal Society of London. B
Press, H. (1886) · Cited by 10,080
Jolliffe, I. T. (1986) · Springer Series in Statistics · doi:10.1007/978-1-4757-1904-8 · Cited by 8,273
A new approach to variable metric algorithms
Fletcher, R. (1970) · The Computer Journal · doi:10.1093/comjnl/13.3.317 · Cited by 4,068 · cited 1×
“To minimize this cost function we implemented and tested four different algorithms: (1) Levenberg-Marquardt [19,20]; (2) Fletcher-Davidon-Powell [21]; (3) Downhill Simplex [22]; (4) Parallel Tempering [23].”
MethodGompertz, B. (1825) · Philosophical Transactions of the Royal Society of London · doi:10.1098/rstl.1825.0026 · Cited by 3,816
Numerical Methods for Least Squares Problems
Björck, Å. (1996) · Society for Industrial and Applied Mathematics eBooks · doi:10.1137/1.9781611971484 · Cited by 3,257
Minuit - a system for function minimization and analysis of the parameter errors and correlations
James, F., & Roos, M. (1975) · Computer Physics Communications · doi:10.1016/0010-4655(75)90039-9 · Cited by 3,255 · cited 1×
“For future reference, the residuals vector f is defined as The methods used for the minimization of the cost function are Levenberg-Marquardt [19], Parallel tempering [23], MIGRAD [31] and downhill simplex [22] (see supplemental section 2 for method details).”
Method
Research works printed but not linked: 1
- D Fernández Slezak, 2007, Nonlinear pde system as model of avascular tumor growth., Mecánica Computacional, XXVI, 1788
Cited by
Advances and selected recent developments in state and parameter estimation
Kravaris, C., Hahn, J., & Chu, Y. (2013) · Computers & Chemical Engineering · doi:10.1016/j.compchemeng.2012.06.001 · Cited by 177
“Furthermore, similarly to what is widely-known in system identification, parameters that best fit the training data are not necessarily the best ones from a practical point of view (Slezak et al., 2010).”
A Comparison and Catalog of Intrinsic Tumor Growth Models
Sarapata, E., & de Pillis, L. G. (2014) · Bulletin of Mathematical Biology · doi:10.1007/s11538-014-9986-y · Cited by 168
Warne, D. J., Baker, R. E., & Simpson, M. J. (2019) · Bulletin of Mathematical Biology · doi:10.1007/s11538-019-00589-x · Cited by 87
Meyer, P., Cokelaer, T., Chandran, D., Kim, K., Loh, P., Tucker, G., Lipson, M., Berger, B., Kreutz, C., Raue, A., et al. (2014) · BMC Systems Biology · doi:10.1186/1752-0509-8-13 · Cited by 74
“How to choose among all these options is not obvious and, despite the critical importance of these questions, the problem of parameter estimation and iterative experimental design remains one of the hardest challenges in systems biology [4-6,9,20,21].”
BackgroundSelf-citationAdvances in systems biology modeling: 10 years of crowdsourcing DREAM challenges
Meyer, P., & Sáez-Rodríguez, J. (2021) · Cell Systems · doi:10.1016/j.cels.2021.05.015 · Cited by 78
Metadata
- Authors
- Fernández Slezak, D., Suárez, C., Cecchi, G. A., Marshall, G., & Stolovitzky, G.
- Affiliations
- Universidad de Buenos Aires (AR)
- IBM (United States) (US)
- Corresponding author
- Stolovitzky, Gustavo
- Venue
- PLoS ONE
- Publisher
- Public Library of Science (PLoS)
- Published
- 2010-10-25
- Volume
- 5
- Issue
- 10
- Pages
- e13283
- ISSN
- 1932-6203 (ISSN-L)
- PMC
- PMC2963600
- OpenAlex
- W2071629571
- Semantic Scholar
- e523813db996bb5a442437cd1d3a1c319be518e5
- Cited by
- 57
- References
- 44
- Citations by year
- 2026: 1 · 2024: 2 · 2023: 2 · 2022: 5 · 2021: 2 · 2020: 5 · 2019: 3 · 2018: 3 · 2017: 3 · 2016: 4 · 2015: 9 · 2014: 6 · 2013: 3 · 2012: 4
- FWCI
- 4.10
- Type
- journal article
- Language
- en
- Open access
- gold
- doi.org
- Locations
- PLoS ONE (publishedVersion, cc-by)
- LA Referencia (Red Federada de Repositorios Institucionales de Publicaciones Científicas) (publishedVersion, other-oa)
- Europe PMC (PubMed Central) (publishedVersion, cc-by)
- PubMed Central (publishedVersion, cc-by)
- PubMed (publishedVersion)
- Repositorio Digital Institucional de la Universidad de Buenos Aires (Universidad de Buenos Aires) (publishedVersion, other-oa)
- arXiv (Cornell University) (submittedVersion)
- RePEc: Research Papers in Economics (submittedVersion)
- DOAJ (DOAJ: Directory of Open Access Journals) (submittedVersion, cc-by-sa)
- arXiv (Cornell University)
- Greater South Information System
- Funders
- Consejo Nacional de Investigaciones Científicas y Técnicas
- Universidad de Buenos Aires (UBACYT M415, CONICET)
- Agencia Nacional de Promoción Científica y Tecnológica (CONICET)
- Secretaría de Ciencia y Técnica, Universidad de Buenos Aires
- Topics
- Physical Sciences › Mathematics › Modeling and Simulation › Mathematical Biology Tumor Growth
- Physical Sciences › Mathematics › Applied Mathematics › Mathematical and Theoretical Epidemiology and Ecology Models
- Life Sciences › Agricultural and Biological Sciences › Agronomy and Crop Science › Agriculture, Soil, Plant Science
- Keywords
- parameter estimation, avascular tumor growth, tumor growth modeling, local minima, biological plausibility, model fitting, parameter space exploration
- MeSH terms
- Cell Division, Humans, Models, Biological, Neoplasms
About these checks
Registry, retraction, Cites and statistics results are computed, not judged, with one exception: a printed reference that no index lists is read once by a model before it counts as a citation error. Claims are extracted by a model and kept only when their quote appears verbatim in the text; each cited source is then checked, with a model’s help, for whether it says what the claim relies on. Those verdicts can be wrong — read the claim’s quote and the cited source before relying on one.
A language model drew the claims from the paper on 2026-10-10, under version 3 of the claim definition (model deepseek-v4.1-flash, prompt extract-v3).
A second model labelled each claim on 2026-10-10 (model jev-1.13-20260917, definition revision gold-guideline-v0.2).
Cited sources are checked with a language model’s help (gpt-6-sol).
Statistics and arithmetic are recomputed, not judged.
Confidence bands are shown only for fields calibrated on our annotated test set. None is calibrated yet, so no band is shown.
What counts as a claim ›How we measure confidence ›How we check this ›
Are you an author, or do you see a problem with this page? Request a review
How to cite
Cite CoChat for the checks on this page, and the paper for its own findings.
- This page
- CoChat. (2026). Citation check: When the Optimal Is Not the Best: Parameter Estimation in Complex Biological Models. https://app.cochat.ai/papers/10.1371/journal.pone.0013283
- The paper
- Fernández Slezak, D., Suárez, C., Cecchi, G. A., Marshall, G., & Stolovitzky, G. (2010). When the Optimal Is Not the Best: Parameter Estimation in Complex Biological Models. PLoS ONE. https://doi.org/10.1371/journal.pone.0013283
Data sources
Bibliographic data: Semantic Scholar, OpenAlex, Crossref.
Contains information from the Semantic Scholar Academic Graph Datasets, made available under the ODC Attribution License (ODC-BY 1.0).
Semantic Scholar’s data is described in: Kinney, R., et al. (2023). The Semantic Scholar Open Data Platform. arXiv:2301.10140.
