

The DOI matches its Crossref record; 1 of the 1 references it cites were found in a registry or an index.
A Restoration Suitability Index Model for the Eastern Oyster (Crassostrea virginica) in the Mission-Aransas Estuary, TX, USA
Overview
The claims and statistics of this paper haven’t been checked yet.
Run the check — free, no account needed. It reads the open-access text and checks the sources it cites.
Integrity signals
Registry
Cites
Statistics
Figures
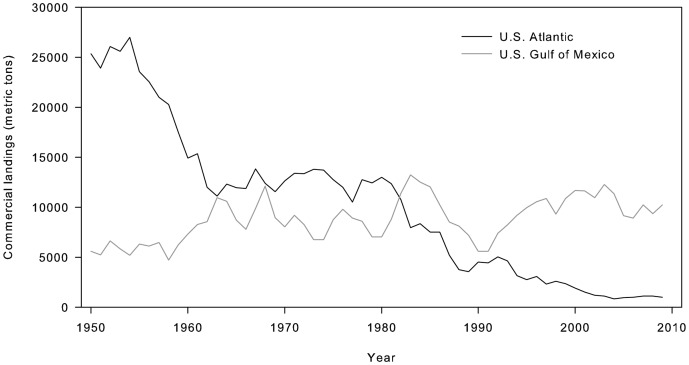
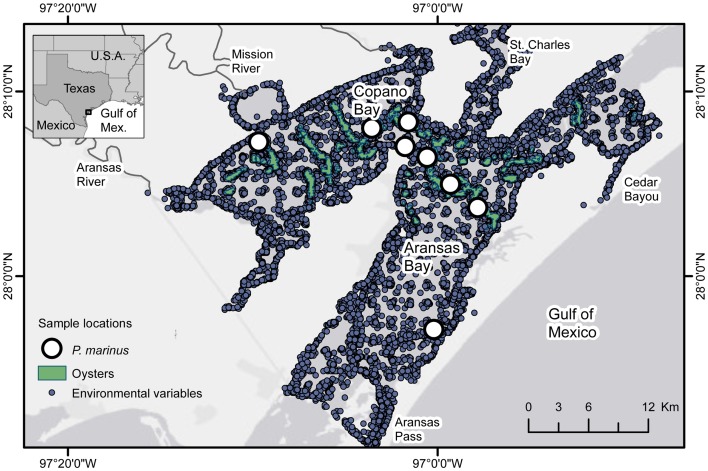
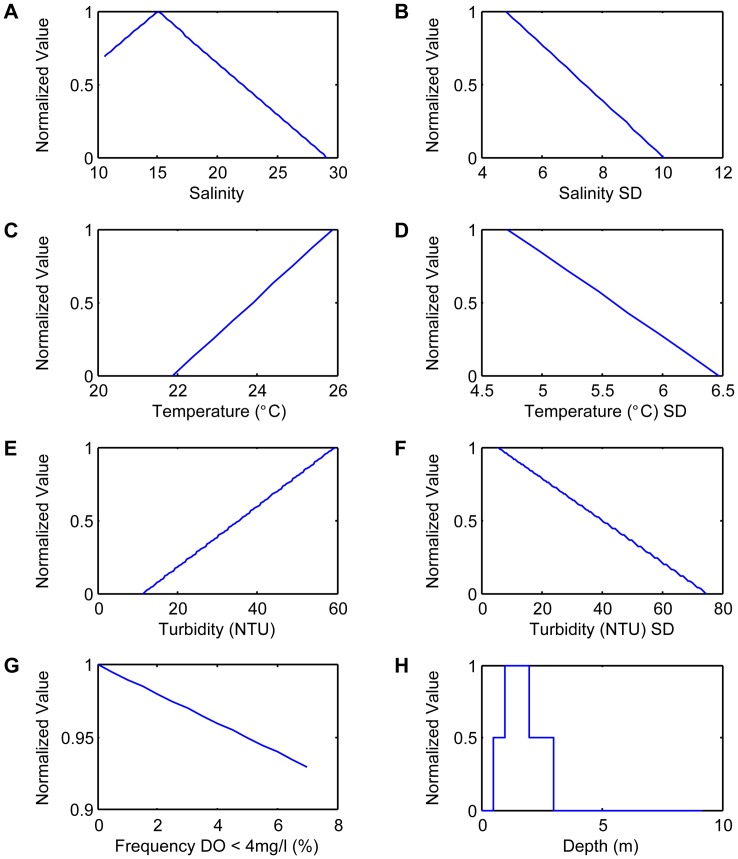
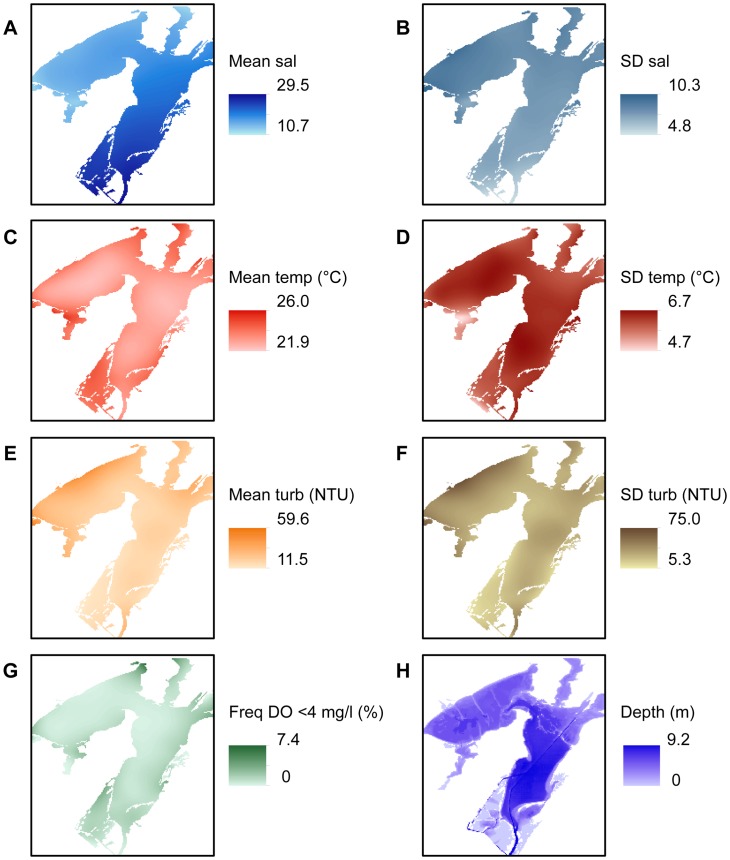
Verification
Claims the paper makes
The claims and statistics of this paper haven’t been checked yet.
Run the check — free, no account needed. It reads the open-access text and checks the sources it cites.
Claims other papers make about this one
Each is checked against this paper’s own text: does it say what the citing paper says it does?
In the citing paper
“Eastern oyster Crassostrea virginica reefs in the northern Gulf of Mexico have experienced significant changes due to habitat modification, hurricanes, harvesting, changing climate, and oil spills (Seavey et al. 2011;Pollack et al. 2012;Pine et al. 2015;Grabowski et al. 2017).”
From Adaptive Management in Practice and the Problem of Application at Multiple Scales—Insights from Oyster Reef Restoration on Florida’s Gulf Coast (2022) · cites this paper as Pollack et al. 2012
Self-check
Percentages, sums and reported differences re-computed from the paper’s own numbers.
The self-check needs the paper’s full text.
Citations
Cites
Carnegie, R., & Burreson, E. (2011) · Marine Ecology Progress Series · doi:10.3354/meps09221 · Cited by 85
Research works printed but not linked: 38
- MW Beck, 2011, Oyster Reefs at Risk and Recommendations for Conservation, Restoration, and Management., Bioscience, 61, 107, 10.1525/bio.2011.61.2.5 · DOI
- Jr E Doran, 1965, Shell roads in Texas., Geographical review, 55, 223, 10.2307/212711 · DOI
- EN Powell, 1995, Modeling oyster populations. V. Declining phytoplankton stocks and the population dynamics of American oyster (Crassostrea virginica) populations., Fish Res, 24, 199, 10.1016/0165-7836(95)00370-P · DOI
- A Craig, 1989, Distribution of Perkinsus marinus in gulf coast oyster populations., Estuaries, 12, 82, 10.2307/1351499 · DOI
- N Williams, 2010, Gulf braced for the big clean-up., Current Biology, 20, R613, 10.1016/j.cub.2010.07.019 · DOI
- DL Breitburg, 2000, Oyster reef restoration: convergence of harvest and conservation strategies., J Shellfish Res, 19, 371
- DM Schulte, 2009, Unprecedented restoration of a native oyster metapopulation., Science, 325, 1124, 10.1126/science.1176516 · DOI
- TM Soniat, 1988, Field validation of a habitat suitability index model for the American oyster., Estuaries, 11(2), 87, 10.2307/1351995 · DOI
- JL Curnutt, 2000, Landscape-based spatially explicit species index models for Everglades restoration., Ecol Appl, 10(6), 1849, 10.1890/1051-0761(2000)010[1849:LBSESI]2.0.CO;2 · DOI
- SK Brown, 2000, Habitat suitability index models for eight fish and invertebrate species in Casco and Sheepscot Bays, Maine., N Am J Fish Manage, 20, 408, 10.1577/1548-8675(2000)020<0408:HSIMFE>2.3.CO;2 · DOI
- TA Battista, 1999, Habitat suitability index model for the eastern oyster Crassostrea virginica, in the Chesapeake Bay: A geographic information system approach. M.S. Thesis.
- TK Barnes, 2007, A habitat suitability index model for the eastern oyster (Crassostrea virginica), a tool for restoration of the Caloosahatchee Estuary, Florida., J Shellfish Res, 26(4), 949, 10.2983/0730-8000(2007)26[949:AHSIMF]2.0.CO;2 · DOI
- A Starke, 2011, Restoration of Crassostrea virginica (Gmelin) to the Hudson River. USA: A spatiotemporal modeling approach., J Shellfish Res, 30(3), 671, 10.2983/035.030.0309 · DOI
- EN Powell, 2007, Reevaluation of eastern oyster dredge efficiency in survey mode: Application in stock assessment., North American Journal of Fisheries Management, 27, 492, 10.1577/M04-205.1 · DOI
- SM Ray, 1966, A review of the culture method for detecting Dermocystidium marinum, with suggested modifications and precautions., Proc Natl Shellfish Assoc, 54, 55
- J Mackin, 1962, Oyster disease caused by Dermocystidium marinum and other microorganisms in Louisiana., Publications of the Institute of Marine Science of the University of Texas, 7, 132
- A Craig, 1989, Distribution of Perkinsus marinus in Gulf coast oyster populations., Estuaries, 12, 82, 10.2307/1351499 · DOI
- A Gribov, 2011, Local polynomials for data detrending and interpolation in the presence of barriers., Stoch Environ Res Risk Assess, 25, 1057, 10.1007/s00477-011-0488-2 · DOI
- EW Cake, 1983, Habitat suitability index models: Gulf of Mexico American oyster., U.S. Dept Int Fish Wildl Serv, FWS/OBS-82/10, 37
- A Villalba, 2004, Perkinsosis in molluscs: a review., Aquatic Living Resources, 17, 411, 10.1051/alr:2004050 · DOI
- JD Andrews, 1988, Management strategies to control the disease caused by Perkinsus marinus., Am Fish Soc Spec Pub, 18, 257
- J Carlsson, 2008, Evaluating recruitment contribution of a selectively bred aquaculture line of the oyster, Crassostrea virginica used in restoration efforts., J Shellfish Res, 27(5), 1117, 10.2983/0730-8000-27.5.1117 · DOI
- VG Economio, 2005, Performance of “natural Dermo-resistant” oyster stocks – survival, disease, growth, condition, and energy reserves., J Shellfish Res, 24(1), 143
- RW Menzel, 1958, Causes of depletion of oysters in St. Vincent Bay, Apalachicola Bay, Florida., Proc Natl Shellfish Assoc, 48, 66
- CL MacKenzie Jr, 1977, Development of an aquaculture program for rehabilitation of damaged oyster reefs in Mississippi., US Fish Wildl Serv Mar Fish Rev, 39, 1
- TM Soniat, 1996, Epizootiology of Perkinsus marinus disease of eastern oysters in the Gulf of Mexico., Journal of Shellfish Research, 17, 1149
- VL Loosanoff, 1953, Behavior of oysters in water of low salinities., Proc Natl Shellfish Assoc, 43, 135
- RL Allen, 1989, Environmental influences on the oyster industry along the west coast of Florida., J Shellfish Res, 8, 95
- RJ Livingston, 1997, Freshwater input to a gulf estuary: Long-term control of trophic organization., Ecol Appl, 7, 277, 10.1890/1051-0761(1997)007[0277:FITAGE]2.0.CO;2 · DOI
- J Levinton, 2011, Climate change, precipitation and impacts on an estuarine refuge from disease., PLoS ONE, 6, e18849, 10.1371/journal.pone.0018849 · DOI
- FLE Chu, 1996, Laboratory investigations of susceptibility, infectivity and transmission of Perkinsus marinus in oysters., J Shellfish Res, 15, 57
- J Widdows, 1989, Effects of hypoxia and anoxia on survival, energy metabolism, and feeding of oyster larvae (Crassostrea virginica, Gmelin)., Biol Bull, 177, 154, 10.2307/1541843 · DOI
- HS Lenihan, 1998, How habitat degradation through fishery disturbance enhances impacts of hypoxia on oyster reefs., Ecological Applications, 8, 128, 10.1890/1051-0761(1998)008[0128:HHDTFD]2.0.CO;2 · DOI
- VL Loosanoff, 1948, Effects of turbidity on feeding of oysters., Proc Natl Shellfish Assoc, 1947, 40
- RW Smith, 2001, Benthic response index for assessing infaunal communities on the southern California mainland shelf., Ecol Appl, 11, 1073, 10.1890/1051-0761(2001)011[1073:BRIFAI]2.0.CO;2 · DOI
- YC Allen, 2005, High resolution mapping and classification of oyster habitats in nearshore Louisiana using sidescan sonar., Estuaries, 28, 435, 10.1007/BF02693925 · DOI
- RE Grizzle, 2005, Mapping and characterizing subtidal oyster reefs using acoustic techniques, underwater videography, and quadrat counts., American Fisheries Society Symposium, 41, 153
- RJ Kennedy, 1999, A survey of the current status of the flat oyster (Ostrea edulis) in Stangford Lough, Northern Ireland., Proceedings of the Royal Irish Academy, 99B, 79
Cited by
Sorted by citations
Pine, W. E., Johnson, F. A., Frederick, P. C., & Coggins, L. G. (2022) · Marine and Coastal Fisheries · doi:10.1002/mcf2.10192 · Cited by 16
Metadata
- Authors
- Beseres Pollack, J., Cleveland, A., Palmer, T. A., Reisinger, A. S., & Montagna, P. A.
- Venue
- PLoS ONE
- Publisher
- Public Library of Science (PLoS)
- Published
- 2012-07-11
- Volume
- 7
- Issue
- 7
- Pages
- e40839
- ISSN
- 1932-6203
- PMC
- PMC3394728
- Cited by
- 66
- References
- 1
- Language
- en
About these checks
Registry, retraction, Cites and statistics results are computed, not judged, with one exception: a printed reference that no index lists is read once by a model before it counts as a citation error. Claims are extracted by a model and kept only when their quote appears verbatim in the text; each cited source is then checked, with a model’s help, for whether it says what the claim relies on. Those verdicts can be wrong — read the claim’s quote and the cited source before relying on one.
Statistics and arithmetic are recomputed, not judged.
Confidence bands are shown only for fields calibrated on our annotated test set. None is calibrated yet, so no band is shown.
What counts as a claim ›How we measure confidence ›How we check this ›
Are you an author, or do you see a problem with this page? Request a review
How to cite
Cite CoChat for the checks on this page, and the paper for its own findings.
- This page
- CoChat. (2026). Citation check: A Restoration Suitability Index Model for the Eastern Oyster (Crassostrea virginica) in the Mission-Aransas Estuary, TX, USA. https://app.cochat.ai/papers/10.1371/journal.pone.0040839
- The paper
- Beseres Pollack, J., Cleveland, A., Palmer, T. A., Reisinger, A. S., & Montagna, P. A. (2012). A Restoration Suitability Index Model for the Eastern Oyster (Crassostrea virginica) in the Mission-Aransas Estuary, TX, USA. PLoS ONE. https://doi.org/10.1371/journal.pone.0040839
