

The DOI matches its Crossref record; 51 of the 51 references it cites were found in a registry or an index.
Negative Regulation of Neuromedin U mRNA Expression in the Rat Pars Tuberalis by Melatonin
Open accessAbstract
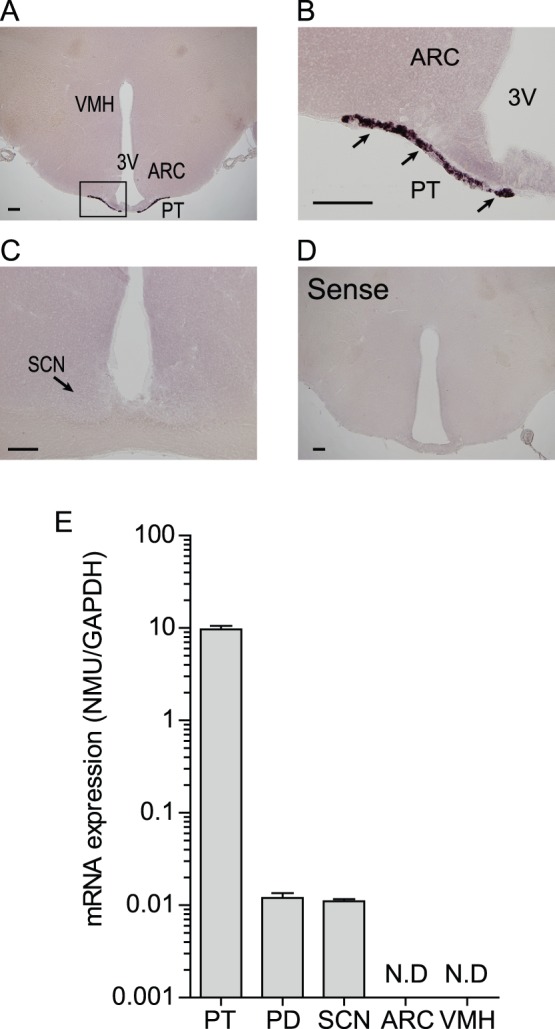
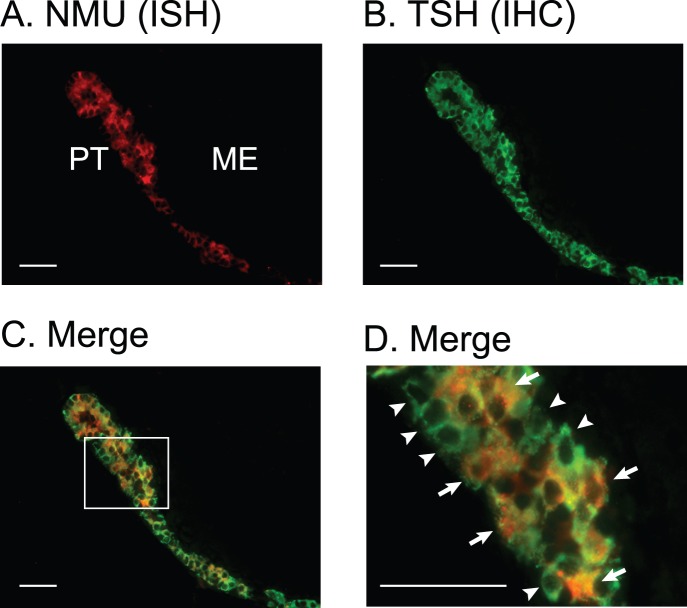
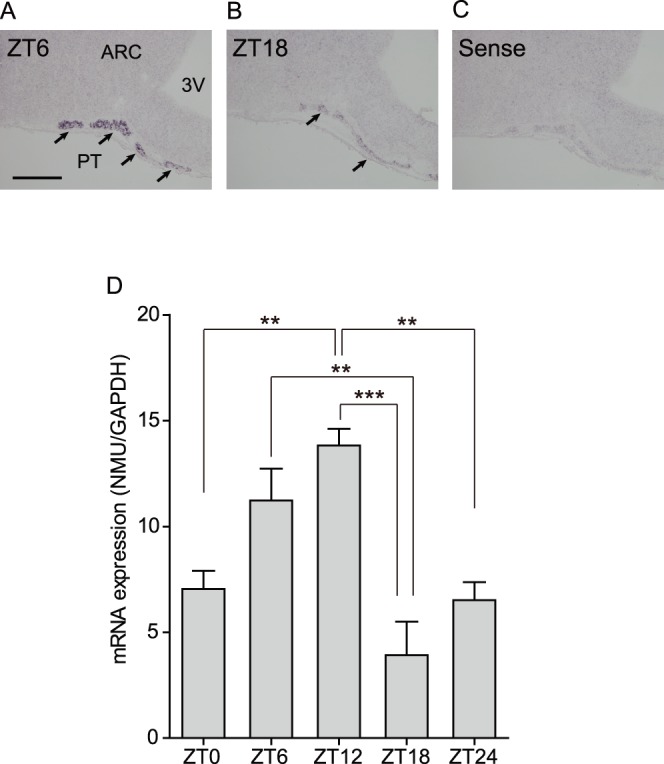
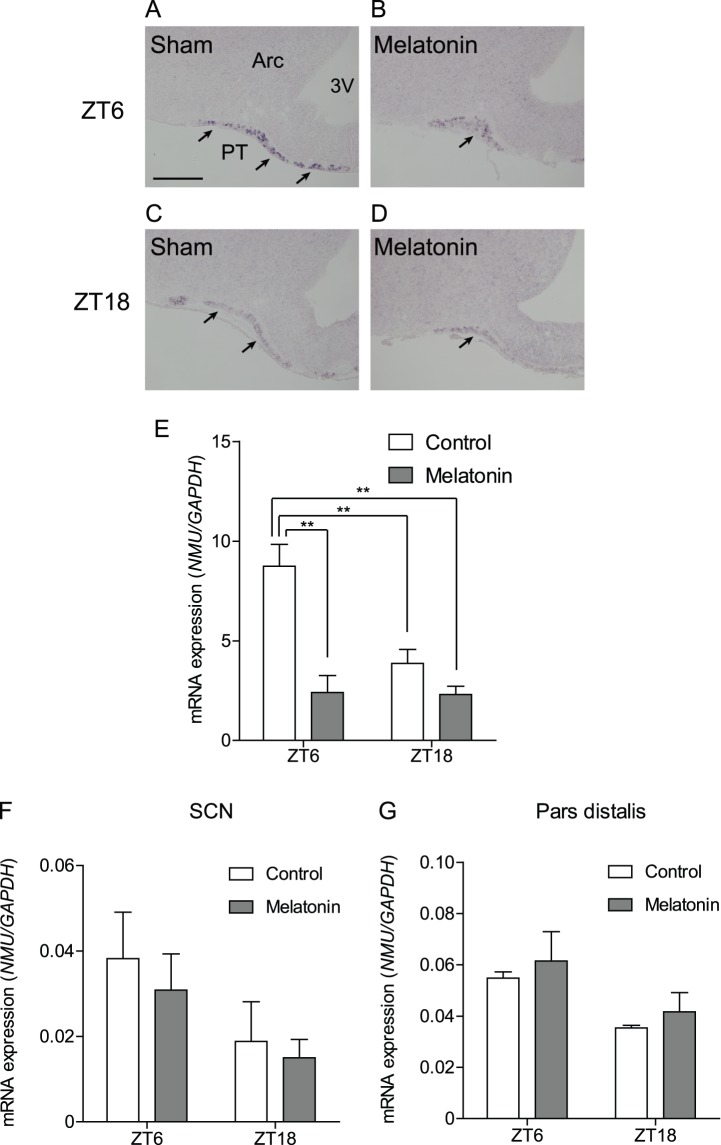
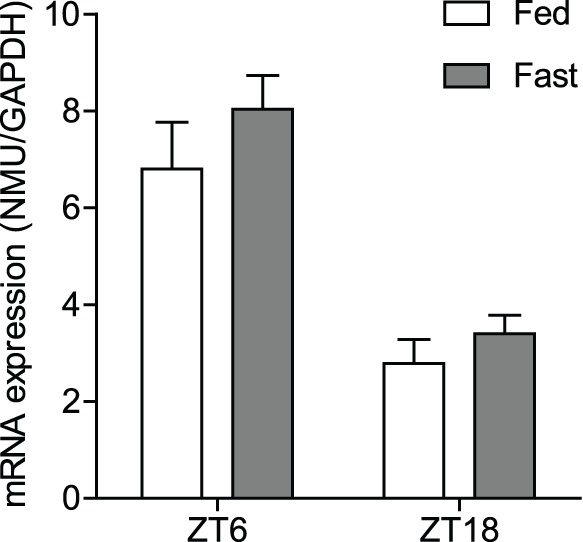
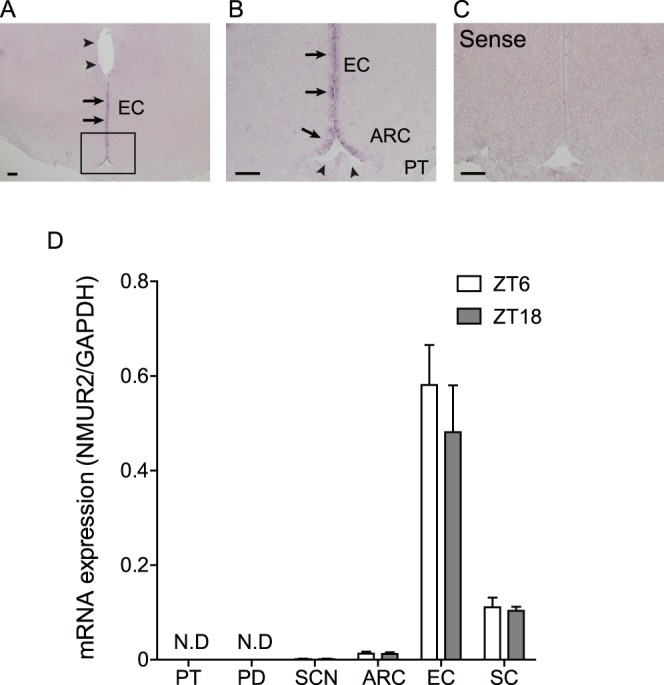
The pars tuberalis (PT) is part of the anterior pituitary gland surrounding the median eminence as a thin cell layer. The characteristics of PT differ from those of the pars distalis (PD), such as cell composition and gene expression, suggesting that the PT has a unique physiological function compared to the PD. Because the PT highly expresses melatonin receptor type 1, it is considered a mediator of seasonal and/or circadian signals of melatonin. Expression of neuromedin U (NMU) that is known to regulate energy balance has been previously reported in the rat PT; however, the regulatory mechanism of NMU mRNA expression and secretion in the PT are still obscure. In this study, we examined both the diurnal change of NMU mRNA expression in the rat PT and the effects of melatonin on NMU in vivo. In situ hybridization and quantitative PCR analysis of laser microdissected PT samples revealed that NMU mRNA expression in the PT has diurnal variation that is high during the light phase and low during the dark phase. Furthermore, melatonin administration significantly suppressed NMU mRNA expression in the PT in vivo. On the other hand, 48 h fasting did not have an effect on PT-NMU mRNA expression, and the diurnal change of NMU mRNA expression was maintained. We also found the highest expression of neuromedin U receptor type 2 (NMUR2) mRNA in the third ventricle ependymal cell layer, followed by the arcuate nucleus and the spinal cord. These results suggest that NMU mRNA expression in the PT is downregulated by melatonin during the dark phase and shows diurnal change. Considering that NMU mRNA in the PT showed the highest expression level in the brain, PT-NMU may act on NMUR2 in the brain, especially in the third ventricle ependymal cell layer, with a circadian rhythm.
Overview
The claims and statistics of this paper haven’t been checked yet.
Run the check — free, no account needed. It reads the open-access text and checks the sources it cites.
Integrity signals
Registry
Cites
Statistics
Figures
Verification
Claims the paper makes
The claims and statistics of this paper haven’t been checked yet.
Run the check — free, no account needed. It reads the open-access text and checks the sources it cites.
Claims other papers make about this one
Each is checked against this paper’s own text: does it say what the citing paper says it does?
The source backs part of the claim, not all of it — or backs it for a different population, condition or comparison.
In the citing paper
“In the Supplemental Text, we describe eQTL, PheWAS, and model organism evidence supporting the hypothesis that introgressed alleles downregulate NMUR2 in the brain leading to increased morningness61–65.”
From Quantifying the contribution of Neanderthal introgression to the heritability of complex traits (2021) · cites this paper as [65]
Experimental — accuracy not yet measured
Self-check
Percentages, sums and reported differences re-computed from the paper’s own numbers.
The self-check needs the paper’s full text.
Citations
Cites
Light-induced hormone conversion of T4 to T3 regulates photoperiodic response of gonads in birds
Yoshimura, T., Yasuo, S., Watanabe, M., Iigo, M., Yamamura, T., Hirunagi, K., & Ebihara, S. (2003) · Nature · doi:10.1038/nature02117 · Cited by 561
Thyrotrophin in the pars tuberalis triggers photoperiodic response
Nakao, N., Ono, H., Yamamura, T., Anraku, T., Takagi, T., Higashi, K., Yasuo, S., Katou, Y., Kageyama, S., Uno, Y., et al. (2008) · Nature · doi:10.1038/nature06738 · Cited by 539
Badness, T. J., Powers, J. B., Hastings, M. H., Bittman, E. L., & Goldman, B. D. (1993) · Journal of Pineal Research · doi:10.1111/j.1600-079x.1993.tb00903.x · Cited by 531
Identification of receptors for neuromedin U and its role in feeding
Howard, A. D., Wang, R., Pong, S., Mellin, T. N., Strack, A. M., Guan, X.-M., Zeng, Z., Williams, D. L., Feighner, S. D., Nunes, C. N., et al. (2000) · Nature · doi:10.1038/35017610 · Cited by 413
Minamino, N., Kangawa, K., & Matsuo, H. (1985) · Biochemical and Biophysical Research Communications · doi:10.1016/0006-291x(85)91726-7 · Cited by 303
Neuromedin U and Its Receptors: Structure, Function, and Physiological Roles
Brighton, P. J., Szekeres, P. G., & Willars, G. B. (2004) · Pharmacological Reviews · doi:10.1124/pr.56.2.3 · Cited by 284
Involvement of thyrotropin in photoperiodic signal transduction in mice
Ono, H., Hoshino, Y., Yasuo, S., Watanabe, M., Nakane, Y., Murai, A., Ebihara, S., Korf, H., & Yoshimura, T. (2008) · Proceedings of the National Academy of Sciences · doi:10.1073/pnas.0808952105 · Cited by 279
Lincoln, G. A., & Clarke, I. J. (1994) · Journal of Neuroendocrinology · doi:10.1111/j.1365-2826.1994.tb00580.x · Cited by 273
Neuromedin U has a novel anorexigenic effect independent of the leptin signaling pathway
Hanada, R., Teranishi, H., Pearson, J. T., Kurokawa, M., Hosoda, H., Fukushima, N., Fukue, Y., Serino, R., Fujihara, H., Ueta, Y., et al. (2004) · Nature Medicine · doi:10.1038/nm1106 · Cited by 208
Carlson, L. L., Weaver, D. R., & Reppert, S. M. (1989) · Endocrinology · doi:10.1210/endo-125-5-2670 · Cited by 187
Cited by
Sorted by citations
Melatonin as a Hormone: New Physiological and Clinical Insights
Cipolla‐Neto, J., & do Amaral, F. G. (2018) · Endocrine Reviews · doi:10.1210/er.2018-00084 · Cited by 685
Neuromedin U: A Multifunctional Neuropeptide with Pleiotropic Roles
Martínez, V. G., & O’Driscoll, L. (2015) · Clinical Chemistry · doi:10.1373/clinchem.2014.231753 · Cited by 134
Korf, H. (2017) · General and Comparative Endocrinology · doi:10.1016/j.ygcen.2017.05.011 · Cited by 103
Quantifying the contribution of Neanderthal introgression to the heritability of complex traits
McArthur, E., Rinker, D. C., & Capra, J. A. (2021) · Nature Communications · doi:10.1038/s41467-021-24582-y · Cited by 71
A unifying hypothesis for control of body weight and reproduction in seasonally breeding mammals
Helfer, G., Barrett, P., & Morgan, P. J. (2018) · Journal of Neuroendocrinology · doi:10.1111/jne.12680 · Cited by 68
Metadata
- Authors
- Aizawa, S., Sakata, I., Nagasaka, M., Higaki, Y., & Sakai, T.
- Affiliations
- Saitama University (JP)
- Corresponding author
- Sakai, Takafumi
- Venue
- PLoS ONE
- Publisher
- Public Library of Science (PLoS)
- Published
- 2013-07-02
- Volume
- 8
- Issue
- 7
- Pages
- e67118
- ISSN
- 1932-6203 (ISSN-L)
- PMC
- PMC3699551
- OpenAlex
- W2001746592
- Cited by
- 23
- References
- 51
- Citations by year
- 2025: 1 · 2023: 4 · 2022: 3 · 2021: 1 · 2020: 1 · 2019: 4 · 2018: 2 · 2017: 3 · 2016: 1 · 2015: 1 · 2014: 1 · 2013: 1
- FWCI
- 0.90
- Type
- journal article
- Language
- en
- Open access
- gold
- doi.org
- Locations
- PLoS ONE (publishedVersion, cc-by)
- Europe PMC (PubMed Central) (publishedVersion, cc-by)
- PubMed Central (publishedVersion, cc-by)
- PubMed (publishedVersion)
- RePEc: Research Papers in Economics (submittedVersion)
- DOAJ (DOAJ: Directory of Open Access Journals) (submittedVersion, cc-by-sa)
- Topics
- Life Sciences › Neuroscience › Endocrine and Autonomic Systems › Circadian rhythm and melatonin
- Life Sciences › Neuroscience › Cellular and Molecular Neuroscience › Neuropeptides and Animal Physiology
- Health Sciences › Medicine › Reproductive Medicine › Hypothalamic control of reproductive hormones
- Keywords
- neuromedin U, pars tuberalis, melatonin, diurnal variation, circadian rhythm, anterior pituitary, mRNA expression regulation, fasting, arcuate nucleus, energy balance
- MeSH terms
- Animals, Arcuate Nucleus of Hypothalamus, Circadian Rhythm, Ependyma, Gene Expression Regulation, Male, Melatonin, Neuropeptides, Pituitary Gland, Anterior, RNA, Messenger, Spinal Cord, Signal Transduction, Rats, Wistar, Photoperiod, Receptors, Neurotransmitter, Rats, Laser Capture Microdissection
About these checks
Registry, retraction, Cites and statistics results are computed, not judged, with one exception: a printed reference that no index lists is read once by a model before it counts as a citation error. Claims are extracted by a model and kept only when their quote appears verbatim in the text; each cited source is then checked, with a model’s help, for whether it says what the claim relies on. Those verdicts can be wrong — read the claim’s quote and the cited source before relying on one.
Statistics and arithmetic are recomputed, not judged.
Confidence bands are shown only for fields calibrated on our annotated test set. None is calibrated yet, so no band is shown.
What counts as a claim ›How we measure confidence ›How we check this ›
Are you an author, or do you see a problem with this page? Request a review
