

The DOI matches its Crossref record; 65 of the 66 references it cites were found in a registry or an index.
Visualising Androgen Receptor Activity in Male and Female Mice
Open accessAbstract
Androgens, required for normal development and fertility of males and females, have vital roles in the reproductive tract, brain, cardiovascular system, smooth muscle and bone. Androgens function via the androgen receptor (AR), a ligand-dependent transcription factor. To assay and localise AR activity in vivo we generated the transgenic "ARE-Luc" mouse, expressing a luciferase reporter gene under the control of activated endogenous AR. In vivo imaging of androgen-mediated luciferase activity revealed several strongly expressing tissues in the male mouse as expected and also in certain female tissues. In males the testes, prostate, seminal vesicles and bone marrow all showed high AR activity. In females, strong activity was seen in the ovaries, uterus, omentum tissue and mammary glands. In both sexes AR expression and activity was also found in salivary glands, the eye (and associated glands), adipose tissue, spleen and, notably, regions of the brain. Luciferase protein expression was found in the same cell layers as androgen receptor expression. Additionally, mouse AR expression and activity correlated well with AR expression in human tissues. The anti-androgen bicalutamide reduced luciferase signal in all tissues. Our model demonstrates that androgens can act in these tissues directly via AR, rather than exclusively via androgen aromatisation to estrogens and activation of the estrogen receptor. Additionally, it visually demonstrates the fundamental importance of AR signalling outside the normal role in the reproductive organs. This model represents an important tool for physiological and developmental analysis of androgen signalling, and for characterization of known and novel androgenic or antiandrogenic compounds.
Overview
The claims and statistics of this paper haven’t been checked yet.
Run the check — free, no account needed. It reads the open-access text and checks the sources it cites.
Integrity signals
Registry
Cites
Statistics
Figures
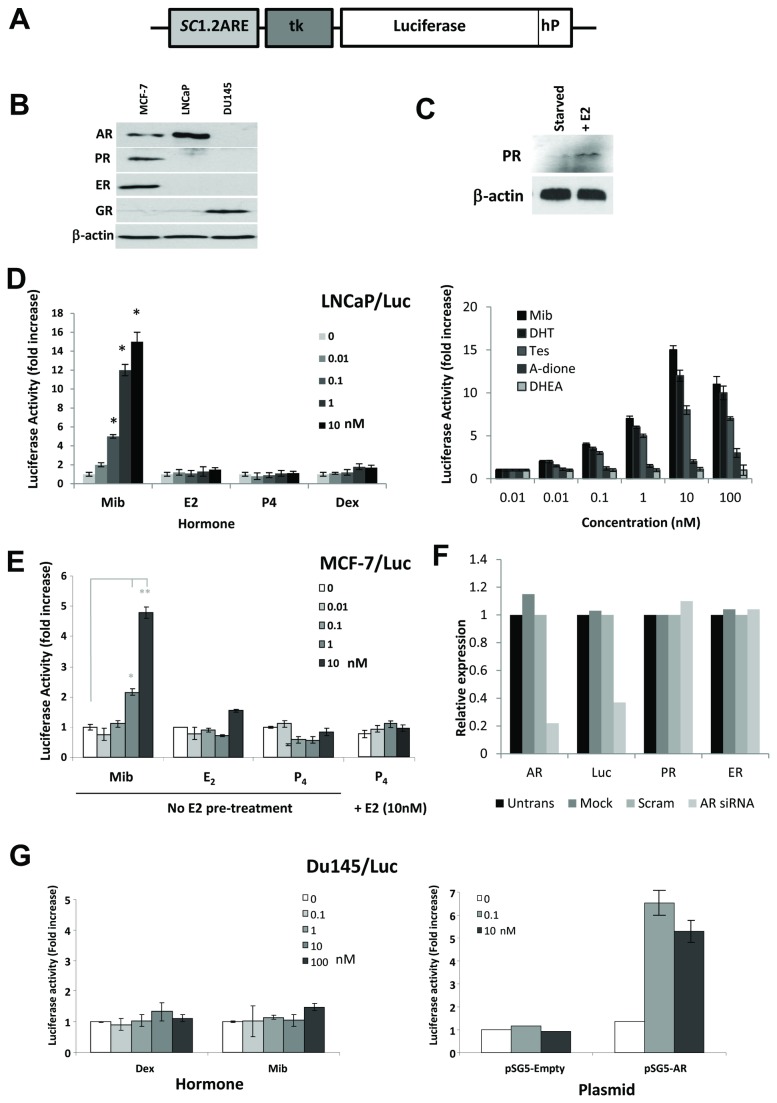
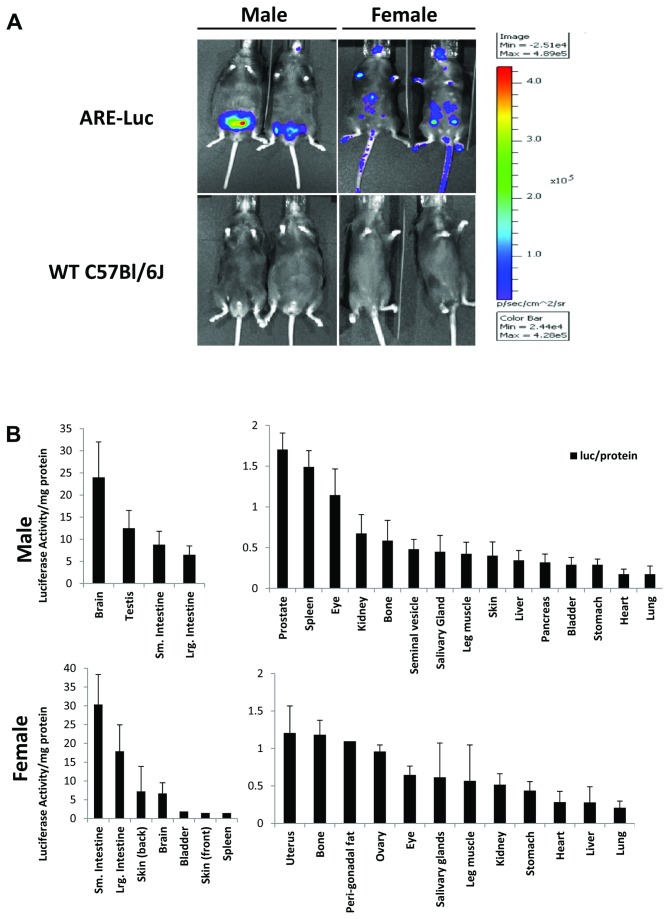
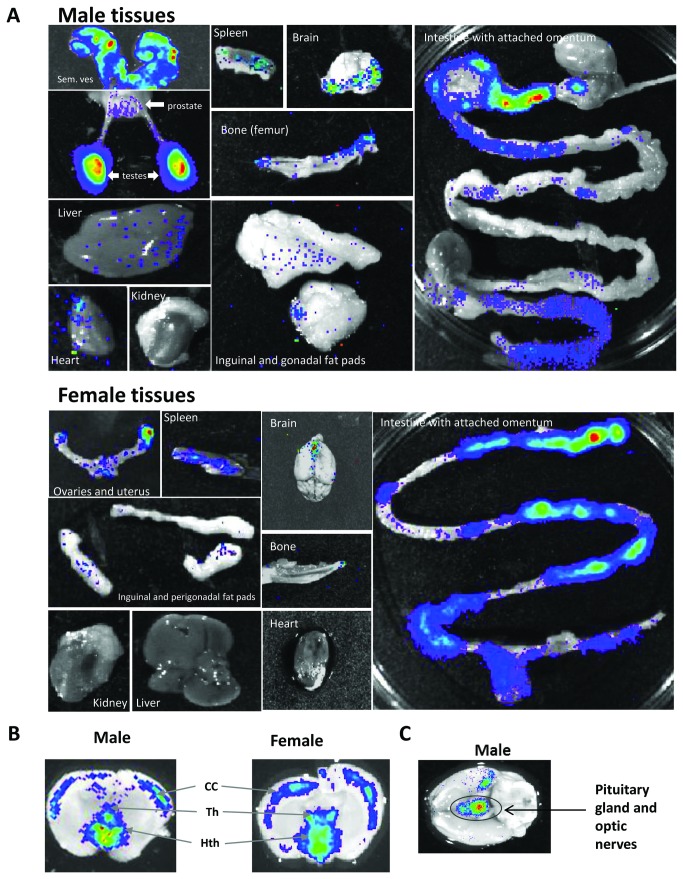
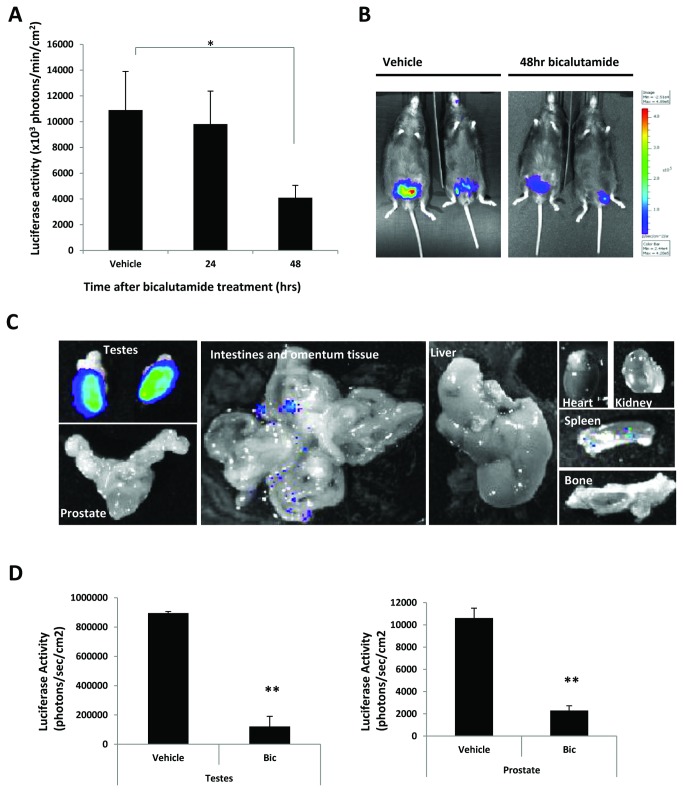
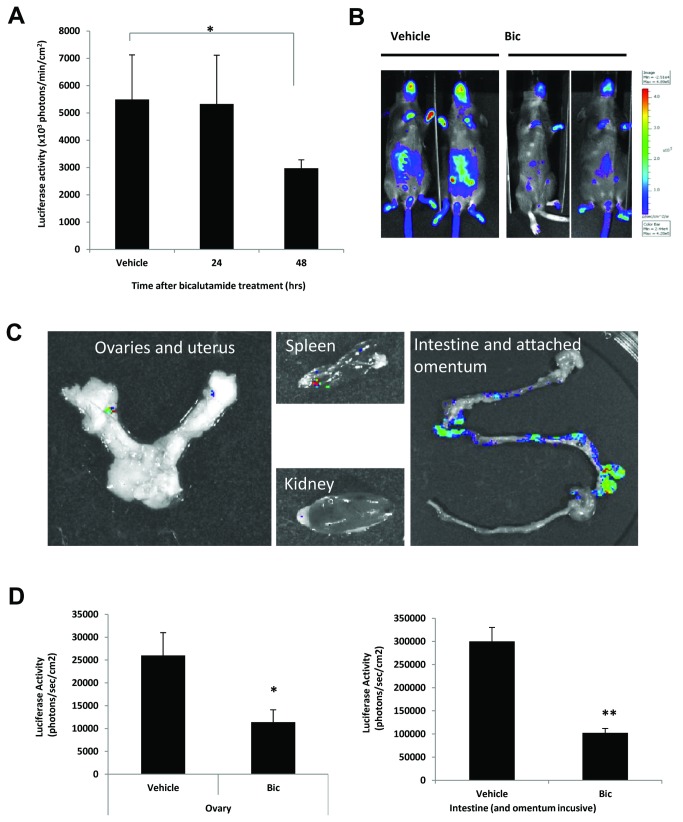
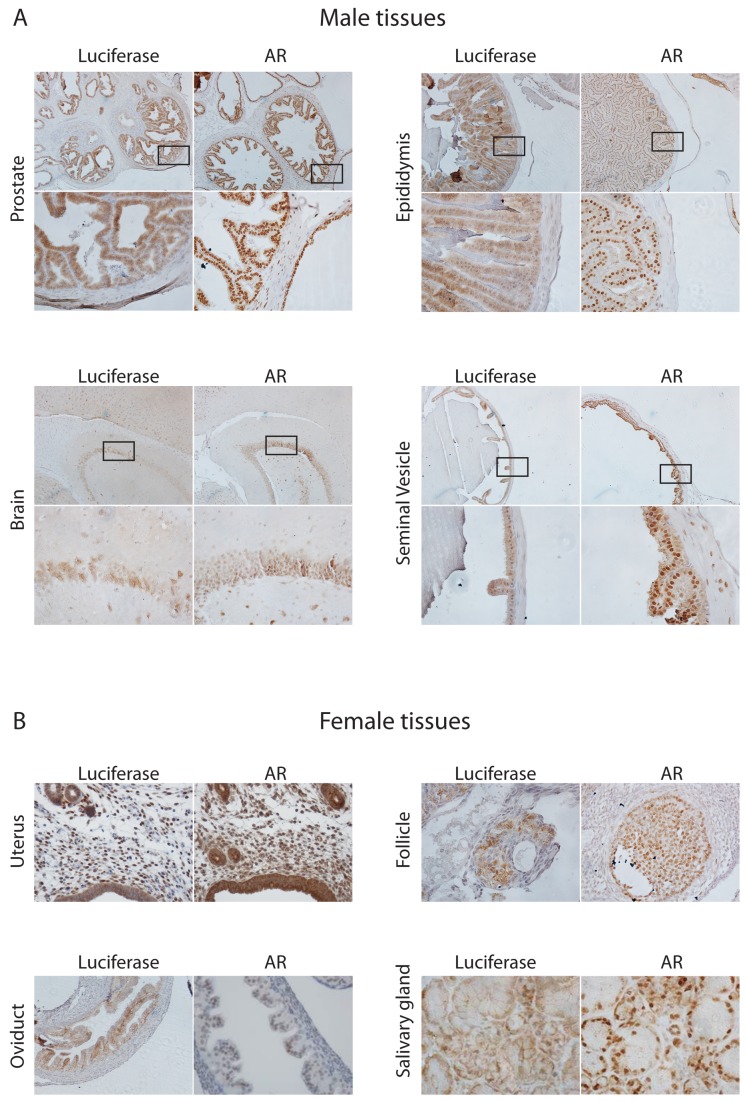
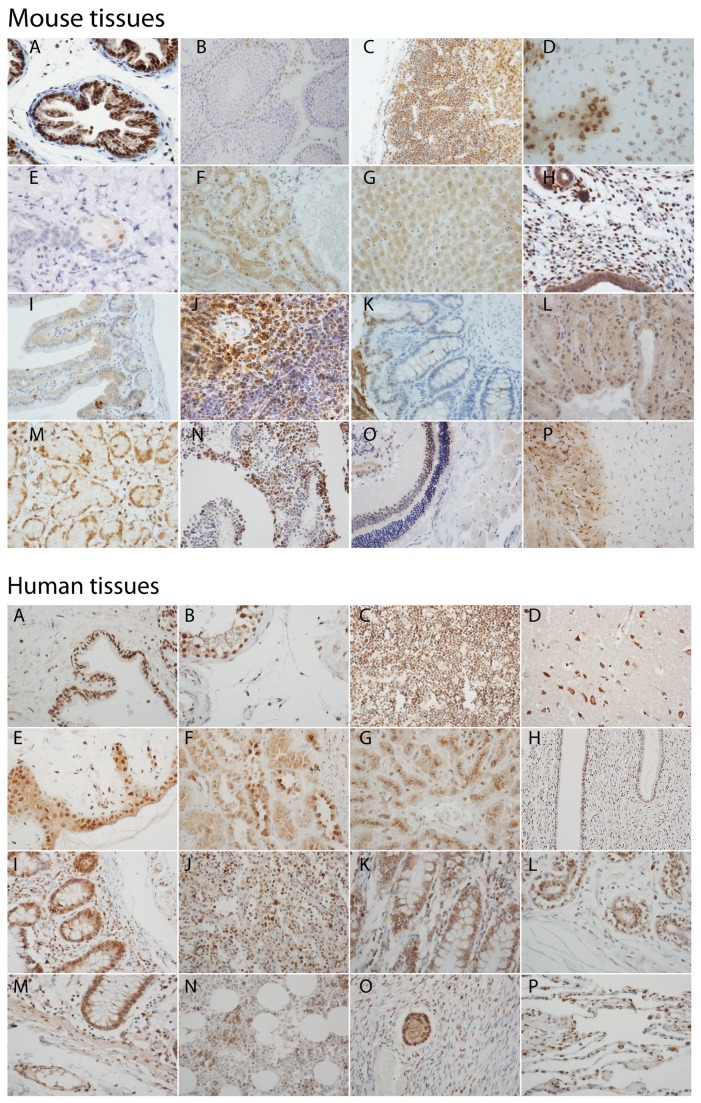
Verification
Claims the paper makes
The claims and statistics of this paper haven’t been checked yet.
Run the check — free, no account needed. It reads the open-access text and checks the sources it cites.
Claims other papers make about this one
Each is checked against this paper’s own text: does it say what the citing paper says it does?
In the citing paper
“In adults AR is expressed across the cerebral cortex, including associative cortex, in both sexes in rodents (Clancy et al., 1992; Dart et al., 2013; DonCarlos et al., 2006; Feng et al., 2010; Kritzer, 2004; Simerly et al., 1990; Young and Chang, 1998), and humans (Bezdickova et al., 2007; Puy et al., 1995; Sarrieau et al., 1990).”
From Does puberty mark a transition in sensitive periods for plasticity in the associative neocortex? (2017) · cites this paper as Dart et al., 2013
Self-check
Percentages, sums and reported differences re-computed from the paper’s own numbers.
The self-check needs the paper’s full text.
Citations
Cites
Normal Sexual Dimorphism of the Adult Human Brain Assessed by In Vivo Magnetic Resonance Imaging
Goldstein, J. M. (2001) · Cerebral Cortex · doi:10.1093/cercor/11.6.490 · Cited by 1,052
Origin of Murine B Cell Lineages
Kantor, A. B., & Herzenberg, L. A. (1993) · Annual Review of Immunology · doi:10.1146/annurev.iy.11.040193.002441 · Cited by 578
Expression of Sry , the mouse sex determining gene
Hacker, A., Capel, B., Goodfellow, P. N., & Lovell-Badge, R. H. (1995) · Development · doi:10.1242/dev.121.6.1603 · Cited by 571
Transepithelial Transport of Immunoglobulins
Mostov, K. E. (1994) · Annual Review of Immunology · doi:10.1146/annurev.iy.12.040194.000431 · Cited by 457
Bachmann, G., Bancroft, J., Braunstein, G., Burger, H., Davis, S., Dennerstein, L., Goldstein, I., Guay, A., Leiblum, S., Lobo, R., et al. (2002) · Fertility and Sterility · doi:10.1016/s0015-0282(02)02969-2 · Cited by 444
Estrogen: Consequences and Implications of Human Mutations in Synthesis and Action
Grumbach, M. M., & Auchus, R. J. (1999) · The Journal of Clinical Endocrinology & Metabolism · doi:10.1210/jcem.84.12.6290 · Cited by 412
Ogawa, S., Chan, J. S. W., Chester, A. E., Gustafsson, J.-Α., Korach, K. S., & Pfaff, D. W. (1999) · Proceedings of the National Academy of Sciences · doi:10.1073/pnas.96.22.12887 · Cited by 399
He, B., Kemppainen, J., Voegel, J. J., Gronemeyer, H., & Wilson, E. M. (1999) · Journal of Biological Chemistry · doi:10.1074/jbc.274.52.37219 · Cited by 372
SOX9 is up-regulated by the transient expression of SRY specifically in Sertoli cell precursors.
Sekido, R., Bar, I., Narváez, V., Penny, G. D., & Lovell-Badge, R. (2004) · Developmental Biology · doi:10.1016/j.ydbio.2004.07.011 · Cited by 362
Androgen Receptor: An Overview
Chang, C., Saltzman, A. G., Yeh, S., Young, W.-J., Keller, E. T., Lee, H., Wang, C., & Mizokami, A. (1995) · Critical Reviews in Eukaryotic Gene Expression · doi:10.1615/critreveukargeneexpr.v5.i2.10 · Cited by 334
Research works printed but not linked: 1
- C Platell, 2000, The omentum, World J Gastroenterol, 6, 169
Cited by
Sorted by citations
Items 101–112 of 112
Ayaz, M. (2019) · DalSpace (Dalhousie University)
Li, Y., Tang, L., Zhao, M., Tang, R., Fang, K., Ge, W., & Du, W. (2023) · SSRN Electronic Journal · doi:10.2139/ssrn.4635248
Folic acid supplementation and its effects on the oestrus cycle of rats.
Irfan, A., Syed, H. B. S., Rabbani, M. A., Abbasi, S., Hashmi, A., & Mir, A. (2023) · The Professional Medical Journal · doi:10.29309/tpmj/2024.31.01.7826
Genetic Mouse Models for Female Reproductive Toxicology Studies
Dávila, J. (2024) · Elsevier eBooks · doi:10.1016/b978-0-323-95488-4.00112-1
Guzmán-Acevedo, Á. R., Caba‐Flores, M. D., Viveros-Contreras, R., & Meza, E. (2024) · Animals · doi:10.3390/ani14243570
Li, R., & DeMayo, F. J. (2025) · Elsevier eBooks · doi:10.1016/b978-0-443-21477-6.00392-8
Selective Androgen Receptor Modulators in Women: What Do We Know, and What Is Still Missing
Vasilev, V., Georgieva, K. N., Kraeva, M. I., Ardasheva, R., Etova, R., & Boyadjiev, N. (2026) · Life · doi:10.3390/life16020359
Progressive HNF1A-MODY pathophysiology revealed by a translational mouse model
Louvet, I., Acosta-Montalvo, A., Saponaro, C., Moreno-Lopez, M., Douffi, S., Karchaoui, A. E., Pasquetti, G., Thévenet, J., Delalleau, N., Gmyr, V., et al. (2026) · JCI Insight · doi:10.1172/jci.insight.198095
Refosco, A., Geelhaar, L., Daniel, D. B., Solhaug, A., Eriksen, G. S., Smeland, H. Y., Lied, G. A., Goksøyr, A., Kögel, T., & Dierkes, J. (2026) · Environmental Pollution · doi:10.1016/j.envpol.2026.129255
Li, X., Sui, C.-L., Zhang, B., 白宇泉, Zhao, Q., & Xu, L. (2026) · Frontiers in Endocrinology · doi:10.3389/fendo.2026.1939223
Metadata
- Authors
- Dart, D. A., Waxman, J., Aboagye, E. O., & Bevan, C. L.
- Affiliations
- Imperial College London (GB)
- Corresponding author
- Bevan, Charlotte L.
- Venue
- PLoS ONE
- Publisher
- Public Library of Science (PLoS)
- Published
- 2013-08-07
- Volume
- 8
- Issue
- 8
- Pages
- e71694
- ISSN
- 1932-6203 (ISSN-L)
- PMC
- PMC3737126
- OpenAlex
- W2045176719
- Cited by
- 112
- References
- 66
- Citations by year
- 2026: 4 · 2025: 7 · 2024: 15 · 2023: 7 · 2022: 8 · 2021: 10 · 2020: 7 · 2019: 6 · 2018: 6 · 2017: 11 · 2016: 13 · 2015: 10 · 2014: 7 · 2013: 1
- FWCI
- 6.84
- Type
- journal article
- Language
- en
- Open access
- gold
- doi.org
- Locations
- PLoS ONE (publishedVersion, cc-by)
- Europe PMC (PubMed Central) (publishedVersion, cc-by)
- PubMed Central (publishedVersion, cc-by)
- PubMed (publishedVersion)
- ORCA Online Research @Cardiff (Cardiff University) (acceptedVersion)
- DOAJ (DOAJ: Directory of Open Access Journals) (submittedVersion, cc-by-sa)
- Figshare (submittedVersion, cc-by)
- Spiral (Imperial College London) (submittedVersion, other-oa)
- Funders
- Genesis Research Trust
- Imperial College London
- Medical Research Council
- Topics
- Life Sciences › Biochemistry, Genetics and Molecular Biology › Endocrinology › Estrogen and related hormone effects
- Life Sciences › Biochemistry, Genetics and Molecular Biology › Cancer Research › Prostate Cancer Treatment and Research
- Health Sciences › Medicine › Endocrinology, Diabetes and Metabolism › Hormonal and reproductive studies
- Keywords
- androgen receptor, androgen signaling, transgenic mouse model, luciferase reporter, in vivo imaging, bicalutamide, androgen receptor antagonists, estrogen receptor, sex differences
- MeSH terms
- Androgen Antagonists, Anilides, Animals, Chlorocebus aethiops, Female, Humans, Male, Mice, Inbred C57BL, Mice, Transgenic, Molecular Sequence Data, Nitriles, Organ Specificity, Receptors, Androgen, Tosyl Compounds, Transcriptional Activation, Genes, Reporter, COS Cells, Luciferases, Firefly, Mice, Mice, 129 Strain, MCF-7 Cells
About these checks
Registry, retraction, Cites and statistics results are computed, not judged, with one exception: a printed reference that no index lists is read once by a model before it counts as a citation error. Claims are extracted by a model and kept only when their quote appears verbatim in the text; each cited source is then checked, with a model’s help, for whether it says what the claim relies on. Those verdicts can be wrong — read the claim’s quote and the cited source before relying on one.
Statistics and arithmetic are recomputed, not judged.
Confidence bands are shown only for fields calibrated on our annotated test set. None is calibrated yet, so no band is shown.
What counts as a claim ›How we measure confidence ›How we check this ›
Are you an author, or do you see a problem with this page? Request a review
